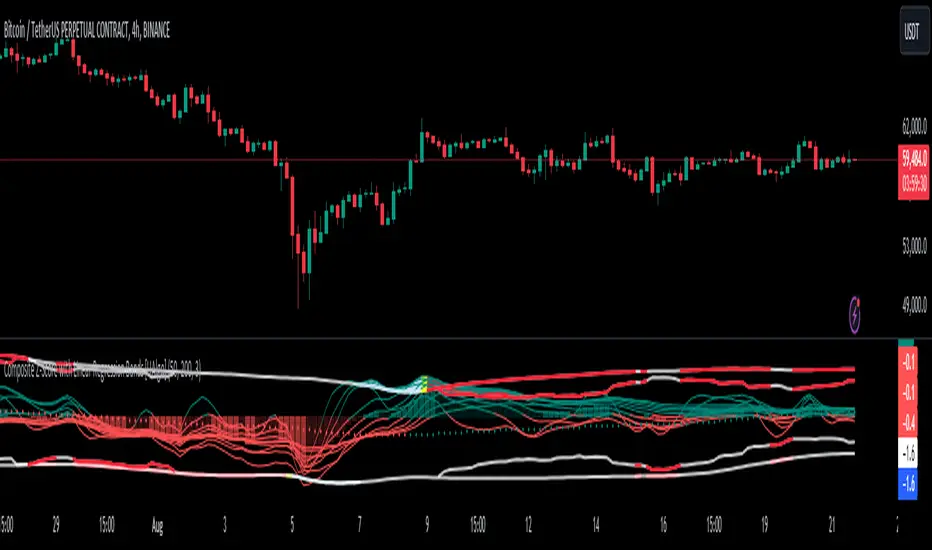
Swing Failure Pattern (SFP) [LuxAlgo]The Swing Failure Pattern indicator highlights Swing Failure Patterns (SFP) on the user chart, a pattern occurring during liquidity generation from significant market participants.
A Confirmation level used to confirm a trend reversal is also included. Users can additionally filter out SFP based on a set Volume % Threshold .
🔶 USAGE
Swing failure patterns occur when candle wicks exceed (above/below) a recent swing level but close back below/above it, and occur from more significant market participants engineering liquidity. This pattern can be indicative of a potential trend reversal.
A label and an accentuated wick line highlight the SFP (both can be disabled).
Using a higher "Swings" period will not return different SFP but will however potentially reduce their detection rate.
🔹 Confirmation Level
The confirmation level is the highest point between the previous swing and SFP for a bullish SFP, and the lowest point for a bearish SFP. This level allows confirming a trend reversal after an SFP once the price breaks it.
A small triangle will be displayed when the price closes beyond the confirmation level.
A more reactive and contrarian approach could use the SFP as an entry point, and the confirmation level for taking (partial) profit, or stop loss. The example below shows a possible scenario:
🔹 Volume % Threshold
During the occurrence of an SFP, the Volume % Threshold option allows comparing the cumulative volume outside the Swing level to the total volume of the candle. The following options are included:
Volume outside swing < Threshold: Volume outside the Swing level needs to be lower than x % of total candle volume. Prevent excessive liquidity generation.
Volume outside swing > Threshold: Volume outside the Swing level needs to be higher than x % of total candle volume. Requires more significant liquidity to be generated.
None: No extra filter is applied
Note that in the above case, the left SFP is no longer highlighted because the volume above the swing level was higher than the 25% threshold of the total volume.
When we change the setting to "Volume outside swing > Threshold", we get the reversed situation.
The "Volume outside Swing level" is obtained using intrabar - Lower TimeFrame (LTF) data.
At the intrabar (LTF) level, there are a maximum of 100K bars available. When using the Volume % Threshold filter, a vertical line will highlight the maximum period during which intrabars are available.
🔶 DETAILS
🔹 LTF Settings
When 'Auto' is enabled (Settings, LTF), the LTF will be the nearest possible x times smaller TF than the current TF. When 'Premium' is disabled, the minimum TF will always be 1 minute to ensure TradingView plans lower than Premium don't get an error.
Examples with current Daily TF (when Premium is enabled):
500 : 3-minute LTF
1500 (default): 1-minute LTF
5000: 30 seconds LTF (1 minute if Premium is disabled)
The concerning LTF can be seen at the right-top (default) corner.
🔶 SETTINGS
Swings: Period used for the swing detection, with higher values returning longer-term Swing Levels.
Bullish SFP: enable/disable bullish Swing Failure Patterns.
Bearish SFP: enable/disable bearish Swing Failure Patterns.
🔹 Volume Validation
Validation:
Volume outside swing < Threshold: The volume outside the swing level needs to be lower than x % of the total volume.
Volume outside swing > Threshold: The volume outside the swing level needs to be higher than x % of the total volume.
None: No extra validation is applied.
Volume % Threshold: % of total volume as threshold.
Auto + multiple: Adjusts the initial set LTF
LTF: LTF setting
Premium: Enable when your TradingView plan is Premium or higher
🔹 Dashboard
Show Dashboard: Display applied Lower Timeframe (LTF)
Location: Location of the dashboard
Size: Size of the dashboard
🔹 Style
Swing Lines
Confirmation Lines
Swing Failure Wick
Swing Failure Label
Lines / Labels: Color for lines and labels
SFP Wicks: Color for SFP wick line
Cari dalam skrip untuk "reversal"
Channel CorridorOVERVIEW
The Channel Corridor indicator is designed to operate on a log chart of asset prices (e.g., BTCUSD), specifically on a weekly timeframe.
The intent of the indicator is to provide a visual representation of market dynamics, focusing on a dynamically adjusted corridor around a Simple Moving Average (SMA) of an asset's price. The corridor adapts to changing market conditions. The indicator includes channels within the corridor for additional reference points.
PURPOSE
Trend Identification: The channel corridor can aid in visualising the overall trend, as it dynamically adjusts the corridor based on an SMA and user-defined parameters.
Volatility Assessment: The width of the channel corridor can may act as a gauge of market volatility.
Reversal Points: The channel corridor may signal potential trend reversals or corrections when an asset price approaches the upper or lower bounds of the corridor.
Long-Term Trend Analysis: The channel corridor may aid in longer-term trend analysis.
CONSIDERATIONS
Validation: It's recommended that careful back-testing over historical data be done before acting on any identified opportunities.
User Discretion: Trading decisions should not rely solely on this script. Users should exercise judgment and consider market conditions.
CREDIT
Ideation: Thanks @Sw1ngTr4der for the idea and corridor seed code
Edri Extreme Points Buy & SellEDRI EXTREME POINTS BUY & SELL INDICATOR
This Buy and Sell (non-repainting) indicator uses signals based on the combined CCI/Momentum and RSI indicators and optional regular divergence.
The idea of the indicator is to look for a potential reversal after the price reached extreme points (overbought or oversold) and signals an entry when the price shows signs of momentum for reversal.
Optionally, it considers finding a divergence while RSI is at the extreme levels to improve the predictability of a possible reversal.
Additionally, the indicator includes a simple Mean Reversion visual on the chart to assist users in identifying extreme price levels and potential reversal opportunities. It features upper and lower bands that can be optionally plotted, showing calculated values where price bounces at those extreme levels.
The purpose of these bands is to help traders avoid getting trapped in the middle of a trend and to guide them to buy low and sell high. (It's important to note that this is purely a visual aid and does not impact the generation of trade signals.)
By utilizing the Mean Reversion bands alongside the entry conditions, traders can gain insights into potential price reversals and make more informed decisions about when to enter or exit trades.
Buy and Sell Entry conditions:
• The indicator looks at the CCI/Momentum indicator to turn positive (if buy) or negative (if sell) after the RSI was overbought or oversold in the recent past.
• It also checks if there is a 3-period regular bullish divergence in the RSI (if buy), or regular bearish divergence (if sell) and consider these in the entry condition.
• If these conditions are met, this indicator suggests that it may be a good time to enter a trade.
In summary this is how this indicator works:
• The indicator takes input settings such as the choice between using CCI or Momentum as the entry signal source, length parameters for CCI/Momentum, RSI levels for overbought and oversold conditions, RSI length, and options to plot mean reversion bands on the chart.
• It calculates the CCI and Momentum and RSI values based on user-defined length..
• It checks for regular bullish and bearish divergences (3 periods) in the RSI if the option is enabled.
• The script plots shapes on the chart to indicate the buy and sell signals based on the entry conditions.
• If the mean reversion bands option is enabled, it calculates the mean reversion, standard deviation, upper band, and lower band values.
• It also plots the upper band, mean reversion line, and lower band on the chart if the mean reversion bands option is enabled.
• This indicator includes alert conditions to generate alerts for the buy and sell signals.
• On top of that, users can opt to use only one alert for both buy and sell signals. (This can save Trading view subscribers with limited alerts.)
Important! Please do not consider everything you read here as financial advice. Additionally, do not rely solely on indicators for making your trading decisions. It is important to note that no indicator or strategy is perfect. Therefore, it is always recommended to backtest everything and practice proper risk management.
I appreciate your feedback on this indicator. As I am new to script development, I am open to comments and suggestions to improve it. If you encounter any issues while using this indicator, please let me know in the comments section. If you find it helpful, I kindly ask for your support in boosting it. Thank you for your cooperation.
Trend IndicatorThis indicator has different features:
1. Ichimoku = this indicator can plot Ichimoku calculated both in the common formula and with the volume average, you can choose the calculator method for each line.
2. Channel and Bands = this mode allows the user to choose from channel and band, "channel" shows the Keltner channel, and "band" shows the Bollinger bands. Both the indicators are calculated including the volume in the formula of the average midpoint.
3. Color candle = this function allows the user to see two different colors of candles on the chart, the positive color occurs when both the long-term average and the short team average of price calculated using the volume is above the two averages calculated without the volume. This function is great to analyze the volume pressure, useful to identify trend continuation and exhaustion.
4. Extreme reversal zones = this is a version of the Keltner channels calculated over a high number of candles and with high deviation, to identify the potential zones of reversal.
Note that in the "Ichimoku" indicator, the backline is the T.R.A.M.A. indicator, created and published open source by Lux Algo, which I thank for the script.
AG FX - Pivot PointsPivot Points High Low
Definition
The Pivot Points High Low indicator is used to determine and anticipate potential changes in market price and reversals. The Highs referred to in the title are created based on the number of bars that exhibit lower highs on either side of a Pivot Point High, whereas the Lows are created based on the number of bars that exhibit higher lows on either side of a Pivot Point Low.
Calculations
As mentioned above, Pivot Point Highs are calculated by the number of bars with lower highs on either side of a Pivot Point High calculation. Similarly, Pivot Point Lows are calculated by the number of bars with higher lows on either side of a Pivot Point Low calculation.
Takeaways and what to look for
A Pivot Point is more significant or noteworthy if the trend is extended or longer than average. This can mean if a trader selects a higher period for before and after the Pivot Point, the trend could be longer and therefore prove the Pivot Point itself more notable.
Additionally, Pivot Points can help a trader assess where would be best to draw. By analyzing price changes and reversals, a trader has more of an ability to determine and predict price patterns and general price trends.
Summary
The Pivot Points High Low indicator can predict and determine price changes and potential reversals in the market. Pivot Points can also help traders identify price patterns and trends, depending on the period and significance of the Pivot Point value.
Trend Bounce [racer8]I discovered this mechanical trading system titled "This Algo Strategy Has Only 3 rules and 62% Win Rate".
I coded the trading system on Tradingview...and now I am introducing it to you guys.
I modified the system so that it has both buy & sell signals.
I've tested it repeatedly in different markets on TV including stocks, currency pairs, bitcoin, and commodities...and it works!
A buy signal is generated whenever the current close is below the previous 7-day low and the current close is above the 200 period moving average.
A sell signal is generated whenever the current close is above the previous 7-day high and the current close is below the 200 period moving average.
The system also has a 2-ATR stop loss which I coded.
This system is unique in that it has both trend-following and reversal elements in it.
The system trades short-term reversals while obeying the long-term trend.
Essentially, you are buying the dips of bullish trends! & selling at the peaks of bearish trends!
Enjoy ♡
BTC 1m Chop Top/Bottom Reversal (Stable Entries)Strategy Description: BTC 5m Chop Top/Bottom Reversal (Stable Entries)
This strategy is engineered to capture precise reversal points during Bitcoin’s choppy or sideways price action on the 5-minute timeframe. It identifies short-term tops and bottoms using a confluence of volatility bands, momentum indicators, and price structure, optimized for high-probability scalping and intraday reversals.
Core Logic:
Volatility Filter: Uses an EMA with ATR bands to define overextended price zones.
Momentum Divergence: Confirms reversals using RSI and MACD histogram shifts.
Price Action Filter: Requires candle confirmation in the direction of the trade.
Locked Signal Logic: Prevents repaints and disappearing trades by confirming signals only once per bar.
Trade Parameters:
Short Entry: Above upper band + overbought RSI + weakening MACD + bearish candle
Long Entry: Below lower band + oversold RSI + strengthening MACD + bullish candle
Take Profit: ±0.75%
Stop Loss: ±0.4%
This setup is tuned for traders using tight risk control and leverage, where execution precision and minimal drawdown tolerance are critical.
Savitzky Flow Bands [ChartPrime]An advanced trend-following tool that applies the Savitzky-Golay smoothing algorithm to price and dynamically adapts trend bands to visualize directional bias and trend strength.
savitzky_golay_filter_w_15_vectors(source) =>
float sum = 0.0
float polynomial = 0.0
float coefficients = array.new(16)
// Predefined 15 coefficients
for i = -4 to 4
coefficients.set(i + 4, i) // from -4 to 5
if i == 4
for j = 5 to -4
for g = 8 to 15
coefficients.set(g, j) // from 5 to -4
// Calculate normalization factor as the sum of absolute values of coefficients
float norm_factor = coefficients.sum()
// Loop through coefficients and calculate the weighted sum
for i = 0 to coefficients.size()-1
sum := sum + coefficients.get(i) * source
// Calculate the smoothed value
for i = 1 to length-1
polynomial := math.sum(sum / norm_factor, i) / i
polynomial
⯁ KEY FEATURES & HOW TO USE
Savitzky-Golay Filtered Line (Basis):
Smooths out price noise using the Savitzky-Golay method, offering a more refined trend path than traditional moving averages. This centerline acts as the trend anchor and visually changes color depending on its slope to reflect the active trend direction.
Dynamic Trend Bands (Upper/Lower):
Constructed from the filtered line with a dynamic offset based on recent price volatility (ATR). These bands shift based on price pressure and are locked once price closes beyond them.
Helpful for identifying breakout moments or exhaustion areas where reversals are likely.
Trend Direction Detection:
A directional signal is confirmed when price breaks and closes above the upper band (uptrend) or below the lower band (downtrend).
Provides a clear and systematic way to identify when a trend begins.
Trend Duration Counter (Visual Decay Line):
A fading overlay line shows how long a trend has been active since the last reversal. The longer the trend persists, the more transparent this extension becomes.
This visual fading effect helps traders anticipate potential trend exhaustion and prepare for reversals or take-profit zones.
Reversal Signals (Diamond Markers):
Diamond shapes are plotted at each market shift, allowing users to visually pinpoint when the trend has flipped.
These markers act as decision zones for entry, exit, or stop-loss adjustments based on directional flow changes.
Color-Based Bar and Candle Painting:
Candles are painted green in uptrends and orange in downtrends, providing an intuitive glance at trend state without needing to interpret numbers.
Helps users stay aligned with the trend visually and avoid counter-trend entries.
⯁ CONCLUSION
The Savitzky Flow Bands indicator offers a modernized, visually rich way to track trend shifts using a scientific smoothing method. With dynamic trend envelopes, color-coded cues, and visual markers, it equips traders with a structured framework to follow the market's flow and make data-driven decisions. Ideal for swing traders, momentum strategists, or any trader looking to trade in sync with the prevailing trend.
123 Reversal Trading StrategyThe 123 Reversal Trading Strategy is a technical analysis approach that seeks to identify potential reversal points in the market by analyzing price patterns. This Pine Script™ code implements a version of this strategy, and here’s a detailed description:
Strategy Overview
Objective: The strategy aims to identify bullish reversal patterns using the 123 pattern and manage trades with a specified holding period and a 20-day moving average as an additional exit condition.
Key Components:
Holding Period: The number of days to hold a trade is adjustable, with the default set to 7 days.
Moving Average: A 200-day simple moving average (SMA) is used to determine an exitcondition based on the price crossing this average.
Pattern Recognition:
Condition 1: The low of the current day must be lower than the low of the previous day.
Condition 2: The low of the previous day must be lower than the low from three days ago.
Condition 3: The low two days ago must be lower than the low from four days ago.
Condition 4: The high two days ago must be lower than the high three days ago.
Entry Condition: All four conditions must be met for a buy signal.
Exit Condition: The position is closed either after the specified holding period or when the price reaches or exceeds the 200-day moving average.
Relevant Literature
Graham, B., & Dodd, D. L. (1934). Security Analysis. This classic work introduces fundamental analysis and technical analysis principles which are foundational to understanding patterns like the 123 reversal.
Murphy, J. J. (1999). Technical Analysis of the Financial Markets. Murphy provides an extensive overview of technical indicators and chart patterns, including reversal patterns similar to the 123 pattern.
Elder, A. (1993). Trading for a Living. Elder discusses various trading strategies and technical analysis techniques that complement the understanding of reversal patterns and their application in trading.
Risks and Considerations
Pattern Reliability: The 123 reversal pattern, like many technical patterns, is not foolproof. It can generate false signals, especially in volatile or trending markets. This may lead to losses if the pattern does not play out as expected.
Market Conditions: The strategy may perform differently under various market conditions. In strongly trending markets, reversal patterns might not be as reliable.
Lagging Indicators: The use of the 200-day moving average as an exit condition can be considered a lagging indicator. This means it reacts to price movements with a delay, which might result in late exits and missed profit opportunities.
Holding Period: The fixed holding period of 7 days may not be optimal for all market conditions or stocks. It is essential to adjust the holding period based on market dynamics and individual stock behavior.
Overfitting: The parameters used (like the number of days and moving average length) are set based on historical data. Overfitting can occur if these parameters are tailored too specifically to past data, leading to reduced performance in future scenarios.
Conclusion
The 123 Reversal Trading Strategy is designed to identify potential market reversals using specific conditions related to price lows and highs. While it offers a structured approach to trading, it is essential to be aware of its limitations and potential risks. As with any trading strategy, it should be tested thoroughly in various market conditions and adjusted according to the individual trading style and risk tolerance.
ICT KillZones + Pivot Points [TradingFinder] Support/Resistance 🟣 Introduction
Pivot Points are critical levels on a price chart where trading activity is notably high. These points are derived from the prior day's price data and serve as key reference markers for traders' decision-making processes.
Types of Pivot Points :
Floor
Woodie
Camarilla
Fibonacci
🔵 Floor Pivot Points
Widely utilized in technical analysis, floor pivot points are essential in identifying support and resistance levels. The central pivot point (PP) acts as the primary level, suggesting the trend's likely direction.
The additional resistance levels (R1, R2, R3) and support levels (S1, S2, S3) offer further insight into potential trend reversals or continuations.
🔵 Camarilla Pivot Points
Featuring eight distinct levels, Camarilla pivot points closely correspond with support and resistance, making them highly effective for setting stop-loss orders and profit targets.
🔵 Woodie Pivot Points
Similar to floor pivot points, Woodie pivot points differ by placing greater emphasis on the closing price, often resulting in different pivot levels compared to the floor method.
🔵 Fibonacci Pivot Points
Fibonacci pivot points combine the standard floor pivot points with Fibonacci retracement levels applied to the previous trading period's range. Common retracement levels used are 38.2%, 61.8%, and 100%.
🟣 Sessions
Financial markets are divided into specific time segments, known as sessions, each with unique characteristics and activity levels. These sessions are active at different times throughout the day.
The primary sessions in financial markets include :
Asian Session
European Session
New York Session
The timing of these major sessions in UTC is as follows :
Asian Session: 23:00 to 06:00
European Session: 07:00 to 14:25
New York Session: 14:30 to 22:55
🟣 Kill Zones
Kill zones are periods within a session marked by heightened trading activity. During these times, trading volume surges and price movements become more pronounced.
The timing of the major kill zones in UTC is :
Asian Kill Zone: 23:00 to 03:55
European Kill Zone: 07:00 to 09:55
New York Kill Zone: 14:30 to 16:55
Combining kill zones and pivot points in financial market analysis provides several advantages :
Enhanced Market Sentiment Analysis : Aligns key price levels with high-activity periods for a clearer market sentiment.
Improved Timing for Trade Entries and Exits : Helps better time trades based on when price movements are most likely.
Higher Probability of Successful Trades : Increases the accuracy of predicting market movements and placing profitable trades.
Strategic Stop-Loss and Profit Target Placement : Allows for precise risk management by strategically setting stop-loss and profit targets.
Versatility Across Different Time Frames : Effective in both short and long time frames, suitable for various trading strategies.
Enhanced Trend Identification and Confirmation : Confirms trends using both pivot levels and high-activity periods, ensuring stronger trend validation.
In essence, this integrated approach enhances decision-making, optimizes trading performance, and improves risk management.
🟣 How to Use
🔵 Two Approaches to Trading Pivot Points
There are two main strategies for trading pivot points: utilizing "pivot point breakouts" and "price reversals."
🔵 Pivot Point Breakout
When the price breaks through pivot lines, it signals a shift in market sentiment to the trader. In the case of an upward breakout, where the price crosses these pivot lines, a trader might enter a long position, placing their stop-loss just below the pivot point (P).
Conversely, if the price breaks downward, a short position can be initiated below the pivot point. When using the pivot point breakout strategy, the first and second support levels can serve as profit targets in an upward trend. In a downward trend, these roles are filled by the first and second resistance levels.
🔵 Price Reversal
An alternative method involves waiting for the price to reverse at the support and resistance levels. To implement this strategy, traders should take positions opposite to the prevailing trend as the price rebounds from the pivot point.
While this tool is commonly used in higher time frames, it tends to produce better results in shorter time frames, such as 1-hour, 30-minute, and 15-minute intervals.
Three Strategies for Trading the Kill Zone
There are three principal strategies for trading within the kill zone :
Kill Zone Hunt
Breakout and Pullback to Kill Zone
Trading in the Trend of the Kill Zone
🔵 Kill Zone Hunt
This strategy involves waiting until the kill zone concludes and its high and low lines are established. If the price reaches one of these lines within the same session and is strongly rejected, a trade can be executed.
🔵 Breakout and Pullback to Kill Zone
In this approach, once the kill zone ends and its high and low lines stabilize, a trade can be made if the price breaks one of these lines decisively within the same session and then pulls back to that level.
🔵 Trading in the Trend of the Kill Zone
Kill zones are characterized by high trading volumes and strong trends. Therefore, trades can be placed in the direction of the prevailing trend. For instance, if an upward trend dominates this area, a buy trade can be entered when the price reaches a demand order block.
MA Sabres [LuxAlgo]The "MA Sabres" indicator highlights potential trend reversals based on a moving average direction. Detected reversals are accompanied by an extrapolated "Sabre" looking shape that can be used as support/resistance and as a source of breakouts.
🔶 USAGE
If a selected moving average (MA) continues in the same direction for a certain time, a change in that direction could signify a potential reversal.
In this publication, when a trend change occurs, a sabre-shaped figure is drawn which can be used as support/resistance:
A sabre can be indicative of a direction, however, it can also act as a stop-loss when the price should go in the opposite direction:
Or show potential areas of interest:
🔶 DETAILS
This publication will look for a change in direction after the MA went in the same direction during x consecutive bars (settings: " Reversal after x bars in the same direction ").
Then a circle-shaped drawing will be drawn 1 bar back, at the previous high/low, dependable of the previous direction.
From there originates a sabre-shaped figure where the tip lies as far as the user-set MA length.
The angle of the "sabre" relies on the ATR of the previous 14 bars.
Less volatility will create a flatter sabre while the opposite is true when there is more volatility in the previous 14 bars.
The sabre is created by the latest feature, polylines , which enables us to connect several 'points', resulting in a polyline.new() object.
Do note that sabres are offset by one bar to the past to align their locations.
🔶 SETTINGS
MA Type: SMA, EMA, SMMA (RMA), HullMA, WMA, VWMA, DEMA, TEMA, NONE (off)
Length: this sets the length of MA, and the length of the sabre shape
Previous Trend Duration: After the MA direction is the same for x consecutive bars, the first time the direction changes, a sabre is drawn
Recursive Reversal Chart Patterns [Trendoscope]Caution: This algorithm is very heavy and bound to cause timeouts. If that happens, there are few settings you can change to reduce the load. (Will explain them in the description below)
🎲 Recursive Reversal Chart Patterns Indicator
Welcome to another exploration of Zigzag and Pattern ecosystem components. Previously we derived Pitchfork and Recursive Zigzag indicators. This indicator is designed to scan and highlight few popular "Reversal Chart Patterns". Similar to other indicators in the ecosystem, this too is built on recursive zigzags.
Double Taps
Triple Taps
Cup and Handles
Head and Shoulders
Indicator however names the patterns separately for bullish and bearish formations. So, the actual names you see on the screen are
Double Top
Double Bottom
Triple Top
Triple Bottom
Cup and Handle
Inverted Cup and Handle
Head and Shoulders
Inverse Head and Shoulders
Here is a snapshot on how each category of patterns look on the chart.
🎲 Architecture
Many of you may be cursing me for publishing too many libraries. But, these are all preparations for something big. Like other indicators in the Zigzag and Patterns Ecosystem, this too uses a bunch of libraries.
🎯Major direct dependencies
ZigzagTypes
ZigzagMethods
ReversalChartPatternLibrary
🎯Indirect dependencies
DrawingTypes
DrawingMethods
🎯Minor dependencies
Utils
TradeTracker
🎲 Indicator Settings
🎯Generic and Zigzag Settings.
Note: In case of timeout, please decrease the value of depth parameter
🎯Pattern Selection
Having all the patterns selected on chart may also cause timeouts and will make the chart look messy. It is better to limit one or two patterns on the chart to have clear picture.
🎯Scanner Settings
🎯Indicators.
These are options to use indicators as secondary confirmation to calculate divergence. If selected, the patterns are shown only if the divergence data is inline. Option also available to plugin external indicator. These calculations are not straightforward and not easy to measure by manual inspection. This feature at present is purely experimental.
Have a go and let me know how you feel :)
1-2-3 Pattern (Expo)█ Overview
The 1-2-3 pattern is the most basic and important formation in the market. Almost every great market move has started with this formation. That is why you must use this pattern to detect the next big trend. In fact, every trader has used the 1-2-3 formation to detect a trend change without realizing it.
Our 1-2-3 Pattern (Expo) indicator helps traders quickly identify the 1-2-3 Reversal Pattern automatically. By analyzing the price action data, the indicator shows the pattern in real-time. When the pattern is discovered, the 1-2-3 Pattern (Expo) Indicator notifies you via its built-in alert feature! Catching the upcoming big move can't be that much simpler.
█ How to use
The 1-2-3 pattern is used to spot trend reversals. The pattern indicates that a trend is coming to an end and a new one is forming.
-----------------
Disclaimer
The information contained in my Scripts/Indicators/Ideas/Algos/Systems does not constitute financial advice or a solicitation to buy or sell any securities of any type. I will not accept liability for any loss or damage, including without limitation any loss of profit, which may arise directly or indirectly from the use of or reliance on such information.
All investments involve risk, and the past performance of a security, industry, sector, market, financial product, trading strategy, backtest, or individual's trading does not guarantee future results or returns. Investors are fully responsible for any investment decisions they make. Such decisions should be based solely on an evaluation of their financial circumstances, investment objectives, risk tolerance, and liquidity needs.
My Scripts/Indicators/Ideas/Algos/Systems are only for educational purposes!
PivotThis library was designed to create three different datasets using Bill Williams fractals. The goal is to spot trends in reversal data and ultimately use these datasets to help predict future price reversals.
First, the pivot() function is used to initialize and populate three separate arrays (high pivot , low pivot , all pivots ). Since each high/low price depends on the bar_index, the bar_index, pivot direction(high/low), and high/low values are compressed into a string to maintain the data's integrity ("__"). Once each string array is populated and organized by bar_index, all three are returned inside a tuple. The return value must be deconstructed H,L,A =pivot() for each array's values to be accessed using getPivot() . This boilerplate allows for data to be accessed more efficiently in a recursive environment. getPivot() was designed to be used inside of a for or while block to populate matrices for further analyses. Again, getPivot() return values must be exposed through deconstruction. x,d,y =getPivot(). See code for more details.
pivot(int XLR) initializes and populates arrays
Parameters
XLR - number of bars to the left and right that must be lower for a high to be considered a pivotHigh, or vice versa. This number will drastically change the size and scope of the returned datasets. smaller values will produce much larger datasets, which might model short term price activity well. In contrast, larger values will produce smaller datasets which might model longer term price activity well.
Returns - tuple [string ]
getPivot(string arrayID, int index) accesses array data
Parameters
arrayID - the variable name for one of the three arrays returned by pivot().
index - the index of the provided array, with 0 being the most recent pivot point. can be set to " i " in a loop to access values recursively
Returns - tuple
Volume Records + AlertContents
Overall Introduction
Settings menu parameters
Usage
How to use alerts
Limits
Overall Introduction
This indicator is a "volume analysis" tool for confirming the direction and strength of price trend and spotting trend reversals. This tool consists of two parts:
1- The colored graph is a custom volume oscillator which shows the relative changes in volume.
The darkening of the color of the bars is a sign of increasing volume.
2- Triangular labels that show trading volume records over different time periods based on the absolute values of the volume.
By creating an alert, you can be notified of new trading volume records. These records are:
Highest / lowest volume in one year,
Highest / lowest volume in six month
Highest / lowest volume in three month
Highest / lowest volume in one month
Highest / lowest volume in one week
Settings menu parameters
{Short Length} =>
The fast volume MA of the Volume Oscillator.
{Long Length} =>
The slow volume MA of the Volume Oscillator.
{Visual Parameters} =>
Parameters to personalize the appearance of the indicator.
{Alert Conditions Part 01: Highest Records ⏰ } =>
Parameters to customize the alert.
{Alert Conditions Part 02: Lowest Records ⏰ } =>
Parameters to customize the alert.
Usage
This indicator is a "volume analysis" tool for confirming the direction and strength of price trend and spotting trend reversals.
What Is Volume Analysis?
Volume analysis involves examining relative or absolute changes in an asset's trading volume in order to make inferences about future price movements.
A significant price increase along with a significant volume increase, for example, could be a credible sign of a continued bullish trend or a bullish reversal.
The gradual darkening of the bars is a sign of the strength of the trend.
Volume can be an indicator of market strength, as rising markets on increasing volume are typically viewed as strong and healthy.
How to use alerts
Note that by creating an alert, an instance of the indicator, with all your settings, will be activated on the site's server and alerts will be triggered by it.
After that, changing the indicator settings on the chart will no longer affect the alert.
Open the settings window and select the alert conditions as you wish
Click the Create Alert button (or press the A key while holding down the ALT key)
In the Condition section, select the name of the indicator.
Make the rest of the settings as you wish.
Finally, click on the Create button.
It's finished. After a few moments, your alert will be added to the Alerts menu.
Limits
The labels are displayed after the bars close.
Labels are displayed for the last 10,000 bars.
[blackcat] L1 Composite RSI-DMI Reversal IndicatorLevel: 1
Background
The Relative Strength Index (RSI) developed by J. Welles Wilder is a pulse oscillator that measures the speed and change of price movements. The RSI hovers between zero and 100. Traditionally, the RSI is considered overbought when it is above 70 and oversold when below 30. Signals can be generated by looking for divergences and error fluctuations. RSI can also be used to identify the general trend.
The Directional Movement Index (DMI) is an indicator developed by J. Welles Wilder in 1978 that indicates the direction in which the price of an asset is moving. The indicator compares previous highs and lows and draws two lines: a positive directional movement line (+ DI) and a negative directional movement line (-DI). An optional third line called Directional Movement (DX) shows the difference between the lines. When + DI is above -DI there is more upward pressure than downward pressure in price. When -DI is above + DI, the price continues to fall. This indicator can help traders estimate the direction of the trend. Crossovers between the lines are also sometimes used as trading signals to buy or sell.
Function
L1 Composite RSI-DMI Reversal Indicator combines J. Welles Wilder's RSI and DMI indicators together to identify trend reversals.
Key Signal
swinglow --> swing signal
trend --> trend signal to identify top reversal
Pros and Cons
Pros:
1. it exhibit leading character
2. it can disclose top and bottom reversals
Cons:
1. noise exists
2. depends on market and trading pairs
Remarks
Composite J. Welles Wilder indicator
Readme
In real life, I am a prolific inventor. I have successfully applied for more than 60 international and regional patents in the past 12 years. But in the past two years or so, I have tried to transfer my creativity to the development of trading strategies. Tradingview is the ideal platform for me. I am selecting and contributing some of the hundreds of scripts to publish in Tradingview community. Welcome everyone to interact with me to discuss these interesting pine scripts.
The scripts posted are categorized into 5 levels according to my efforts or manhours put into these works.
Level 1 : interesting script snippets or distinctive improvement from classic indicators or strategy. Level 1 scripts can usually appear in more complex indicators as a function module or element.
Level 2 : composite indicator/strategy. By selecting or combining several independent or dependent functions or sub indicators in proper way, the composite script exhibits a resonance phenomenon which can filter out noise or fake trading signal to enhance trading confidence level.
Level 3 : comprehensive indicator/strategy. They are simple trading systems based on my strategies. They are commonly containing several or all of entry signal, close signal, stop loss, take profit, re-entry, risk management, and position sizing techniques. Even some interesting fundamental and mass psychological aspects are incorporated.
Level 4 : script snippets or functions that do not disclose source code. Interesting element that can reveal market laws and work as raw material for indicators and strategies. If you find Level 1~2 scripts are helpful, Level 4 is a private version that took me far more efforts to develop.
Level 5 : indicator/strategy that do not disclose source code. private version of Level 3 script with my accumulated script processing skills or a large number of custom functions. I had a private function library built in past two years. Level 5 scripts use many of them to achieve private trading strategy.
Supertrend Screener LABELThis screens for Supertrend reversal's in 10 different securities. The main logic for the screener is taken from "Simple Custom Screener in Pinescript" by QuantNomad with his permission. If the label color is not visible due to the text in it being white colored, then choose a different color from settings. Also added a simple supertrend to it.
Terminology explanation:
Confirmed Reversal: Supertrend reversal that happened in the last bar and cannot be repainted.
Potential Reversal: Supertrend reversal that might happen in the current bar but can also not happen depending upon the timeframe closing price.
Uptrend/Downtrend : Shows all the tickers that are either currently in uptrend or downtrend.
Vortex Trend TrackerThough it may sound complex, the Vortex Indicator is essentially an uptrend line and a downtrend line. The vortex indicator can be used for a variety of purposes, including tracking the strength of trends, identifying/anticipating reversals, and generating entry/exit signals. It’s calculation is shown in the open-source code below.
To reduce the number of whipsaws produced by the indicator, we used an Exponential Moving Average of vmPlus and vmNegative values with a default length of 10. Decreasing this length will result in a more responsive vortex at the cost of more whipsaws and false signals.
The chart shows the absolute value of the difference between the uptrend and downtrend line displayed as the main histogram.
If the uptrend line is greater than the downtrend (thus indicating positive movement), then the histogram bars will be either light green or dark green. If the uptrend line has just now crossed the downtrend line, then the bar will be dark green. Bars will also be dark green when the uptrend line is greater than the downtrend line and the uptrend line is increasing. This means the trend is increasing in strength still. If the uptrend line is greater than the downtrend line, but is decreasing, then the bars will be light green. This means that the upwards trend is losing strength.
If the downtrend line is greater than the uptrend line, then there is a negative trend occurring and the bars will be either red or light red. If the downtrend line has just crossed over the uptrend line or is increasing in value, then the bar will be red. If the downtrend line is greater than the uptrend line, but is decreasing in value, then the bars will be light red (meaning the downtrend is weakening).
One way to trade using this vortex is to enter a long position when the bar color changes from red to light red. This would mean that the downtrend is decreasing in strength and an upwards reversal is likely to occur soon. Then, traders can exit their long position when the bars change from dark green to light green. When that color change occurs it means that the uptrend is running out of steam and price is unlikely to continue its upwards climb.
Traders can also choose to have the uptrend and downtrend lines plotted as well in the input menu. This may make it easier to visualize the Vortex and its usefulness in identifying reversals.
Mass IndexThis indicator was originally developed by Donald Dorsey (Stocks & Commodities, V.10:6 (June, 1992): "The Mass Index").
Specially for @AlexMayorov :
If indicator reaches 27 and then falls to below 26.5 then it could be a signal of potential trend reversal.
E9 Shark-32 PatternUnderstanding the Shark-32 Pattern and its Trading Applications
The Shark-32 Pattern is a bearish technical trading formation used to predict market reversals or trend continuations. It highlights a downward move followed by a corrective rally, signaling a potential resumption of the downtrend. Here’s a breakdown of how it works:
What is the Shark-32 Pattern?
The Shark-32 pattern is a five-wave structure typically observed in bearish markets:
Wave 0 to X: A significant price decline starts the pattern.
Wave X to A: A correction pushes the price slightly upward.
Wave A to B: The price drops again but doesn’t reach the initial low.
Wave B to C: A final sharp decline concludes the pattern.
Once Wave C is formed, it suggests that the market will continue to move downward, presenting a potential selling or shorting opportunity.
Using the Pattern in Trading
This pattern is valuable for traders seeking high-probability bearish setups. The goal is to capitalize on the continuation of a downtrend following the corrective rally (X to A). Identifying the Shark-32 pattern helps anticipate the next wave of selling pressure.
Trading Setup
Identify a Shark-32 pattern.
If the price closes above the pattern's high, buy at the open the next day.
If the price closes below the pattern's low, short at the open the next day.
Sell/cover when the price moves 7% in the direction of the breakout.
Close the trade for a loss if the price moves 7% in the opposite direction.
For example, in a bull market after an upward breakout from a Shark-32, the net gain was $69.55. The method won 56% of the time with 5,218 winning trades and an average gain of $714.07. Conversely, 44% of trades were losers, with an average loss of $747.33. The average holding period was 26 calendar days.
The gains and losses were closely aligned with the 7% threshold set for this test.
Key Target Levels
To enhance the strategy, use dotted projection lines as target levels:
Upper Target: Drawn above the high of the corrective rally (Wave A). If the price breaks above this line, it may signal further upward movement, indicating a potentially weaker downtrend.
Lower Target: Positioned below the low of Wave C, providing a target for bearish trades.
These lines help determine future price targets and assist in setting take-profit or stop-loss levels.
Trading the Breakout
Look for breakouts once the Shark-32 pattern is identified:
Upward Breakout: If the price closes above the green line (high from two bars ago), it indicates a potential reversal to the upside.
Downward Breakout: If the price breaks below the red line (low from two bars ago), it confirms the bearish continuation.
Breakouts allow traders to adjust their positions based on market shifts.
Trading Tips
Continuation: The Shark-32 pattern acts as a continuation 60% of the time, confirming the ongoing trend.
Breakout Confirmation: Wait for the price to close above or below the pattern’s key levels before entering a trade.
Trade with the Trend: Since the Shark-32 is a continuation pattern, expect the breakout to align with the inbound price trend.
Symmetry: Patterns with symmetry often perform better. For more insights, refer to detailed trading literature.
Half-Staff: The Shark-32 can form midway in a trend, similar to flags and pennants.
Shark-32: Trading Performance
Based on an analysis of 23,369 trades, the following performance metrics were observed:
Bull Market with Upward Breakout: The average net profit was $69.55. This method won 56% of the time, with winning trades averaging $714.07. Losing trades, which constituted 44% of the total, had an average loss of $747.33. The average holding period was 26 calendar days.
Bull Market with Downward Breakout: The average net loss was $(76.36). This method won 43% of the time, with winning trades averaging $753.56. Losing trades, which constituted 57% of the total, had an average loss of $706.32. The average holding period was 23 calendar days.
Bear Market with Upward Breakout: The average net loss was $(89.13). This method won 46% of the time, with winning trades averaging $710.77. Losing trades, which constituted 54% of the total, had an average loss of $756.97. The average holding period was 16 calendar days.
Bear Market with Downward Breakout: The average net profit was $65.17. This method won 52% of the time, with winning trades averaging $781.62. Losing trades, which constituted 48% of the total, had an average loss of $722.41. The average holding period was 13 calendar days.
Connors VIX Reversal III invented by Dave LandryThis strategy is based on trading signals derived from the behavior of the Volatility Index (VIX) relative to its 10-day moving average. The rules are split into buying and selling conditions:
Buy Conditions:
The VIX low must be above its 10-day moving average.
The VIX must close at least 10% above its 10-day moving average.
If both conditions are met, a buy signal is generated at the market's close.
Sell Conditions:
The VIX high must be below its 10-day moving average.
The VIX must close at least 10% below its 10-day moving average.
If both conditions are met, a sell signal is generated at the market's close.
Exit Conditions:
For long positions, the strategy exits when the VIX trades intraday below its previous day’s 10-day moving average.
For short positions, the strategy exits when the VIX trades intraday above its previous day’s 10-day moving average.
This strategy is primarily a mean-reversion strategy, where the market is expected to revert to a more normal state after the VIX exhibits extreme behavior (i.e., large deviations from its moving average).
About Dave Landry
Dave Landry is a well-known figure in the world of trading, particularly in technical analysis. He is an author, trader, and educator, best known for his work on swing trading strategies. Landry focuses on trend-following and momentum-based techniques, teaching traders how to capitalize on shorter-term price swings in the market. He has written books like "Dave Landry on Swing Trading" and "The Layman's Guide to Trading Stocks," which emphasize practical, actionable trading strategies.
About Connors Research
Connors Research is a financial research firm known for its quantitative research in financial markets. Founded by Larry Connors, the firm specializes in developing high-probability trading systems based on historical market behavior. Connors’ work is widely respected for its data-driven approach, including systems like the RSI(2) strategy, which focuses on short-term mean reversion. The firm also provides trading education and tools for institutional and retail traders alike, emphasizing strategies that can be backtested and quantified.
Risks of the Strategy
While this strategy may appear to offer promising opportunities to exploit extreme VIX movements, it carries several risks:
Market Volatility: The VIX itself is a measure of market volatility, meaning the strategy can be exposed to sudden and unpredictable market swings. This can result in whipsaws, where positions are opened and closed in rapid succession due to sharp reversals in the VIX.
Overfitting: Strategies based on specific conditions like the VIX closing 10% above or below its moving average can be subject to overfitting, meaning they work well in historical tests but may underperform in live markets. This is a common issue in quantitative trading systems that are not adaptable to changing market conditions .
Mean-Reversion Assumption: The core assumption behind this strategy is that markets will revert to their mean after extreme movements. However, during periods of sustained trends (e.g., market crashes or rallies), this assumption may break down, leading to prolonged drawdowns.
Liquidity and Slippage: Depending on the asset being traded (e.g., S&P 500 futures, ETFs), liquidity issues or slippage could occur when executing trades at market close, particularly in volatile conditions. This could increase costs or worsen trade execution.
Scientific Explanation of the Strategy
The VIX is often referred to as the "fear gauge" because it measures the market's expectations of volatility based on options prices. Research has shown that the VIX tends to spike during periods of market stress and revert to lower levels when conditions stabilize . Mean reversion strategies like this one assume that extreme VIX levels are unsustainable in the long run, which aligns with findings from academic literature on volatility and market behavior.
Studies have found that the VIX is inversely correlated with stock market returns, meaning that higher VIX levels often correspond to lower stock prices and vice versa . By using the VIX’s relationship with its 10-day moving average, this strategy aims to capture reversals in market sentiment. The 10% threshold is designed to identify moments when the VIX is significantly deviating from its norm, signaling a potential reversal.
However, academic research also highlights the limitations of relying on the VIX alone for trading signals. The VIX does not predict market direction, only volatility, meaning that it cannot indicate the magnitude of price movements . Furthermore, extreme VIX levels can persist longer than expected, particularly during financial crises.
In conclusion, while the strategy is grounded in well-established financial principles (e.g., mean reversion and the relationship between volatility and market performance), it carries inherent risks and should be used with caution. Backtesting and careful risk management are essential before applying this strategy in live markets.
MACD with 1D Stochastic Confirmation Reversal StrategyOverview
The MACD with 1D Stochastic Confirmation Reversal Strategy utilizes MACD indicator in conjunction with 1 day timeframe Stochastic indicators to obtain the high probability short-term trend reversal signals. The main idea is to wait until MACD line crosses up it’s signal line, at the same time Stochastic indicator on 1D time frame shall show the uptrend (will be discussed in methodology) and not to be in the oversold territory. Strategy works on time frames from 30 min to 4 hours and opens only long trades.
Unique Features
Dynamic stop-loss system: Instead of fixed stop-loss level strategy utilizes average true range (ATR) multiplied by user given number subtracted from the position entry price as a dynamic stop loss level.
Configurable Trading Periods: Users can tailor the strategy to specific market windows, adapting to different market conditions.
Higher time frame confirmation: Strategy utilizes 1D Stochastic to establish the major trend and confirm the local reversals with the higher probability.
Trailing take profit level: After reaching the trailing profit activation level scrip activate the trailing of long trade using EMA. More information in methodology.
Methodology
The strategy opens long trade when the following price met the conditions:
MACD line of MACD indicator shall cross over the signal line of MACD indicator.
1D time frame Stochastic’s K line shall be above the D line.
1D time frame Stochastic’s K line value shall be below 80 (not overbought)
When long trade is executed, strategy set the stop-loss level at the price ATR multiplied by user-given value below the entry price. This level is recalculated on every next candle close, adjusting to the current market volatility.
At the same time strategy set up the trailing stop validation level. When the price crosses the level equals entry price plus ATR multiplied by user-given value script starts to trail the price with EMA. If price closes below EMA long trade is closed. When the trailing starts, script prints the label “Trailing Activated”.
Strategy settings
In the inputs window user can setup the following strategy settings:
ATR Stop Loss (by default = 3.25, value multiplied by ATR to be subtracted from position entry price to setup stop loss)
ATR Trailing Profit Activation Level (by default = 4.25, value multiplied by ATR to be added to position entry price to setup trailing profit activation level)
Trailing EMA Length (by default = 20, period for EMA, when price reached trailing profit activation level EMA will stop out of position if price closes below it)
User can choose the optimal parameters during backtesting on certain price chart, in our example we use default settings.
Justification of Methodology
This strategy leverages 2 time frames analysis to have the high probability reversal setups on lower time frame in the direction of the 1D time frame trend. That’s why it’s recommended to use this strategy on 30 min – 4 hours time frames.
To have an approximation of 1D time frame trend strategy utilizes classical Stochastic indicator. The Stochastic Indicator is a momentum oscillator that compares a security's closing price to its price range over a specific period. It's used to identify overbought and oversold conditions. The indicator ranges from 0 to 100, with readings above 80 indicating overbought conditions and readings below 20 indicating oversold conditions.
It consists of two lines:
%K: The main line, calculated using the formula (CurrentClose−LowestLow)/(HighestHigh−LowestLow)×100 . Highest and lowest price taken for 14 periods.
%D: A smoothed moving average of %K, often used as a signal line.
Strategy logic assumes that on 1D time frame it’s uptrend in %K line is above the %D line. Moreover, we can consider long trade only in %K line is below 80. It means that in overbought state the long trade will not be opened due to higher probability of pullback or even major trend reversal. If these conditions are met we are going to our working (lower) time frame.
On the chosen time frame, we remind you that for correct work of this strategy you shall use 30min – 4h time frames, MACD line shall cross over it’s signal line. The MACD (Moving Average Convergence Divergence) is a popular momentum and trend-following indicator used in technical analysis. It helps traders identify changes in the strength, direction, momentum, and duration of a trend in a stock's price.
The MACD consists of three components:
MACD Line: This is the difference between a short-term Exponential Moving Average (EMA) and a long-term EMA, typically calculated as: MACD Line=12-period EMA−26-period
Signal Line: This is a 9-period EMA of the MACD Line, which helps to identify buy or sell signals. When the MACD Line crosses above the Signal Line, it can be a bullish signal (suggesting a buy); when it crosses below, it can be a bearish signal (suggesting a sell).
Histogram: The histogram shows the difference between the MACD Line and the Signal Line, visually representing the momentum of the trend. Positive histogram values indicate increasing bullish momentum, while negative values indicate increasing bearish momentum.
In our script we are interested in only MACD and signal lines. When MACD line crosses signal line there is a high chance that short-term trend reversed to the upside. We use this strategy on 45 min time frame.
ATR is used to adjust the strategy risk management to the current market volatility. If volatility is low, we don’t need the large stop loss to understand the there is a high probability that we made a mistake opening the trade. User can setup the settings ATR Stop Loss and ATR Trailing Profit Activation Level to realize his own risk to reward preferences, but the unique feature of a strategy is that after reaching trailing profit activation level strategy is trying to follow the trend until it is likely to be finished instead of using fixed risk management settings. It allows sometimes to be involved in the large movements.
Backtest Results
Operating window: Date range of backtests is 2023.01.01 - 2024.08.01. It is chosen to let the strategy to close all opened positions.
Commission and Slippage: Includes a standard Binance commission of 0.1% and accounts for possible slippage over 5 ticks.
Initial capital: 10000 USDT
Percent of capital used in every trade: 30%
Maximum Single Position Loss: -4.79%
Maximum Single Profit: +20.14%
Net Profit: +2361.33 USDT (+44.72%)
Total Trades: 123 (44.72% win rate)
Profit Factor: 1.623
Maximum Accumulated Loss: 695.80 USDT (-5.48%)
Average Profit per Trade: 19.20 USDT (+0.59%)
Average Trade Duration: 30 hours
These results are obtained with realistic parameters representing trading conditions observed at major exchanges such as Binance and with realistic trading portfolio usage parameters.
How to Use
Add the script to favorites for easy access.
Apply to the desired timeframe between 30 min and 4 hours and chart (optimal performance observed on 45 min BTC/USDT).
Configure settings using the dropdown choice list in the built-in menu.
Set up alerts to automate strategy positions through web hook with the text: {{strategy.order.alert_message}}
Disclaimer:
Educational and informational tool reflecting Skyrex commitment to informed trading. Past performance does not guarantee future results. Test strategies in a simulated environment before live implementation
Fibonacci Timing Pattern IIThe Fibonacci Timing Pattern II is a price-based counter that seeks to determine medium-term reversals in price action. It is based on the following set of conditions:
* For a bullish Fibonacci timing signal II: The current close must be lower than the close prices from one and two periods ago. Simultaneously, the close price from two periods ago must be lower than the close price from three periods ago, and the close price from three periods ago must be lower than the close price from five periods ago. The Fibonacci sequence continues until the close price from thirty four periods ago which must be above the close price from fifty five periods ago.
* For a bearish Fibonacci timing signal II: The current close must be higher than the close prices from one and two periods ago. Simultaneously, the close price from two periods ago must be higher than the close price from three periods ago, and the close price from three periods ago must be higher than the close price from five periods ago. The Fibonacci sequence continues until the close price from thirty four periods ago which must be lower the close price from fifty five periods ago.
The signals of the pattern are ideally used in a sideways market or used in tandem with the trend (bullish signals are taken in a bullish market and bearish signals are taken in a bearish market).