MATHR3E FLOW█ OVERVIEW
MATHR3E Flow is a market timing tool which aims to anticipate trend reversals and highlight potential low risk entries.
█ CONCEPTS
Disclaimer:
MATHR3E Flow indicator is intended for advanced traders and may fit your profile, whether you are a day trader or a long-term investor.
It was originally developed by a renowned market analyst and documented in numerous books. Among them is the author Jason Perl.
It is recommended to have read the trading techniques mentioned in the books covering this indicator beforehand.
How to use:
Fibonacci Flow is a very complex tool, the purpose is not to detail it here but rather to introduce it briefly.
For a complete understanding, it is strongly recommended to read the books mentioned in the disclaimer section.
This indicator has two main components:
1 — The Prelude, which relies on momentum to define price ranges.
From a Price Reversal there must be nine consecutive closes;
each one less/greater than the corresponding close four bars earlier.
Preludes are numbered from 1 to 9. A complete Prelude occurs on bar 9.
It can be: Sharped / Flawed / Ignored / Extended
Cross over parameter can also evaluate the slowdown in a price trend's intensity and qualify the inception of Flow
2 — The Flow, which comes into play once the Prelude is complete.
They are trend based, and look for low-risk opportunities to fade established directional moves.
Flows are counts numbered from 1 to 13. There are 3 of them:
• SEQ: compares the current close with the low/high two bars earlier
• AGG: compares the current low/high with the low/high two bars earlier
• CMB: complex set of comparison with 2 available methods (not detailed here)
To handle the large amount of data to be displayed, they have been distributed over two indicators.
This indicator therefore works in pair with its companion: MATHR3E Flow Extension Dashboard.
The distribution of the display is as follows:
Current indicator:
• Flow points
• Markers for Flows cancelation (X)
• Exhaustions points for:
• SEQ: up to 13 (Identify trend fading)
• AGG: up to 13 (For higher trading frequency)
• CMB: up to 13 (Identify prospective turning points following an abrupt price movement)
Companion indicator:
• Prelude points
• Markers for Extension preludes (E)
• Prelude Risk lines
• Flow Risk lines
• Prelude Trend Support and resistance
• Dashboard for supervision of ongoing counts
█ FEATURES & BENEFITS
Fibonacci Sequence
The number 13 is part of the Fibonacci sequence which is nature’s numbering system.
Exhaustion points
Potential exhaustion points emerge whenever the individual flows reach Fibonacci number 13.
These points may help traders to identify low-risk buy or sell opportunities.
Risk Lines
Once the trader has selected an entry point, the displayed risk lines should encourage the trader to remain disciplined and apply proper money management.
Position sizing remains the responsibility of the trader.
Available risk lines:
• buy/sell Preludes
• buy/sell Flows
Nested Flows
The indicator can track up to three nested Flows.
Renewing
During the path to reach point number 13, it is very common to trigger other Prelude in the same direction as the previously initiated trend.
MATHR3E Flow will address these potential market renewal with multiples options:
• Prelude range qualifiers
• Renewal Multiplier
Alerts
Its Companion indicator also provides programmable alerts whose format can be adapted to be received on Discord servers
Configure your alerts and get notified on:
• Trend changes
• BUY or SELL P9
• BUY or SELL S13
• BUY or SELL A13
• BUY or SELL C13
Cari dalam skrip untuk "reversal"

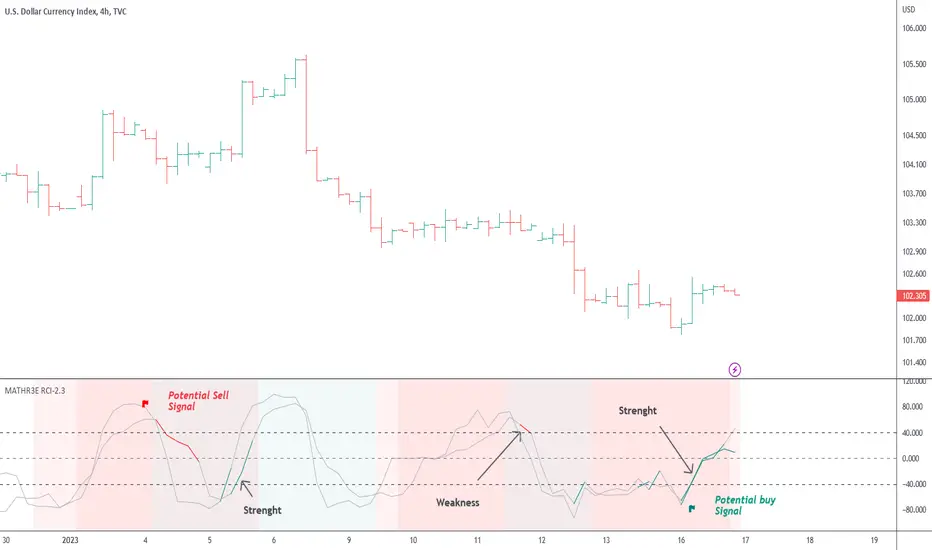
MATHR3E Range Conquest Index█ OVERVIEW
MATHR3E Range Conquest Index (RCI) is an arithmetic oscillator for trend analysis.
█ CONCEPTS
Disclaimer
MATHR3E RCI indicator is intended for advanced traders and may fit your profile, whether you are a day trader or a long-term investor.
It was originally developed by a renowned market analyst and documented in numerous books. Among them is the author Jason Perl.
It is recommended to have read the trading techniques mentioned in the books covering this indicator beforehand.
Introduction
MATHR3E RCI can serve several purposes:
• By helping to confirm price reversals.
• By giving low risk potential entry indication
• By outlining the emergence of a price trend
How to use
MATHR3E RCI is a dual oscillator.
Each oscillator compares the price evolution of a given day with that of two trading days earlier.
They differ in the amount of trading bars taken into account when calculating the RCI.
Oscillator values fluctuate between overbought and oversold levels
The time spent above or below these levels is compared to the Duration Analysis parameter (in bars).
When it is greater than this Duration, an excessive move is underway which usually require the oscillator to return to the neutral zone.
Strengths or weaknesses are then detected when the oscillator returns to its zone of excess by marking a mild reading, i.e. spending less time than the duration analysis parameter.
█ FEATURES & BENEFITS
Versatile
The indicator is designed to work with other indicators by the same author, including the identification of exhaustion points.
This indicator can be applied to any market or time frame.
Price Oscillator Qualifier
Identify low-risk buy or sell opportunities with
• Qualified upside breakouts
• Qualified downside breakouts
Fully Customizable
Multiples settings available to configure
• Oscillator Periods
• Duration Analysis
• Overbought and oversold reading
Alerts
Get notified on:
• Weakness signal
• Strength signal
• POQ signals
FieryTrading: Buy The Dip - Sell The RipDear Tradingview community,
Today I want to share a very powerful, yet easy to use indicator with you. The indicator will find local tops or bottoms and will help you determine when it's a good time to trade a potential reversal.
How does it work?
The indicator makes use of the RSI to detect extremities and waits until the RSI reverses. Furthermore, a long-term moving average is used to determine whether we're in bullish or bearish market conditions. In bullish conditions the indicator will only go long, in bearish conditions the indicator will only go short.
How do I use it?
Favorite the indicator and apply it to your chart! You can add an alert to the indicator to receive a message once it has detected a good point for a reversal trade.
The indicator can be used on all assets and on all timeframes. Personally, I've found the 1 - 4 hourly timeframes to yield the best results.
Good luck!

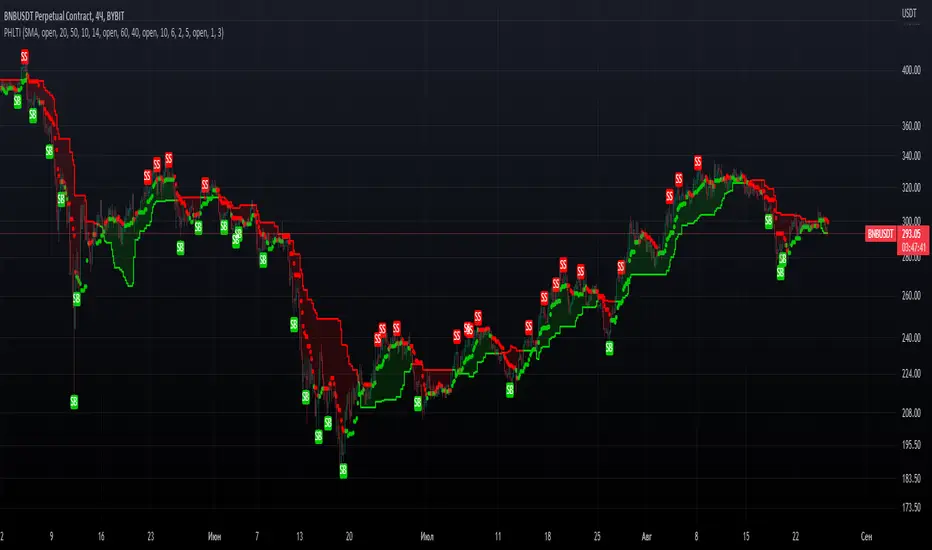
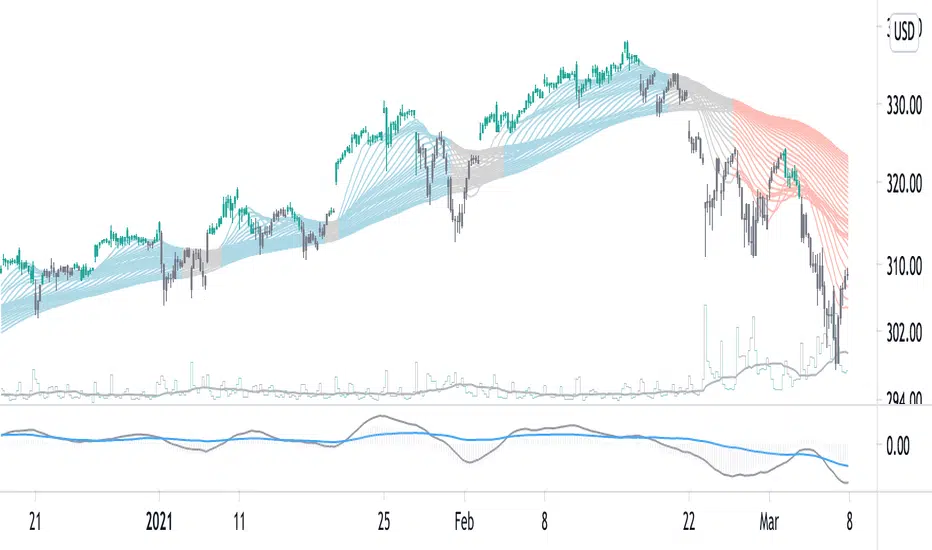
PrevHighLow Trend IndicatorPrevHighLow Trend Indicator which is calculated by using prev lowest and highest of p1 -period and p2 -period for two MAs.
First MA is made of prev highest of p1-period / prev lowest of p1-period.
Second MA is faster, made up of p2(<p1)- period(same formula).
Can be used in the next way: slower MA(straight line) shows main trend, faster shows temporary trend.
BUY, when first MA and second MA are green; Exit: second MA changes from green to red.
SELL, when first MA and second MA are red; Exit: second MA changes from red to green.
RSI Assistant basically filtres signals in the way, when signals from RSI and Faster MA are similar? it signals about it with labels: BUY for long, SELL for short. You can either enable or disable it. Also customizable so you can find your setup. RSI Assistant, depending on you customize it, can help you either follow trend or show reversals. Just find your own setup and watch things happen!
Feel free to leave valuable feedback and your setups which you consider to be good.
Hope you PHLTI usefull. Good luck!
50% Strat RetracementThe purpose of this script is to show/alert you when there is a 50% Strat Reversal. It works very well to find possible 3 candles.
The arrows, and line can be turned on and off.
You can change the 50% to say 45% so that you will be alerted before it actually hits the 50% retracement.
The script will only alert if the reversal is a 2up red candle, a 2up green candle which will hopefully turn into a 3 candle.

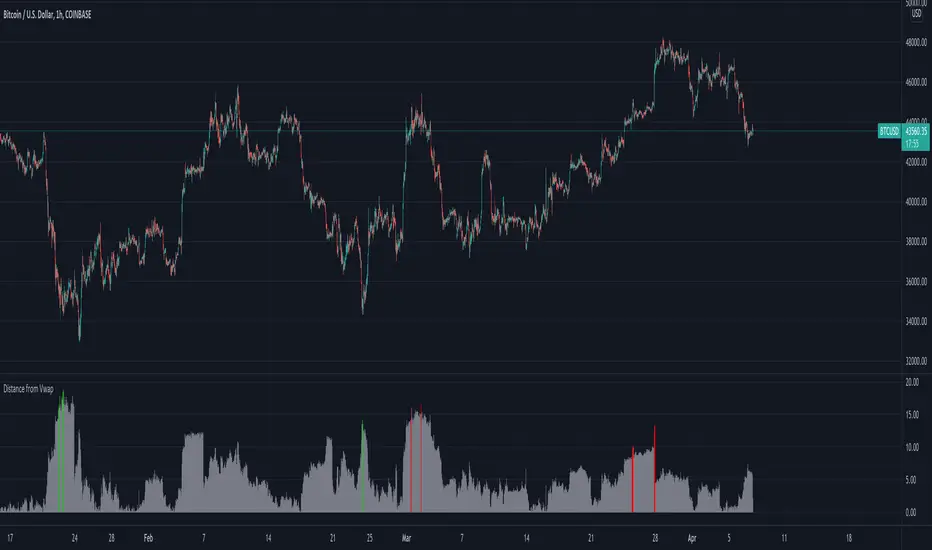
Distance from Vwap// How it Works \\
Measuring the distance of the close price from a higher timeframe VWAP - Volume Weighted Average Price
There is a threshold which is calculated by looking back at the previous x amount of bars and storing the highest/lowest values
If the distance from the vwap stretches above that threshold, the histogram will go green if price is above VWAP and red if its below the vwap
If the distance from the vwap reaches below the low threshold you will see the histogram flashes orange
// Settings \\
In the settings you have the ability to change what timeframe the indicator is calculated on, as well as this you can change the timeframe the VWAP is calculated on.
I always recommend using a higher timeframe vwap as they tend to me more respected
e.g on the hourly timeframe, I use the weekly VWAP, on 1 minute timeframe you may want to use 4 hour timeframe but obviously feel free to experiment
// Use Case \\
When histogram is flashing green, prices is pulling far away from the vwap, obviously you don't want to be buying a falling knife but if you have levels of confluence this can help spot reversals.
I personally wait until the first candle after its been green to get confirmation of the fall weakening. Vica versa for reds and shorts/sells.
When you see orange flashes, this shows that price has been consolidating and the price is very close to the higher time frame VWAP which could be considered a safe entry point as they tend to lead to a big move to follow
// Suggestions \\
Happy for anyone to make any suggestions on changes which could improve the script,
// Terms \\
Feel free to use the script, If you do use the script could you please just tag me as I am interested to see how people are using it. Good Luck!
RSI Effective Volume Reversal IndicatorAbout The Indicator
I want to start with a few short paragraphs of how this indicator came to be and why it's different than 80% of the indicators on this platform. If you are just interested in how the indicator works, you can skip the story, although I recommend at least skimming through it.
Originally, this indicator was developed to be part of a trend-trading strategy that analyzed the three main components - Price , Volume and Strength . It was broken down to 2 indicators - on-chart and off-chart, similarly to my first premium indicator "Trend Indicator for Directional Trading". Despite the similar concept, the current one is miles ahead in almost any regard.
As most of you know, strategies (especially the really good ones) are fairly more complex to use and navigate. You need to input the parameters for generating and tweaking the indicator, then you need to enter your risk management parameters like stop loss, position size, etc. and finally you need to set the exit criteria, like specified percent target, trial stop or an indicator condition. So, what was supposed to be a simple strategy that anyone can use and make money with, turned out to be a very complex one with over 20 parameters to tweak. I know from experience that when it comes to trading, less is more. This is especially true for the indicators.
As a result, I decided to split the project into two separate strategies - one for trend/directional trading and one for volume and strength (the one you are looking at right now). The problem was that as a standalone strategy it didn't perform all that well. And it shouldn't come as a surprise to anyone who has been trading long enough - divergences are one of the biggest tricksters there are - easy to identify only in hindsight. They are the new-trader's doom. I lost a decent amount of money chasing tops and bottoms through divergences and for that reason it's always been somewhat a goal of mine to create an indicator that can assist in this conquest (call it a personal vendetta). This indicator comes as close as I've ever been to this goal.
Right, but I just said a few lines above that this indicator doesn't work that well for divergences? That's true, but only if you completely automate it and let it buy every bullish and sell every bearish divergence. I have extensively tested it on the securities I actively trade (SPX500, Crude Oil, Gas, Gold, Copper) and with the right settings it does generate positive return (what strategy wouldn't with enough optimization, right?), but I would have made so much more money if I didn't fight the trend.
So, I decided to do something else - convert the strategy back to an indicator and use it for discretional trading in which it assists (not explicitly tell) me in making the decisions. And oh boy, did I hit the sweet spot there! It has been notoriously difficult for most scripts and indicators to identify proper support and resistance levels or at least not nearly as good as the human eye can do. This is especially the case with ascending and descending channels. Seeing how well it worked in helping me open longs and shorts at key levels, I decided to strip it from all unnecessary features and simplify the interface for easier navigation (about 300 lines of code less). This brings me to my next point.
How Does It Work?
The indicator relies on two main components in order to identify reversals - RSI module and Effective Volume module, hence the name RSI Effective Volume Reversal Indicator (not very creative, I know). You select which one you want to display via the dropdown menu. Now let me outline how each one works.
RSI module (top) - similarly to the traditional RSI, it is bound between 0 and 100. Oversold area is marked in green (15-25) and overbought area is marked in red (75-85). You can change those as you please, but I found those to be the perfect spots for identifying potential opportunities. This is where the similarities end. As you've noticed, it's not nearly as choppy as the traditional RSI, just the opposite - it's rather smooth, resembling Heikin-Ashi candles. Further, the way the candle is formed can indicate if we are approaching a top or bottom and if you should be looking for an opportunity to open a trade against the trend. Believe it or not, I've been developing and using this indicator for the past 6 months, so there's a lot to be said about the formation of those candles with clear examples, but I will leave those for the guide book that comes along with each purchase/subscription.
Effective Volume (bottom) - As I already have developed quite an extensive indicator that utilizes the effective volume profile, I just grabbed certain elements from it, simplified it and smoothed it via a new custom-made moving average along with some other minor updates. The results from RSI and Effective Volume may seem quite similar, but they actually reveal slightly different information and can be used to complement each other. In terms of coloring - green gradient above 50 and red gradient below 50.
What To Expect
It's important to understand that technical analysis does not predict prices. I am not claiming this indicator to be the crystal ball that will tell you when to long or short with max leverage. All I am saying is that it's a pretty good tool to help you time your trades, show real exhaustion of trends and reveal when a new direction is forming.
This indicator has been, and most likely will continue to be, work in progress. I've been experimenting with tons of features to make it better for the past 6 months and I finally believe it is stable and beneficial enough in order for you to use it. There's always something more that I would like to add and/or change, but I know that if I continue digging and improving, the indicator would have never seen the light of day. That's why I want to add the critical component to it - you. Through your feedback and recommendations, I believe we can make this indicator truly a masterpiece.
With that being said, I do have some future improvements planned, which I will be releasing on the go. Some are major, like updating it to v.5 and adding new features that are only available to the newest version of PineScript, while others are minor, such as color variations and more one-click customizations.
I hope I managed to portray an objective picture (with reasonable amount of words) of something that I've put a lot of work into, so that you can successfully use and make even more money on the markets. Once again, each purchase/subscription of this indicator comes with a guide in which I go into great detail explaining how to use the indicator, so rest assured that you will be able to take full advantage of it.

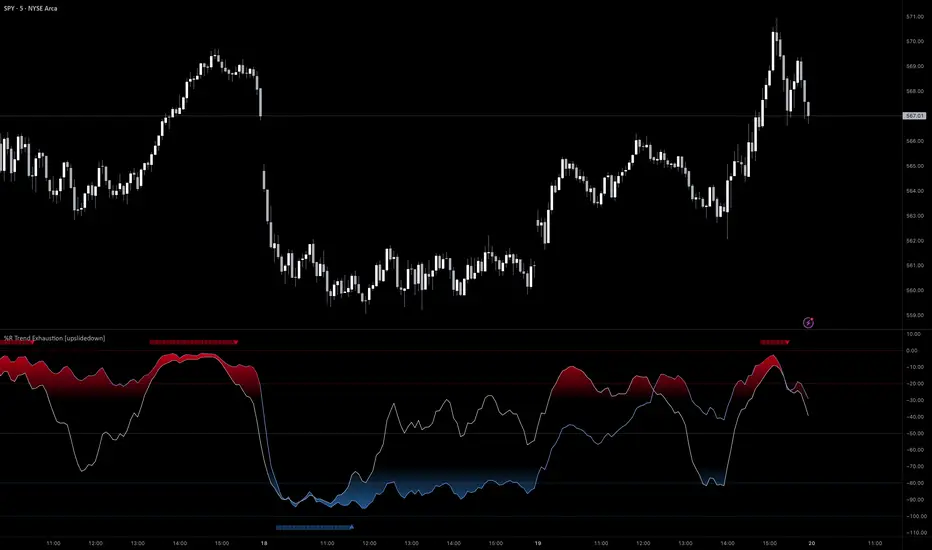
%R Trend Exhaustion [upslidedown]I love Williams %R! This indicator mixes two %R periods... a standard %R with a longer period %R. The longer period of 112 has interesting results for trend following strategies in the crypto market through backtesting.
Alone these are fairly ordinary but together they provide a very interesting trend exhaustion/reversal system while filtering out some noise. I have highlighted key areas of interest with filled boxes. An "area of interest" is when there is confluence between the short and long period %R values along with being overbought or oversold. Once there is a break in the overbought or oversold trend, an arrow will print.
This is one of my odder ideas that appears to have some merit and detects interesting tops or bottoms (or confirms a trend reversal) so I'm publicly publishing for the community to find. If you find this useful please reach out and let me know how you use it as it's fairly unique... and thus different than anything I've ever seen or used.
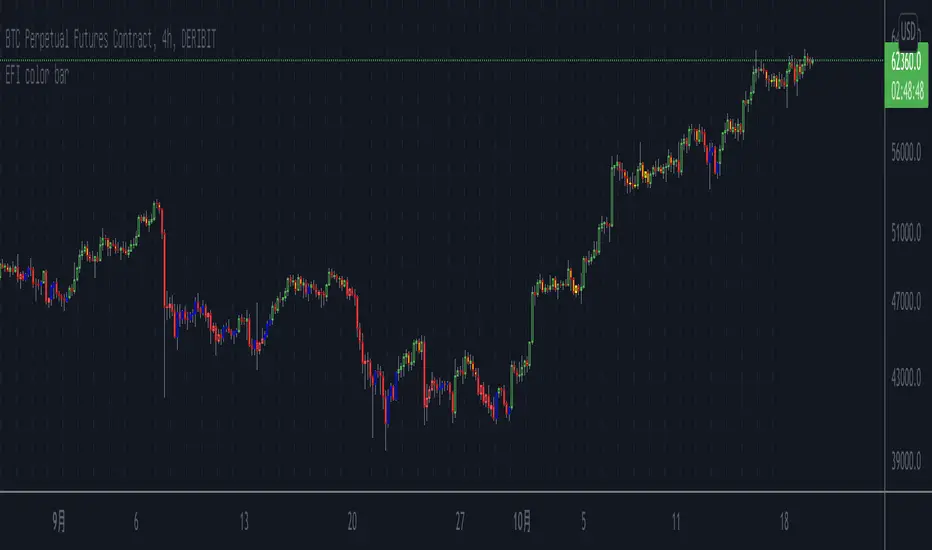
Elder's Force Index Color BarBased on the Elder's Force Index (EFI) , +/- of the EFI and its ema is used to describe the rise, fall or possible reversal of the market, and finally shown by bar color.
The green bar represents a strong bull and the red bar represents a strong bear;
The blue bar indicates that the downtrend is exhausted and may rise. Likewise the yellow bar.
Of course, it is difficult to buy the bottom and sell the top at any time. This indicator needs to be judged together with the pattern or other indicators that predict reversals in order to increase the win rate.
Happy Trading.
根据Elder's Force Index修改而成,取消了幅图指标,仅用bar color来表现上涨,下跌和转折。
绿色k线代表上涨动能充足,红色k线表示下跌动能充足;
蓝色k线表示下跌力竭,可能会上涨;
黄色k线表示上涨力竭,可能会下跌。
当然,任何时候抄底摸顶都是困难的,该指标需要和形态或者其他预测反转的指标一起判断才能增加成功率。
祝交易愉快。
緑は上昇トレンドで、赤は下落トレンドです;
青は下落が尽きて上昇する可能性があることを示すことで、黄色は上昇が終わり、下落の可能性があることを示しています。
成功率を高めるためには、パターンや反転を予測する他の指標と合わせて判断する必要があります。
Happy Trading。
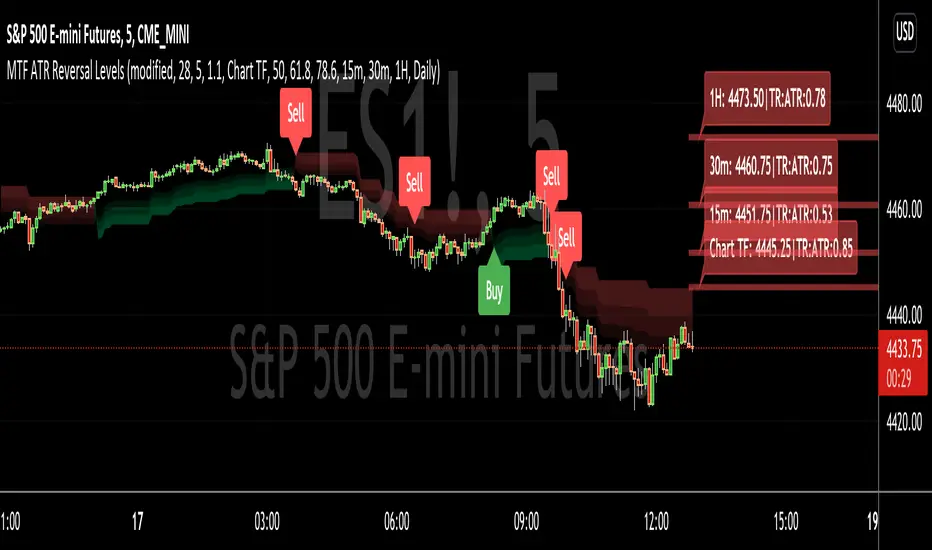
MTF ATR Reversal LevelsThis is a Multitple TimeFrame Swingarm system borrowing from the Blackflag FTS indicator.
This throws up 5 resolutions of ATR thresholds, only showing the current bar level using a horizontal line across the full chart. I don't like the historical information charted, just need to know the current level for my trading purposes.
It will also give Sell/Buy alerts when the closing price exceeds one of those thresholds... essentially confirmation of a trend reversal.
On the primary resolution (defaulted to the current timeframe of the chart) it can show the fibonacci reversal levels using the ATR levels for that time resolution. This is if for the current trend.
I find it useful, so I thought I would share. Like all indicators, it'll work as long as you stick with a system, and let it work. :)
Volume Pressure AnalysisVolume Pressure Analysis is a new concept I have been working on designed to show the effort required to move price. An ideal tool for confirming trends or locating reversals early. This indicator can highlight whale action and market manipulation. It calculates volume vs volatility and displays the results as a meter:
Above 0 shows how easy price action is traveling, the bigger these bars the less volume and effort is required to push price. These are indicated with a teal or red arrows and can confirm the beginning or continuation of a trend. This is the natural direction the chart wants to travel at that time.
Below 0 shows how hard price is to move. The bigger these bars the more volume and effort is required to push price. When whales and market makers push price against its will these bars will get bigger.
Yellow arrows signal pressure in that direction and excessive amounts of volume is required to move price. These signals can lead to reversal/ pivot points as price action struggles to continue its trend. These signals can be turned on in settings or use the overlay version of this script to display signals on chart. This is a very powerful tool when used with relative volume.

Center Of Gravity OscillatorThe COG Oscillator (center of gravity) is an indicator based on statistics and the Fibonacci golden ratio. It uses ALMA as a trigger and LSMA as "zero line". The trigger is set tight by default but can be tweaked by adjusting the window size and sigma in settings. This is a great indicator for setting up trades and spotting reversals. There are 2 main strategies that come with this indicator:
Strategy 1: Long positions are entered when current low point is higher than previous low. Short positions are entered as current high is lower than previous high. (Shown in image above)
Strategy 2 : If market is bullish long trades are entered as COG line crosses over red LSMA line. Traders have the option of scalping the first crossover or even scaling out of trade to close on second exit. This works the opposite for shorts when market is bearish.
Above shows different configurations of the indicator. Top shows length of 50, Middle has length of 21 and bottom is default 9.

Volatility OscillatorThis tool displays relative volatility and directional trend. Excellent way to pickup diversions and reversals. Length can be lowered to 11 or 13 in settings to show price range.
Can be used to identify patterns such as parallel channels and likely direction of price action as pictured below.

Peak Profit v2 (Reversal Points & High/Low Waveform)This script includes two different methods of indication.
It includes a High/Low Waveform . It is a technical indicator that is best performed when using a trailing stop, it also works well as a trend line.
Trade with caution however the general idea is to buy when line turns green, and sell when the line turns red.
This can be disabled by clicking the checkmark in the visual settings of the script.
Second Feature is an indicator for Reversal points . These show a price to "enter long" and "take profit"
This part of the script looks for a series of consecutive closes greater than or less four closing price bars to define an underlying uptrend or downtrend.
In general, minor price reversals are associated with the completion of the trend and major market turning points are identified by the completion of a trend of a specific series of bar openings/closes.
As always, this script should not be relied upon alone for your sole indication of buying and selling. Use your own intuition and other indicators along with this one for the best results.

Turbulence reversalGiven that the market turbulence tends to cluster, I developed a turbulence moving average system to reveal the unseen underlying structure of the least resistance path for trend following.
Here, I used an SMA subset from the turbulence moving average system to determine the trend direction. This estimation is achieved by calculating the dynamic changes of SMA slope angle and distance between SMA. The former represents a possible reversal signal, and the latter shows the resistance from the intermediate-term SMA.
When the short-term slope angle crossovers the intermediate-term slope angle, the indicator will give a star sign, indicating a possible trend reversal.
Use this indicator together with the turbulence moving average system (Turbulence with direction).
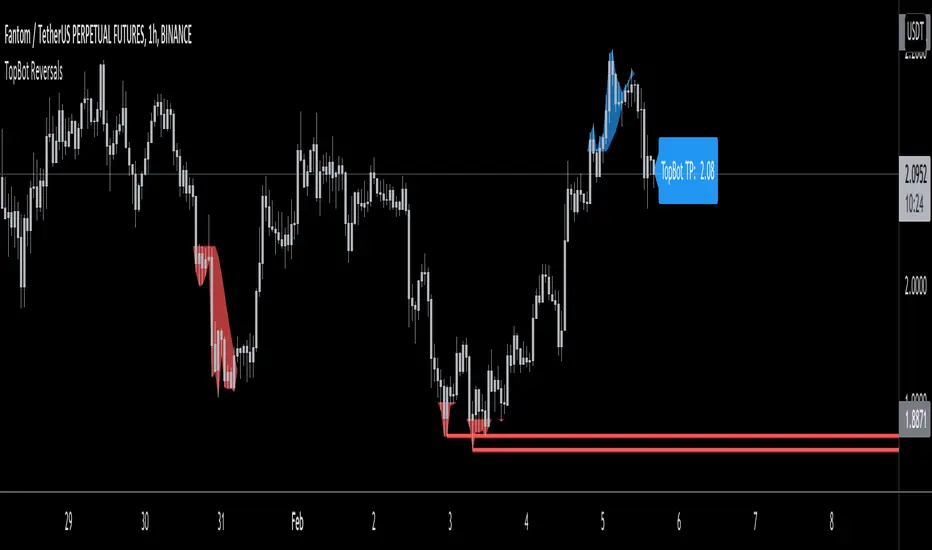
TopBot ReversalsThe TopBot Reversal indicator utilizes exhaustion and historical price levels to draw a possible recent top and bottom level. Using these lines together with other directional indicators such as Stochastic or RSI, we can draw a conclusion to a possible reversal at these levels.
Use the link below to obtain access to this indicator.
ATR Auto Oscillator [DepthHouse]The ATR Auto Oscillator uses advanced range calculations to determine a dynamic range that the applied market moves within. Like an RSI , the ATR Auto Oscillator measures the speed and change of price movements through a given range. Unlike an RSI , the ATR Auto Oscillator automatically re-configures range values dependent on the user set lookback.
The oscillator ranges between (0.1) and 1.1. Generally, the market is oversold while the bands are below 0.2 and is overbought while above 0.8.
The two bands displayed are used to determine short term trend directions and the oversold/undersold state of the applied market. Crossovers of these bands could give a hint to the direction the market is moving.
The fast band (green) is the direct value of where the market is within its calculated range; 1.1 representing the top of range, and -0.1 representing the bottom. Even when this value is near the bottom of the top of the range, the auto oscillator will readjust to create a new range that the market travels within.
The slow band (red) is a lagging version of the fast band which is used to determine the oversold/overbought signals. When this band travels within the oversold and overbought regions the background color will change to signal a warning. If the fast band crosses the slow band within these zones, an opaque signal will appear. These signals are used to catch possible trend reversals.
Breakout Signals ( BETA ):
Breakout signals are the up and down arrows displayed on the top and bottom of the oscillator. A refined range is generated by the user set 'High Low Length'; it is then displayed by the light gray horizontal lines. If the user set band (fast or slow) returns into the range within a given period (breakout offset) then a signal will generate.
Built in Alerts (must be set up by user):
Bullish & Bearish Crossovers within the oversold and overbought ranges.
Bullish & Bearish Breakout alerts (beta)
Users can also set custom alerts. Example: Fast Band crossing up Value: 0.7
To gain access to this indicator please follow the link below.
Feel free to message me with any questions directly here on TradingView.

FTSXFisher transform & RSX for reversal points in price.
Potential price reversals are regular divergences and potential trend continuations are hidden divergences, OB/OS levels are shown with red and green lines.
JD ProgressJD Progress Indicator is a two-part algorithm that is designed for both the 4hr and DAILY chart with unique alerts for each timeframe.
This can be applied to Forex, Stocks, Crypto and Metals
How to use;
4hr - When price crosses the channels and the confirmation indicators at the bottom all align, the trade alerts will be shown on screen.
D1 - When the price crosses the channels (no need to wait for confirmation indicators), the trade alerts will be shown on screen
There are a number of rules baked into the code to try and eliminate as many fake signals as possible.
ATR targets and stop losses are also shown on screen and can be hidden if desired. I'd suggest aiming for 1x ATR target and 1.5 ATR Stop Loss. Use two trades and let the second run with a trailing stop.
This algorithm is essentially a reversal system that uses a number of specifically tested and chosen indicators to identify reversals as early as possible.
When to trade.
4hr - I suggest trading Tues - Thurs when trading the 4hr. Background shading will assist with this.
D1 - Trade 5 days a week.
With both timeframes, wait for the bar to close and place a pending order with a 5 pip gap.
JD Core in action
How to Access
Gain access to JD Progress Confirmations for your TradingView account through our website, links below.
7 day paid trials, subscriptions and lifetime access are all available.
All tiers give you full instructions on how to trade this strategy.

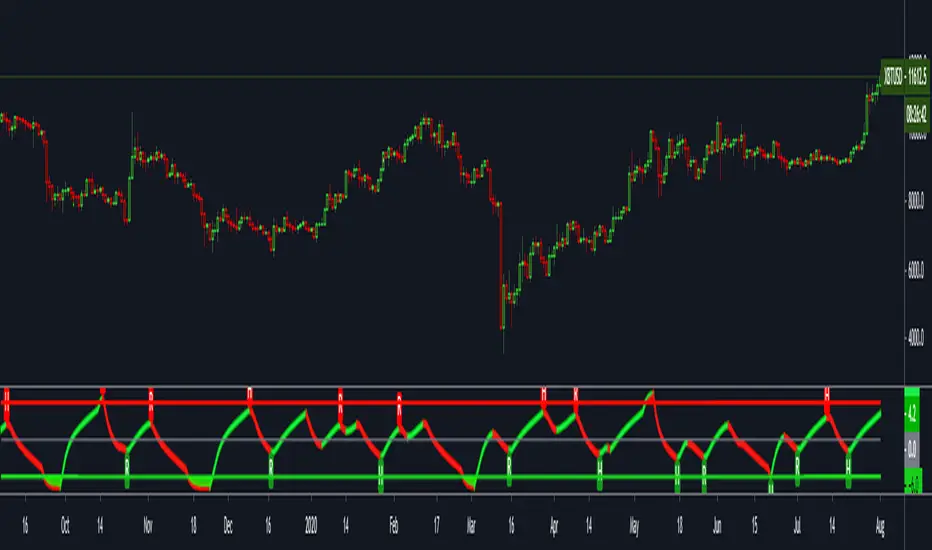
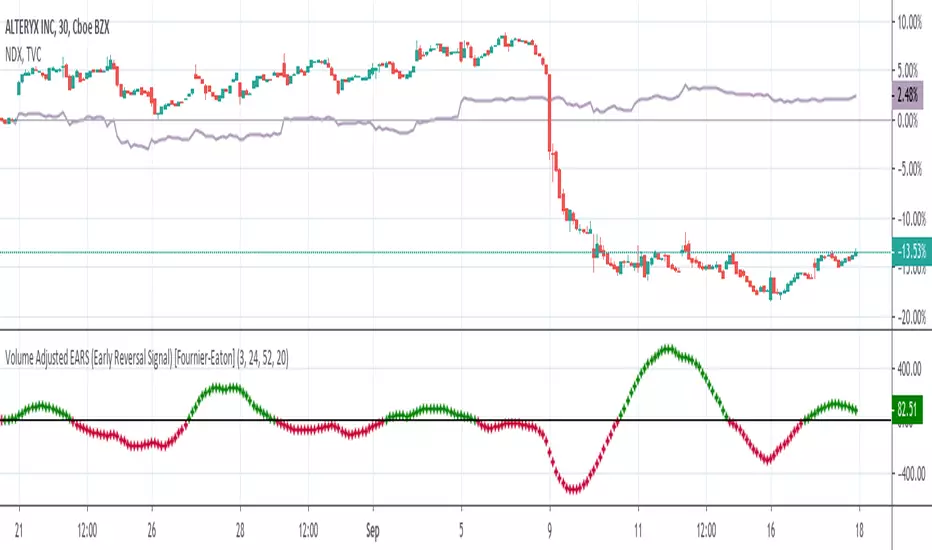
Volume Adjusted Early Reversal Signal (EARS) [Fournier-Eaton]Use WITH another indicator. (Works well with Trend Shift Indicator)
This is for early signaling of reversals. Use for early entry/exit.
Treat as macd with crossovers being key.
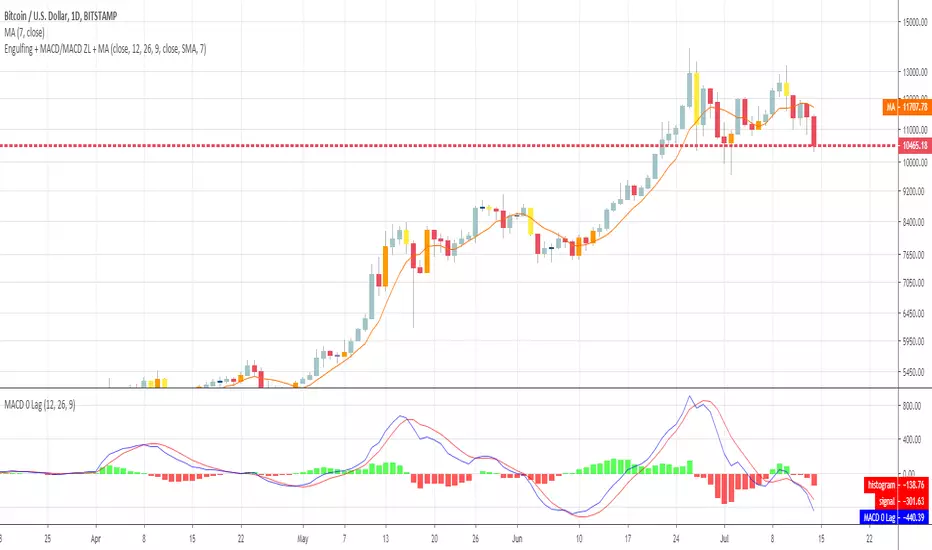
Engulfing + MACD/MACD ZL + MAHi everyone
This is a simple algorithm that I used on timeframe > m30 to detect strong reversal signals based on :
- Engulfing pattern
- MACD ZL 12, 26, 9
- Price vs SMA 7
Last two parameters are optional but gives more security. Otherwise, waiting for confirmation gives later entry.
Up to you to find the right balance between too much security (and taking the trade too late) and not enough confirmation (taking the trade too early and it will go the opposite way)
I recommend the novice traders (less than 2 years trading), to stick with the 3 parameters above .
It's to be used after a strong moment and as we're talking about reversals, I mean trade against the current trend.
Meaning they're more risky, so... you know the drill :) :
- Tight SL
- Protect the position quickly when going in the way you want
- Don't aim for very high TP. Have a few laddered obviously in any case
- Use a trailing stop to protect your gains
Hope you'll like it
Enjoy
Dave
Volume Spread IndicatorVolume Spread Indicator is based on my understanding of Volume Spread Analysis (VSA). VSA is the third approach for analyzing the price of a stock, forex or cryptocurrency. VSA looks for the difference between supply and demand that are created by a professional trader, institutional players which are called Smart Money.
This Indicator shows SV(Stopping Volume), NS (No Supply), ND (No Demand), -RC( Reverse Candle). Stopping volume and No supply appearing at key support level indicates Bullish Reversal. -RC and ND appearing at key resistance level indicate Bearish Reversal. This indicator can be used as Bottom and Top.
This Indicator can be used effectively with the combination of AutoFibe indicator, Scalping sell and buy Indicator.
Stopping Volume is shown as SV
No Demand is shown as a triangle down (Red)
No Supply is shown as a triangle up (Green)
Reverse Candle is shown as -RC

Market direction and pullback based on S&P 500.A simple indicator based on www.swing-trade-stocks.com The link is also the guide for how to use it.
0 - nothing. If the indicator is showing 0 for a prolonged amount of time, it is likely the market is in "momentum mode" (referred to in the link above).
1 - indicates an uptrend based on SMA and EMA and also a place where a reversal to the upside is likely to occur. You should look only for long trades in the stock market when you see a spike upwards and S&P 500 is showing an obvious uptrend.
-1 - indicates a downtrend based on SMA and EMA and also a place where a reversal to the downside is likely to occur. You should look only for short trades in the stock market when you see a spike upwards and S&P 500 is showing an obvious uptrend.
