HOLP/LOHPThe HOLP strategy was developed by trader-author John F. Carter in his book 'Mastering the trade: proven techniques for profiting from intraday and swing trading set ups' (ISBN 0-07-145958-8). The strategy, which gives buy signals, is a reversal strategy. Reversal strategies try to determine the point in time when a trend reverses direction. In his book John F. Carter is actually skeptical of taking a position against the trend, quoting classics like "never catch a falling knife" (buy a steep sell off) and "never step in front of a train" (short sell a strong market). Given his skepticism he decides to base his strategy on the one single factor which he deems relevant: the market price.
Cari dalam skrip untuk "reversal"

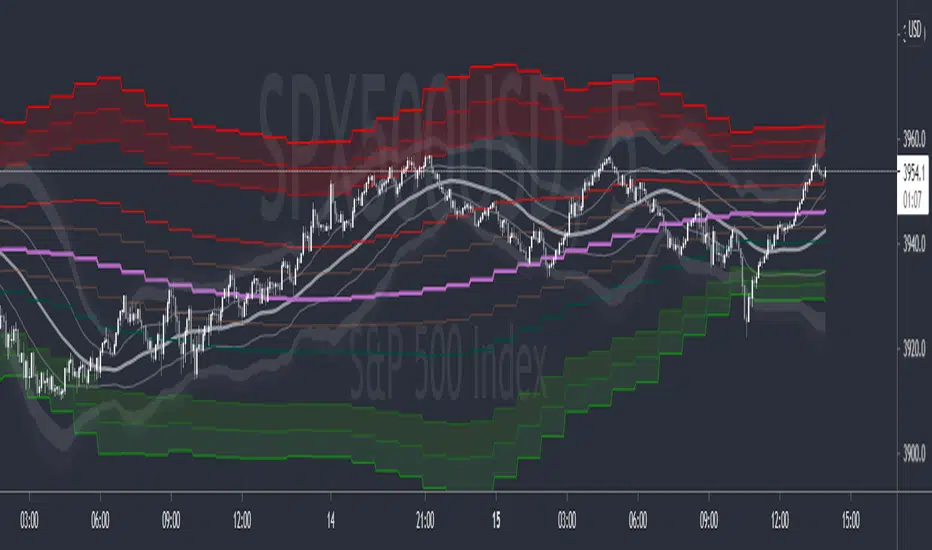
Inverse BandsThis was the result of quite some time spent examining how much information could be gleamed by studying the interactions between Keltner Channels, STARC Bands and Bollinger Bands. I was surprised by the results.
First of all, there are four fills that are black. Set the transparency of those to 0 and you'll see this indicator the way that it's meant to be seen. Those fills belong to unused sections of the Bollinger Bands.
There are two clouds which represent STARC Bands and the Keltner Channel. There is some delay when they flip from bullish (green) to bearish (red), but they are indicative of the trend. The space between them is black and the narrower that space is, the greater volatility is. Because of this, we don't need the exterior Bollinger Bands.
The Bollinger Bands remain visible as the yellow interior clouds on the top cloud and the blue interior clouds on the bottom cloud. Often, the thicker the yellow or blue cloud is, the less severe a throwback from a given trend reversal will be. Often the thinner that yellow or blue cloud is, the more severe the trend reversal will be. If price is rising into a thin interior yellow cloud, the following dip will be substantial. If price action dips towards a thicker interior blue cloud, often the pump following that dump will be less enthusiastic.
We preserve the Keltner Channel and STARC bands as our cloud because the way that they interact with the three basis lines yields a lot of information.
The yellow Bollinger basis line tells us about trend strength. The closer the BB basis line is to the top of the top cloud or the bottom of the bottom cloud, the stronger the trend is. When it enters the cloud very close to the bottom of the bottom cloud, you know you're looking at a strong pump, and vice versa when it's close to the top of the top cloud.
The purple Keltner Channel basis line and orange STARC Band basis line can forecast short term trend changes one candlestick in advance by contacting any line in either cloud. The moment either basis line touches or crosses any boundary of the clouds, you know that the next candle will change directions. In an uptrend, a touch or cross means the next candle will have a lower high point. In a downtrend, a cross or touch means the next candle will have a higher high point. This is most useful in scalping.
It'd be pretty easy to slap some crossover alerts on to this and useful considering that they come a candle in advance. Feel free to further explore and develop this.

[TrustedSignals] Doji ScalperTrustedSignals Dojji Scalper is our most basic trading algorithm. It is based on Candle Patterns that show potential market reversal points.
The script has 3 different types of signals, which can be individually turned on and off:
- Doji signals, based entirely on the Doji candle pattern and 2 Strong and Weak candle reversal patters
As a bonus, we have included RSI based Support and Resistance bands that, if used correctly can further confirm all the entry signals
All chart signals can be set up as live alerts!

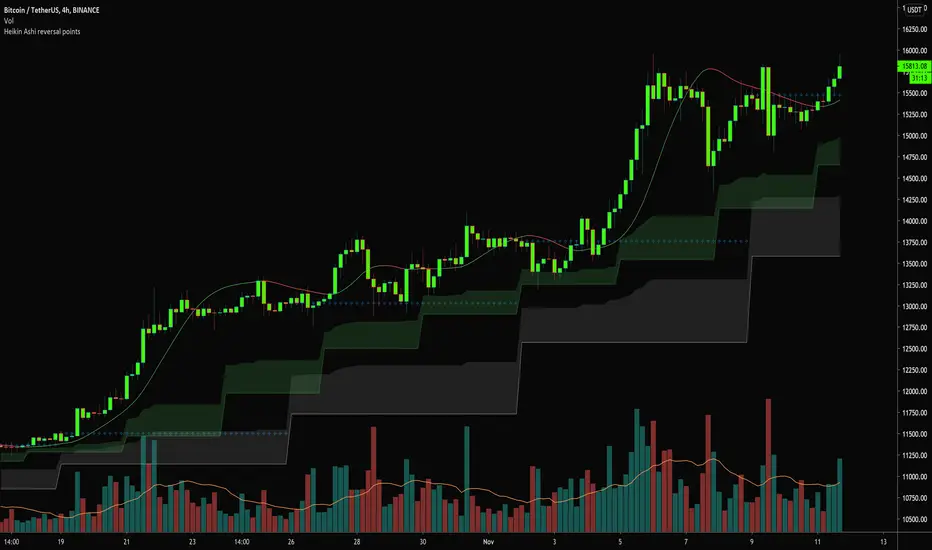
Heikin Ashi reversal pointsThis study plots higher time frames Heikin Ashi candles open values and creates clouds above/below those value. When lower timeframe candles enters this cloud - that is the turning point, where HTF Heiking Ashi candle change its color.
Script uses ALMA smoothing of current selected time period. When ALMA enters area, where HTF candles changes its color, then current candle is colored based on the possible next trend.
Script can be used for any time periods, but default values 4H ALMA , 3D (fast) and 1W(slow) Heikin candles.
Green candle = ALMA above both faster and slower HA candle reversal point.
Red candle = ALMA below both faster and slower HA candle reversal point.
Gray candle = indicision points - ALMA is between faster and slower HA candle reversal point.
To add further details - hull moving averages might be displayed, to support prediction of the next price trends.
Script was developed mainly for crypto
Outside Reversal CandleA lot of people get freaked out by outside reversal Days in the market like what we had yesterday.
"I think a great learning tool would be an indicator that highlights on the chart any outside reversal bar"
Rules:
both the high and the low is higher than the previous day
the low of the day is in the bottom 1/3 of the price range
the volume is higher than the bar immediately before it
With indicator every Outside Reversal candle body and background is highlighted,
People can now easily go back in time and see what happened after and make adjustments to their strategies.

Pivot Reversal AlertsPivot Reversal Study script, for generating Alerts and visual plotting of Pivot Reversal lines on the charts. Use a Strategy script (like Figs & Dates), for backtesting different settings on various time frames and charts.

Smoothed Pivot Reversal Alerts [QuantNomad]This is study with alerts for my "Smoothed Pivot Reversal Strategy". Strategy script is open to the public so you can use it freely.
When creating alerts - choose "Once Per Bar Close"
It's a pro indicator, you can have access to it for a small fee. Link to my PRO indicators you can find in my signature.

PRP - Pivot Reversal + PSAR Alerts [QuantNomad]This is study with alerts for my "PRP - Pivot Reversal + PSAR Strategy".
When creating alerts - choose "Once Per Bar Close"
It's a pro indicator, you can have access to it for a small fee. Link to my PRO indicators you can find in my signature.

MTF Nested BB w/ Reversal SignalsNested BB with 1 Dev line and 2/3 Dev Cloud
Threshold signal indicating strong / extended move in direction ..
Reversal signal indicating potential reversal ..
Color / direction coated based on band that is extended .. band that price is reversing towards ..
QuantNomad - Significant Pivot Reversal Strategy AlertsAlerts for "Significant Pivot Reversal Strategy":
As one of the ways to filter out insignificant levels I decided to check that pivot point is not above/below neighbors, but check that it's above/below at least by a certain amount.
I use ATR, so in params, you can set length of ATR and also ATR multiplier. The new level will be calculated only if PP will be above/below neighbors by atr * atr_mult.
It seems this approach might help in some cases.

Pivot Point Reversal + RSI AlertsThese are alerts for previously published strategy:
This strategy joins the Pivot Reversal strategy with the RSI indicator.
We check RSI level at the pivot point level and only if RSI condition is satisfied we update levels for stop orders.

SWING POINTS HOUNDTry's to find possible swing points and reversal points using mutli time frame moving averages and Fibonacci retracement with multiple lengths. Can be used to gauge trends and find potential entry points for trend following strategies. Can also be used to find potential price reversal points and areas of heavy resistance/support.

ProZ Reversal Indicator [jwammo12]This is an indicator version of the ProZ Reversal Strategy that includes alerts for Entries, Exits, as well as the dot indicators
See the strategy here
This is a mean reversion strategy that I have backtested extensively on other platforms and personally trade.
It works best on currency pairs, although it also works very well in all markets if you have a bullish/bearish bias and only take trades in a single direction, or in a range-bound market.
Ask for a 3-day free trial and pricing.

Inside Reversal Engulfing BarInside bar bullish = yellow
Inside Bar bearish = orange
engulfing bar bullish = green
engulfing bar bearish = red
reversal bar bullish = blue
reversal bar bearish = purple

PivotBoss Extreme Reversal SetupPATTERN SUMMARY
1. The first bar of the pattern is about two times larger than the average size of the candles in the lookback
period.
2. The body of the first bar of the pattern should encompass more than 50 percent of the bar's total range, but
usually not more than 85 percent.
3. The second bar of the pattern opposes the first. If the first bar of the pattern is bullish (C > 0), then the second
bar must be bearish (C < 0). If the first bar is bearish (C < 0), then the second bar must be bullish (C > 0).
PATTERN PSYCHOLOGY
The extreme reversal setup is a clever pattern that capitalizes on the ongoing psychological patterns of
investors, traders, and institutions. Basically, the setup looks for an extreme pattern of selling pressure and then
looks to fade this behavior to capture a bullish move higher (reverse for shorts). In essence, this setup is visually
pointing out oversold and overbought scenarios that forces responsive buyers and sellers to come out of the dark
and put their money to work-price has been over-extended and must be pushed back toward a fair area of value
so two-sided trade can take place.
This setup works because many normal investors, or casual traders, head for the exits once their trade
begins to move sharply against them. When this happens, price becomes extremely overbought or oversold,
creating value for responsive buyers and sellers. Therefore, savvy professionals will see that price is above or
below value and will seize the opportunity. When the scared money is selling, the smart money begins to buy, and
Vice versa.
Look at it this way, when the market sells off sharply in one giant candlestick, traders that were short
during the drop begin to cover their profitable positions by buying. Likewise, the traders that were on the
sidelines during the sell-off now see value in lower prices and begin to buy, thus doubling up on the buying
pressure. This helps to spark a sharp v-bottom reversal that pushes price in the opposite direction back toward
fair value.

Kozlod - Pivot Reversal Strategy Alerts V2Its' new version of previously published Kozlod - Pivot Reversal Strategy Alerts
Indicator now better correspond to original strategy. However, there can be some differences. Problem is that it's pretty tricky to implement in plain PineScript same "stop" logic used in strategy.entry of the original script

Ultimate Reversal SystemUltimate Reversal System
1- Designed and ideal for Binary Options trading.
2- Extensive testing and accuracy proven to have a +95% win rate in all market conditions, when applied correctly. This system requires a martingale strategy up to the 3rd level. Suited for all currency pairs. Tested on 5 minute trades, but could be used for different time frames.
3- Respect to high volatile news is recommended.
4- The system includes a variety of ideally customized indicators, working in harmony for optimum results.
This system has proved itself solid and reliable. I have full confidence in the Ultimate Reversal Strategy! I Publish it, because I truly believe in it.
You can have the "URS'' indicator for a once off purchase price of $100. When purchased along with a friend, you could each have access for only $75. After your purchase, you will be provided with a step-by-step practical application document via e-mail.
If you are interested, and would like secure and profitable results, kindly e-mail me at marais.francois@hotmail.com
Looking forward to hear many success stories and positive results!
Kind regards,
Francois


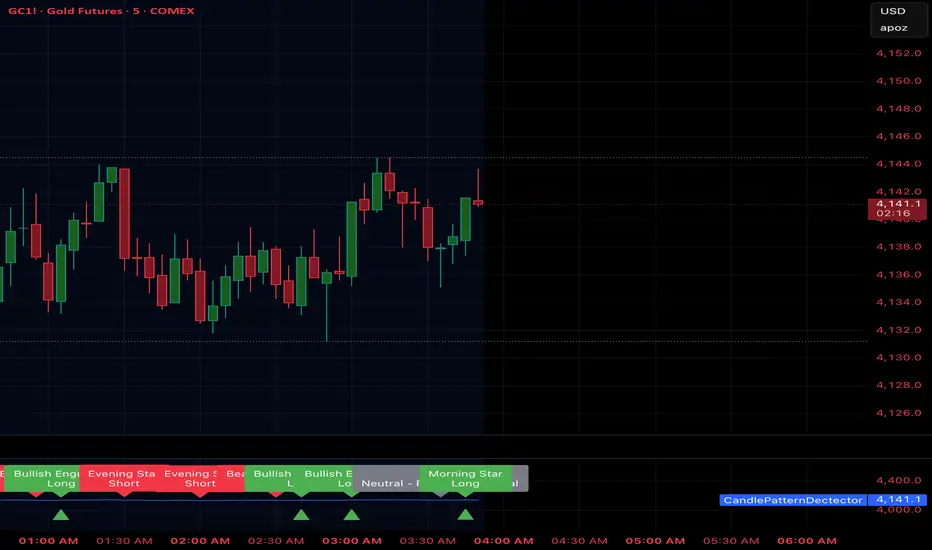
Candlestick Pattern Detector with Smart Context SignalsThis indicator identifies and labels classic candlestick patterns—such as Doji, Hammer, Shooting Star, Engulfing, Morning Star, Evening Star, Piercing Line, Dark Cloud Cover, Three White Soldiers, and Three Black Crows—and automatically translates each into a directional trading bias.
What makes it unique is its context-aware logic. It doesn’t just detect shapes—it interprets them based on recent market behavior.
By combining candle structure ratios with a trend-recognition filter (ta.rising and ta.falling), it distinguishes whether a pattern is likely a reversal or a continuation.
For example:
A long-wick candle after a series of falling closes is labeled Hammer → Long.
The same candle during a rising trend becomes Hanging Man → Short.
The script uses adaptive thresholds instead of fixed pip distances, calculating the 5-bar simple moving average of both body size and total candle range.
All pattern definitions are expressed as proportional relationships (for instance, a Doji body ≤ 10 % of average body size and total range ≥ 80 % of average).
This allows the algorithm to scale automatically across instruments and timeframes.
Visual outputs:
Pattern name and trade direction label above or below candles
Green triangles for Long setups, red for Short, Grey for neutral
Built-in alerts fire once per new signal to prevent repetitive notifications
This tool helps traders read price action rather than rely solely on indicators, offering an educational bridge between visual candlestick analysis and coded automation.
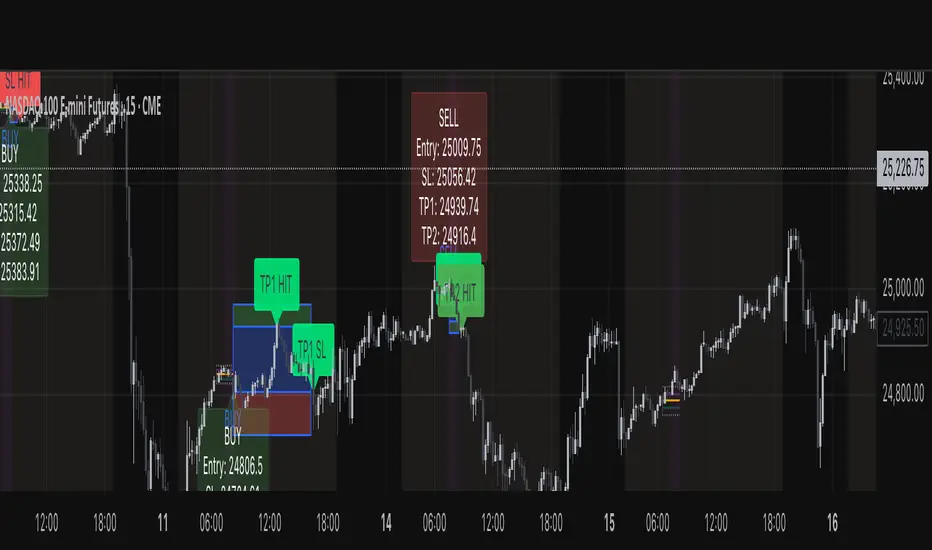
Quantel Asia Reversal ModelEntry/SL/TP1/TP2 signals from a model that targets 1 reversal during Asia session.
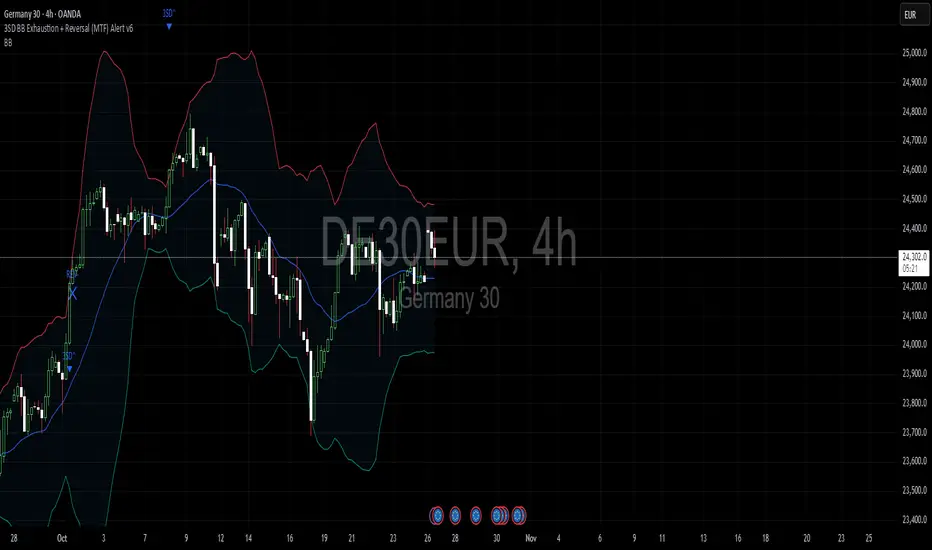
3SD Bollinger Exhaustion & Reversal Alert IndicatorThe Bollinger Band 3 Standard Deviation (3SD) captures roughly 99% of price action within its boundaries.
When price moves beyond these extremes, it often signals temporary overextension — creating opportunities for mean reversion trades, especially when aligned with the prevailing trend.
This indicator alerts you when:
- Price touches the 3SD Bollinger Band on higher timeframes (H4, D1, W1, M1), and
- A reversal reaction occurs — defined by a bullish or bearish candle close on H1 or H4.
Together, these conditions identify potential high-probability entry zones where exhaustion meets trend alignment.
🚀 Coming Soon
A premium version is in development, combining this 3SD exhaustion logic with my proprietary trend-following system.
It will generate confluence-based trade signals when price interacts with both the 3SD band and the trend-following band.
Stay tuned for updates.
Bullish & Bearish Reversal Pattern with Sequential Bars20 Bollinger Bands and custom Stochasti_MTM Setup
Both long and short reversal signals.

PDB - RSI Buy & Sell Zones + SMA (PrintDemBandz)PDB - RSI Buy & Sell Zones
A clean, upgraded version of the RSI with shaded momentum zones to make entries and exits easier to spot. The background is divided into five color-coded zones so you instantly see when the market is shifting from bullish to bearish momentum.
Shaded Zones Explained:
| Zone | RSI Range | Zone Meaning |
| --------------------------- | --------- | ----------------------------------------------------- |
| Strong Buy (Dark Green) | < 30 | Oversold extreme – high probability bounce zone
| Buy Zone (Light Green) | 30–40 | Early accumulation & potential reversal area
| Neutral (Grey) | 40–60 | No edge zone – stay patient and wait for direction |
| Sell Zone (Light Red) | 60–70 | Market heating up – take profit or prepare to short |
| Strong Sell (Dark Red) | > 70 | Overbought extreme – high probability correction zone |
A dashed midline at 50 helps instantly gauge trend bias (above = bullish, below = bearish).
Use this RSI alone or combine with MACD or MA for stronger confirmations.
Search "PDB" in the indicators section for more free indicators.
