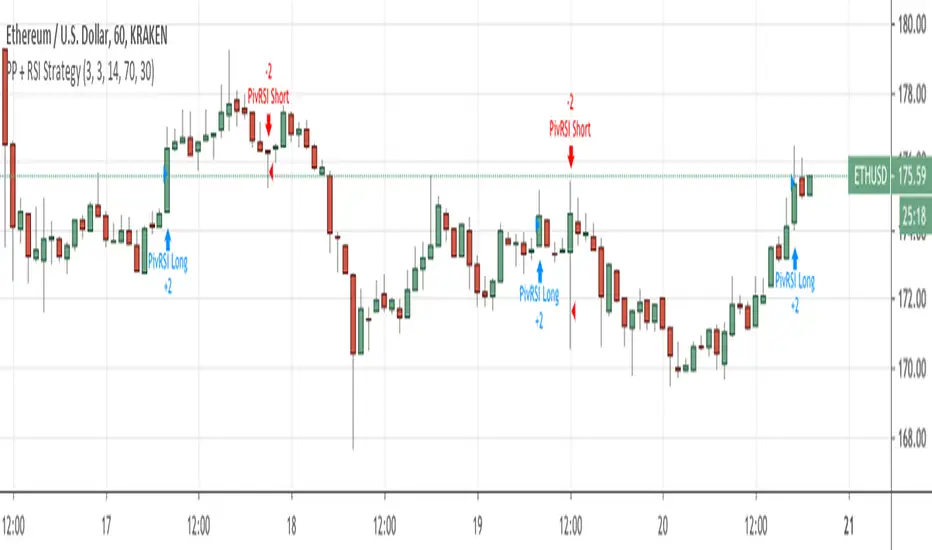
Pivot Point Reversal + RSI StrategyThis strategy joins the Pivot Reversal strategy with the RSI indicator.
We check RSI level at the pivot point level and only if RSI condition is satisfied we update levels for stop orders.
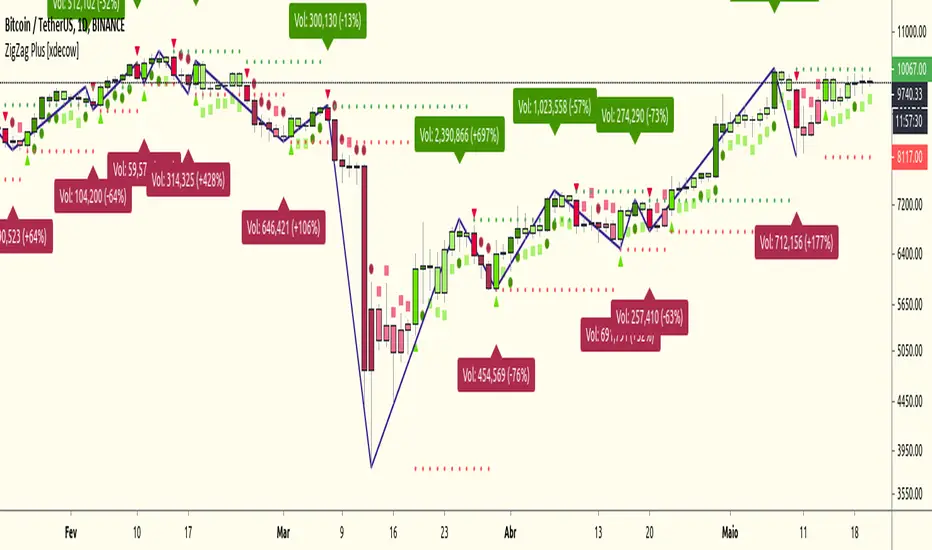
The strategy works pretty good for crypto, 30m, 1h, 2h timeframes.
Strategi Pine Script®