EMA Reversal PointEMA Reversal Point
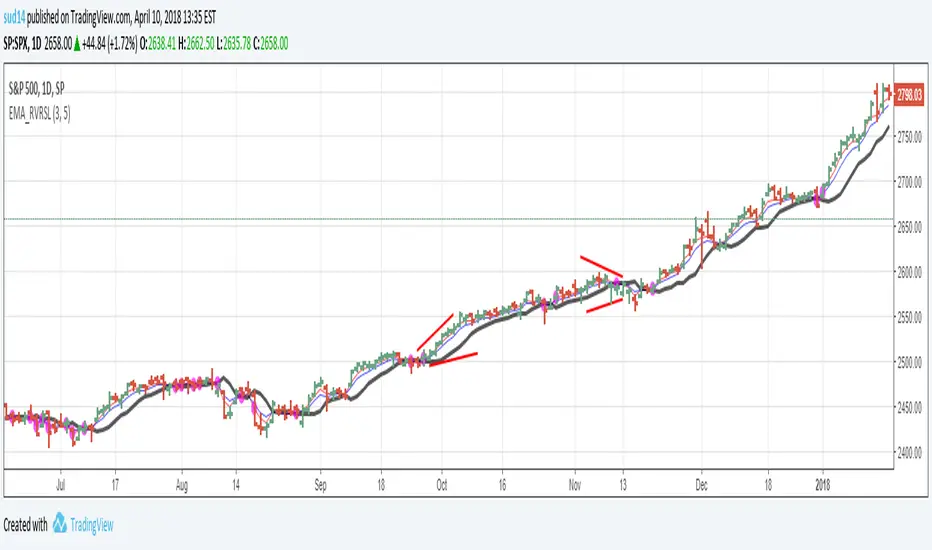
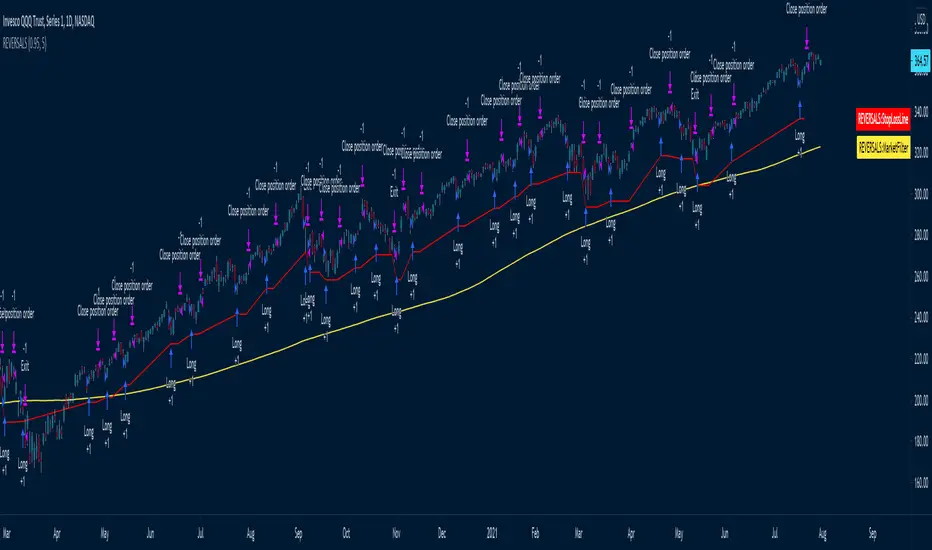
The script calculates the "likely" reversal point of 2 EMAs (3 and 5 for example) and plots as a line. The points there the EMA cross are highlighted with a Purple circle.
The way I use this indicator is by visually confirming that the reversal line is diverting away from price in case of strong trends.
Divergences between reversal line and price line are good entry points.
Wait for the price bar to clear the reversal line completely before initiating trades. (No overlaps!)
This is my first indicator script so please be kind on the comments!!
Penunjuk Pine Script®