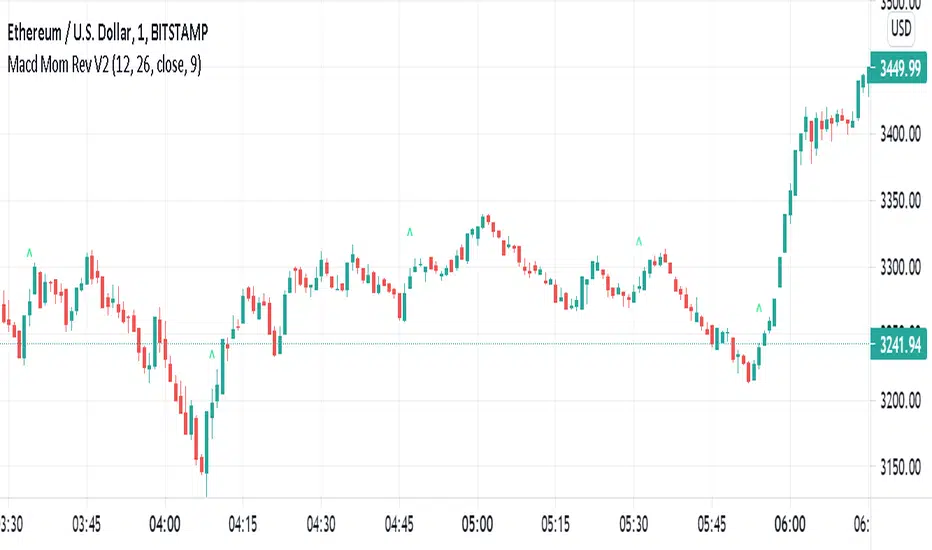
Simple Macd Momentum Reversal IndicatorThis Simple indicator uses the MACD history to check trend reversals. It primarily check if the histogram has moved up from a downtrend above a certain margin. If it has, it places a green B on the chart. If you were to use/improve this indicator, please use it with other indicators to confirm your position. This is NOT an indicator that can be well used alone.
Cari dalam skrip untuk "reversal"
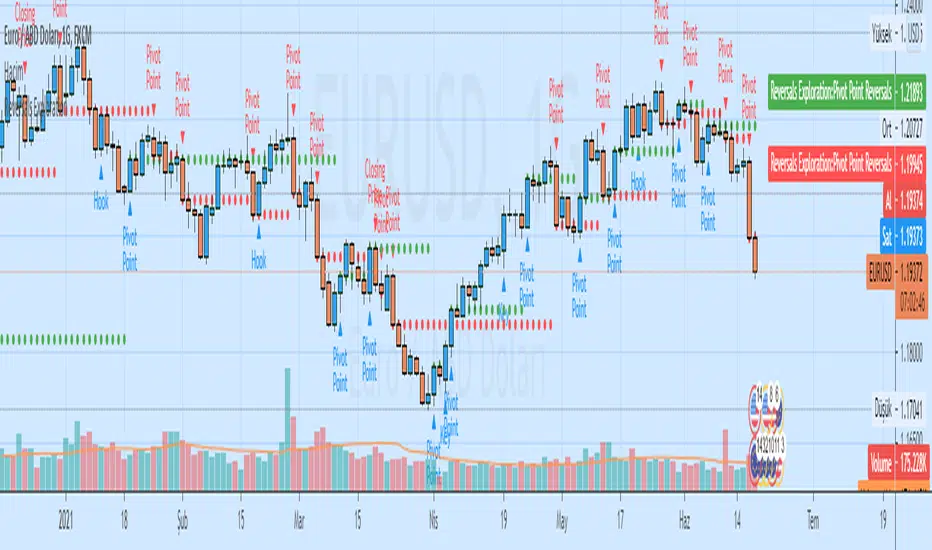
Auto Analysis Short-term Reversals ExplorationAuto Analysis Short-term Reversals Exploration
Based on a study by Larry Lovrencic
Closing Price Reversals Automatic Analysis
Hook Reversals Automatic Analysis
Island Reversals Automatic Analysis
Key Reversals Automatic Analysis
Open/Close Reversals Automatic Analysis
Pivot Point Reversals Automatic Analysis
TheStratHelper-Short Reversalsbased on the teachings of Rob Smith
1= Inside Candle
2= Break on one side
3= Englufing Candle/Outside Candle
Identifies short setups like 212, 312, 122 and 22
My potential entry is marked with a green line and a label that tells you the price as well. I typically enter 1 or 2 cents belowthe marked entry.
My potential target (magnitude) is marked with yellow lines and a label that tells you the price as well.
212, 312 and 122 has entry and magnitudes marked. If there are multiple magnitudes, those are marked with yellow lines which has the price written right above them. The program looks at potentially 4 or 5 magnitudes.
No magnitudes marked for a reversal 22.
Most of the colors can be customized
PM me for more info on how to access this indicator

TheStratHelper-Long Reversalsbased on the teachings of Rob Smith
1= Inside Candle
2= Break on one side
3= Englufing Candle/Outside Candle
Identifies long setups like 212, 312, 122 and 22
My potential entry is marked with a green line and a label that tells you the price as well. I typically enter 1 or 2 cents above the marked entry.
My potential target (magnitude) is marked with yellow lines and a label that tells you the price as well.
212, 312 and 122 has entry and magnitudes marked. If there are multiple magnitudes, those are marked with yellow lines which has the price written right above them. The program looks at potentially 4 or 5 magnitudes.
No magnitudes marked for a reversal 22.
Most of the colors can be customized
PM me for more info on how to access this indicator

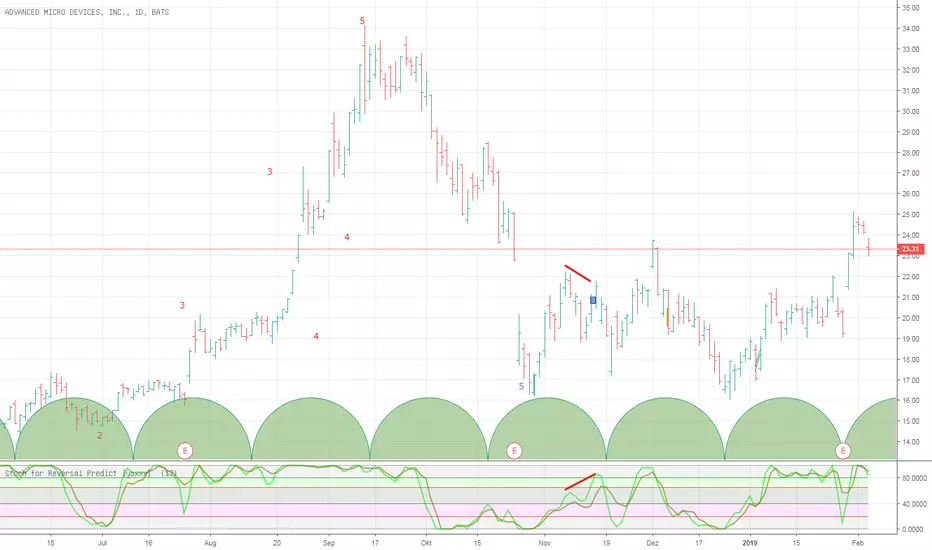
Stochastic for Reversal Predict [yoxxx] Usable for all markets, all time frames. (The bull bear sup/res lines are specific for stocks, but differ just a little to other instruments.)
This script is more likely a method support than a study - and your exit from the default stochastic club:
Most people use Stoch for ins and outs by 20 rsp 80 (a default behavior MM know well to deal with). C.G. Lane, the inventor of this indicator,
however used it to find divergences with quote (price / close) to predict reversals. Constance Brown refined this method by laying
a fix time cycle underneath the chart that is in rhythm with specific highs or lows of a stock or an index.
The length of one cycle divided by 2 equals the proper value for %D specified for that stock /index. The script offers an input for this specific value.
C. Brown stresses that good signals are only given within the bull or bear ranges (20-65 for bear markets, 40-80 for bull markets).
For your convenience, I laid these areas underneath the graphs. You can automate the divergence research (relative to quote)
by using my script "Bull Bear Divergence Indicator". Feedback welcome. Have fun and success.
Bar Trends & Reversals Emiliano MesaThe most advanced code made by me yet! Simple but extremely useful, based on "Reading Price Charts Bar by Bar" - Al Brooks. This indicator will highlight when the market is trending (green). Highlight reversal bars(red) and also bull/bear traps (yellow). I was not sure if to give away this indicator for free, but here it is.
Hopefully you guys enjoy it!
Interested in your own indicator? Email me here for business inquires : emilianomesauribe2000@live.com
(starting price 100$)
I DO NO TAKE RESPONSIBILITY FOR LOSSES. USE INDICATOR UNDER YOUR OWN MEANS
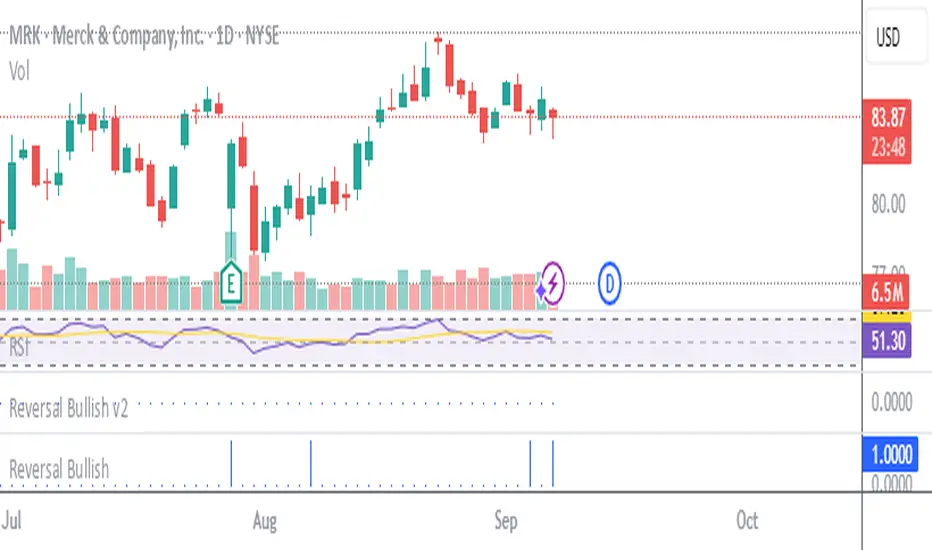
Stockbee Reversal Bullish v2Custom indicator for identifying stocks that meet the Stockbee's Reversal Bullish New criteria. This can be used as a standalone indicator or use it to screen for stocks in Pine Screener.

Stockbee Reversal BullishCustom indicator for identifying stocks that meet the Stockbee's Reversal Bullish criteria. This can be used as a standalone indicator or use it to screen for stocks in Pine Screener.
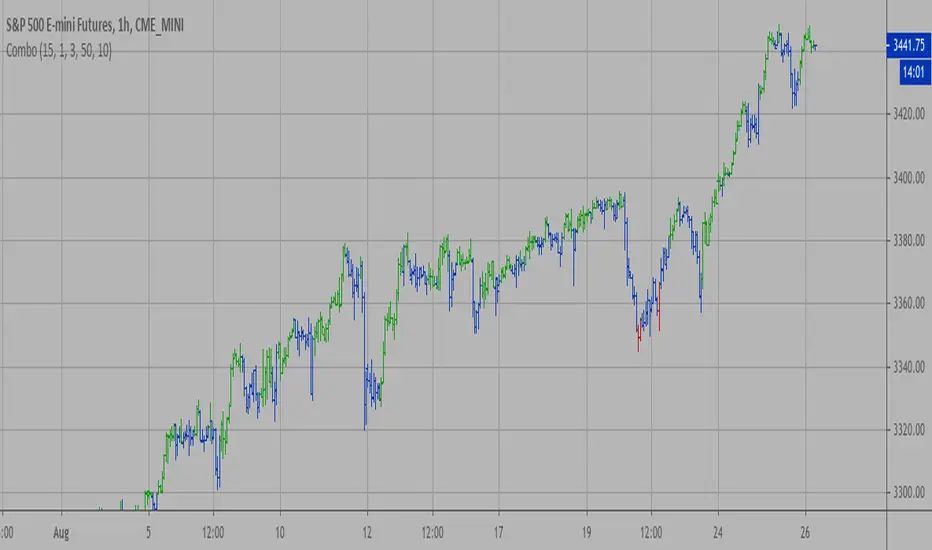
Combo Strategy 123 Reversal & Fisher Transform Indicator This is combo strategies for get a cumulative signal.
First strategy
This System was created from the Book "How I Tripled My Money In The
Futures Market" by Ulf Jensen, Page 183. This is reverse type of strategies.
The strategy buys at market, if close price is higher than the previous close
during 2 days and the meaning of 9-days Stochastic Slow Oscillator is lower than 50.
The strategy sells at market, if close price is lower than the previous close price
during 2 days and the meaning of 9-days Stochastic Fast Oscillator is higher than 50.
Second strategy
Market prices do not have a Gaussian probability density function
as many traders think. Their probability curve is not bell-shaped.
But trader can create a nearly Gaussian PDF for prices by normalizing
them or creating a normalized indicator such as the relative strength
index and applying the Fisher transform. Such a transformed output
creates the peak swings as relatively rare events.
Fisher transform formula is: y = 0.5 * ln ((1+x)/(1-x))
The sharp turning points of these peak swings clearly and unambiguously
identify price reversals in a timely manner.
WARNING:
- For purpose educate only
- This script to change bars colors.
My VWAP Reversal + Pivot Points StandardThis indicator, with the addition of a standard VWAP indicator to the 5m chart, helps the operator when using a closing candle Price to initiate a VWAP Reversal strategy.
The strategy involves Price gapping up, look for a Close below the 1st 5m candle Low; else look for a Close above the 1st 5m candle High. On a break of VWAP, take the trade in the opposite direction of the gap, hence the VWAP Reversal. Not my own strat, credit to T3 Newsbeat, publicly posted on YouTube.
The Pivot Points Standard in the Pine 4 user manual, was the base source code, and leaving it here will allow me to remove the PP indicator I was using.

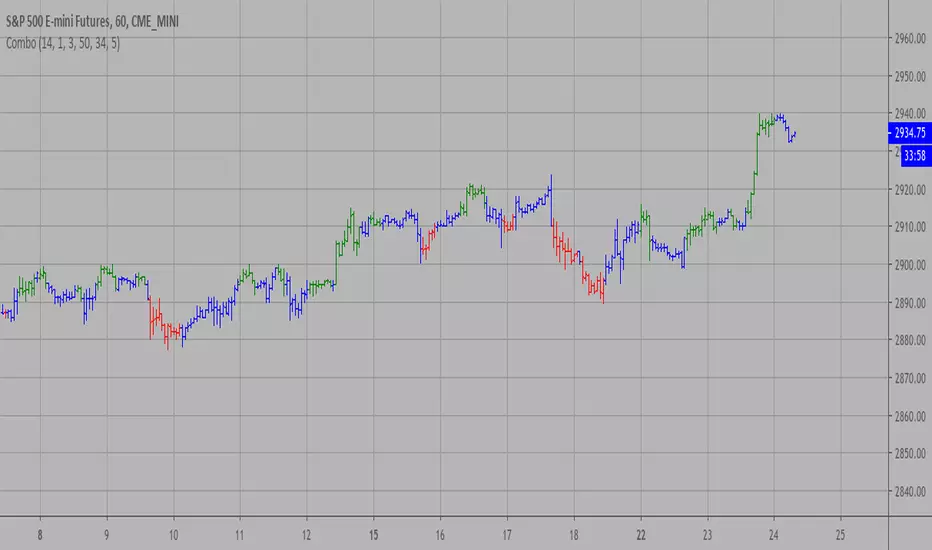
Combo Strategies 123 Reversal and Accelerator Oscillator (AC) This is combo strategies for get
a cumulative signal. Result signal will return 1 if two strategies
is long, -1 if all strategies is short and 0 if signals of strategies is not equal.
First strategy
This System was created from the Book "How I Tripled My Money In The
Futures Market" by Ulf Jensen, Page 183. This is reverse type of strategies.
The strategy buys at market, if close price is higher than the previous close
during 2 days and the meaning of 9-days Stochastic Slow Oscillator is lower than 50.
The strategy sells at market, if close price is lower than the previous close price
during 2 days and the meaning of 9-days Stochastic Fast Oscillator is higher than 50.
Second strategy
The Accelerator Oscillator has been developed by Bill Williams
as the development of the Awesome Oscillator. It represents the
difference between the Awesome Oscillator and the 5-period moving
average, and as such it shows the speed of change of the Awesome
Oscillator, which can be useful to find trend reversals before the
Awesome Oscillator does.
WARNING:
- This script to change bars colors.
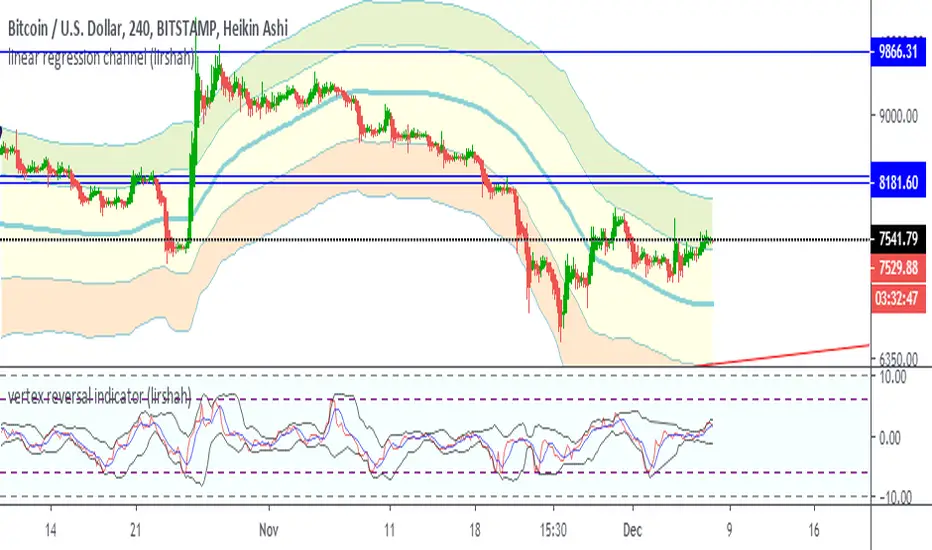
vertex reversal indicator (lirshah)Vertex reversal Indicator is a combined oscillator that combines of several indicators : Momentum, Moving Averages and Bollinger Bands , which makes it possible to accurately predict the trend reversal.
the calculation of this indicator has been written based on the current bar interval so it dose not repaint on any time frame.
the indicator has shown good performance on different markets and can be reliable.
Reversal Radar (ConfluenceJP)Reversals Bullish to help see the trend coming when it is difficult to see. Nothing Guaranteed just another tool to help.
Retracement and Reversal All in One with Custom SymbolA Special Visual indicator Retracement and Reversal All in One with Custom Symbol loaded with all retracement options in one indicator along with custom symbol feature, allowing traders to monitor multiple symbols at the same time.
For more details please see
1) Retracement and Reversal ,
2) Retracement and Reversal - Ver 1 ,
3) Retracement and Reversal with Custom Symbol ,
4) Retracement and Reversal All in One ,
Reversal Entries [akshaykiriti1443]Reversal Entries : An In-Depth Guide
This indicator is designed to identify high-probability trend reversal points. Its primary goal is to pinpoint moments where the price attempts to break a key level, fails, and then snaps back with force. These "fakeouts" or "liquidity grabs" are often powerful signals that the market is about to reverse course.
The indicator provides two clear signals:
* 🟢 **A Bullish "Bounce Point"**: A potential buy signal after price dips below support and recovers.
* 🔴 **A Bearish "Rejection Point"**: A potential sell signal after price spikes above resistance and is pushed back down.
---
## The Core Logic: What Makes a Signal?
The indicator doesn't just look at one factor. Instead, it requires **three key conditions** to be met simultaneously before it generates a signal. This multi-layered approach helps filter out noise and identify only the most promising setups.
### 1. The Price Action "Fakeout" 🕵️♂️
This is the foundation of the signal. The indicator first identifies a short-term support or resistance level.
* **Support:** The lowest price over the `Lookback` period.
* **Resistance:** The highest price over the `Lookback` period.
It then waits for a specific pattern:
* For a **Bullish Bounce**, the current candle's low must dip **below** the support level, but its closing price must be **above** that same support level. This shows that sellers tried to push the price down but buyers stepped in with overwhelming force.
* For a **Bearish Rejection**, the current candle's high must poke **above** the resistance level, but its closing price must be **below** that same resistance level. This shows that buyers tried to break out, but sellers took control and slammed the price back down.
### 2. Volume Confirmation 🔊
A true reversal is almost always accompanied by a surge in trading activity. The indicator confirms the price action by checking for a **volume spike**.
It calculates the recent average volume and only accepts the signal if the volume on the reversal candle is significantly higher than that average (the default is 1.5 times higher). This confirms that there is real conviction and money behind the move, making it much more reliable.
### 3. Recovery Strength & Probability Score 💯
This is the indicator's "secret sauce." It doesn't just see a reversal; it measures *how strong* that reversal is.
* **Measuring the Recovery:** It uses the Average True Range (ATR) to measure the size of the price's recovery. For a bullish bounce, it measures the distance from the candle's low to its close. For a bearish rejection, it measures the distance from the high to the close. A long wick in the direction of the reversal signifies a powerful rejection of lower or higher prices.
* **Calculating a Probability Score:** The indicator takes the volume spike confirmation and the recovery strength and feeds them into a mathematical formula (a sigmoid function) to generate a "probability score" between 0 and 1. Think of this as a confidence score.
* **Applying the Threshold:** A signal is only plotted on your chart if this confidence score is above the `Probability Threshold` (default is 0.7, or 70%). This is the final filter that ensures only high-conviction setups are shown.
---
## How to Use the Indicator in Your Trading
This indicator provides entry signals, but it should be used as part of a complete trading plan.
### Understanding the Signals
* **Green `+` (Bounce Point):** When you see this signal below a candle, it's a potential **BUY entry**. It suggests that the downward momentum has been rejected and the price may be ready to move higher.
* **Red `-` (Rejection Point):** When you see this signal above a candle, it's a potential **SELL entry**. It suggests that the upward momentum has failed and the price may be ready to fall.
### Example Trading Strategy
1. **Entry:** Enter a trade when a signal appears. For a green `+`, place a buy order. For a red `-`, place a sell order.
2. **Stop Loss:** A logical stop loss is crucial.
* For a **buy trade**, place your stop loss just below the low of the signal candle. If the price breaks this low, the reversal idea is invalidated.
* For a **sell trade**, place your stop loss just above the high of the signal candle. If the price breaks this high, the setup has failed.
3. **Take Profit:** Your take profit should be based on your own strategy. A common approach is to target the next significant support or resistance level or use a fixed risk-to-reward ratio (e.g., 1:1.5 or 1:2).
**Important:** Always consider the overall market context. These signals tend to be more powerful when they align with the broader trend or occur at major, higher-timeframe support and resistance zones.
---
## Customizing the Settings
You can fine-tune the indicator's sensitivity in the settings menu to match your trading style and the asset you are trading.
* **`Support/Resistance Lookback`**: Controls how far back the indicator looks to find support and resistance. A **smaller number** makes it more sensitive to very recent price action. A **larger number** will focus on more significant, longer-term levels.
* **`Volume Spike Multiplier`**: Defines what counts as a "spike." Increasing this value (e.g., to 2.0) will demand a much larger volume surge, leading to fewer but potentially more reliable signals.
* **`ATR for Recovery`**: This sets the period for the ATR calculation, which is used to measure the recovery strength. It's generally best to leave this at its default unless you are an advanced user.
* **`Probability Threshold`**: This is the most important sensitivity setting.
* **Increase it** (e.g., to 0.85) for fewer, very high-quality signals.
* **Decrease it** (e.g., to 0.60) to see more potential setups, though some may be less reliable.

Mayfair Reversal Change✅ Mayfair Reversal Change — By EastWave Capital
Description:
The Mayfair Reversal Change indicator is a tool designed to help traders identify potential market turning points using Stochastic Oscillator behavior and filtered price action logic. It acts as a reversal signal filter and is particularly effective when the market is overextended (overbought/oversold) and about to revert from exhaustion zones.
🔍 How It Works:
This script monitors the Stochastic %K and %D crossovers and adds a custom logic layer to filter only high-quality reversal points:
Stochastic Filter Conditions:
Uses smoothed stochastic settings:
%K smoothing = 3
%D smoothing = 3
Only shows signals after %K crosses back below 80 (for Sell) or above 20 (for Buy)
This prevents signals from appearing too early during an active overbought or oversold phase.
Directional Confirmation Logic:
Bullish signal is printed only when %K re-enters below 20 after a confirmed stochastic crossover.
Bearish signal appears only when %K re-enters above 80.
This reduces false signals that occur during continued trending moves.
Toggle Switch:
A user-toggle input is included to enable or disable the reversal filter logic.
This gives flexibility for traders who want to test signals with or without the stochastic condition.
📈 How to Use:
Timeframes: Recommended for 5M, 15M, and 30M
Markets: Compatible with any market — FX, Gold, Indices, Crypto
Entry Approach:
Wait for signal after price has reached a potential extreme area.
Confirm with chart structure, support/resistance, or SMC zone.
Enter on confirmation, placing stop loss beyond the swing high/low.
Combine with trendline breaks or price imbalances (FVG) for extra confluence.
Can be used in combination with the Mayfair FX Scalper script for dual-layer confirmation.
⚠️ Important Notes:
Signals are visual only and should be confirmed with proper strategy.
This indicator does not execute or manage trades automatically.
Designed to assist with reversal setups but should not be used in isolation.
Always manage risk, use SL/TP, and avoid over-leveraging.

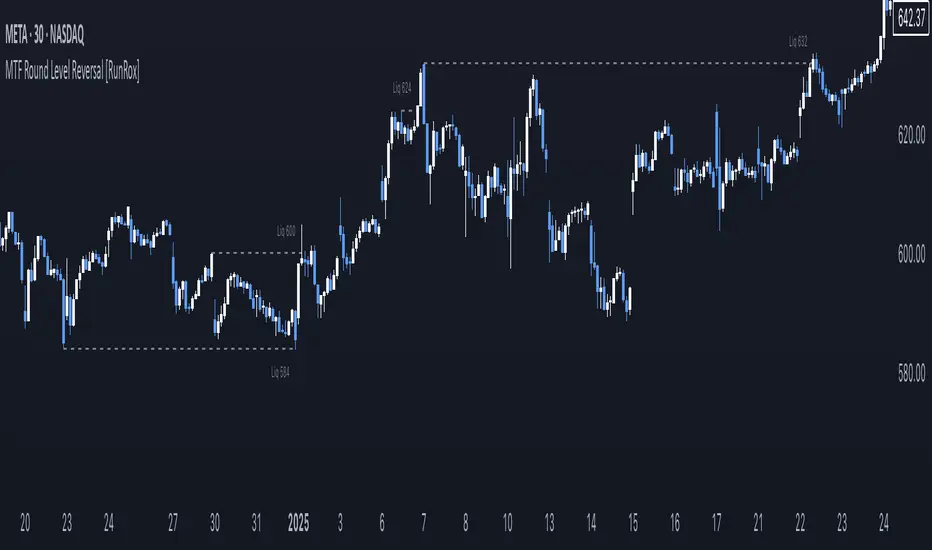
MTF Round Level Reversal [RunRox]🧲 MTF Round Level Reversal is an indicator designed to highlight price levels on the chart where the market encountered significant resistance or support at round numbers, failing to break through large clusters of orders.
In many cases, price revisits these round-number levels to absorb the remaining liquidity, offering potential reversal or continuation trade opportunities.
✏️ EXAMPLE
Here’s an example demonstrating how this indicator works and how its logic is structured:
As shown in the screenshot above, price encountered resistance at round-number levels, clearly reacting off these areas.
Afterward, the market pulled back, presenting opportunities to enter trades targeting these previously established open levels.
This logic is based on the observation that price often seeks to revisit these open round-number levels due to the residual liquidity resting there.
While effective across various markets, this indicator performs particularly well with stocks or assets priced at higher values.
For a level to appear on the chart, price must first encounter a round-number value and clearly reverse from it, leaving a visible reaction on the chart. After this occurs, the indicator will mark this level as fully formed and display it as an active reversal area.
⚙️ SETTINGS
🔷 Timeframe – Choose any timeframe from which you’d like the indicator to source level data.
🔷 Period – Defines the number of candles required on both sides (left and right) to confirm and fully form a level.
🔷 Rounding Level – Adjusts price rounding precision when detecting levels (from 0.0001 up to 5000).
🔷 Color – Customize the color and transparency of displayed levels.
🔷 Line Style – Select the desired line style for level visualization.
🔷 Label Size – Set the font size for the level labels displayed on the chart.
🔷 Move Label to the Right – Move level labels to the right side of the screen for better visibility.
🔷 Label Offset – Specifies how many bars labels should be offset from the chart’s right edge.
🔷 Delete Filled Level – Automatically removes levels from the chart after they’ve been revisited or filled.
🔷 Calculation Bars – Determines the number of recent bars considered when calculating and identifying levels.
🔶 There are numerous ways to apply this indicator in your trading strategy. You can look for trades targeting these round-number levels or identify reversal setups forming at these high-liquidity zones. The key insight is understanding that these levels represent significant liquidity areas, which price frequently revisits and retests.
We greatly appreciate your feedback and suggestions to further improve and enhance this indicator!
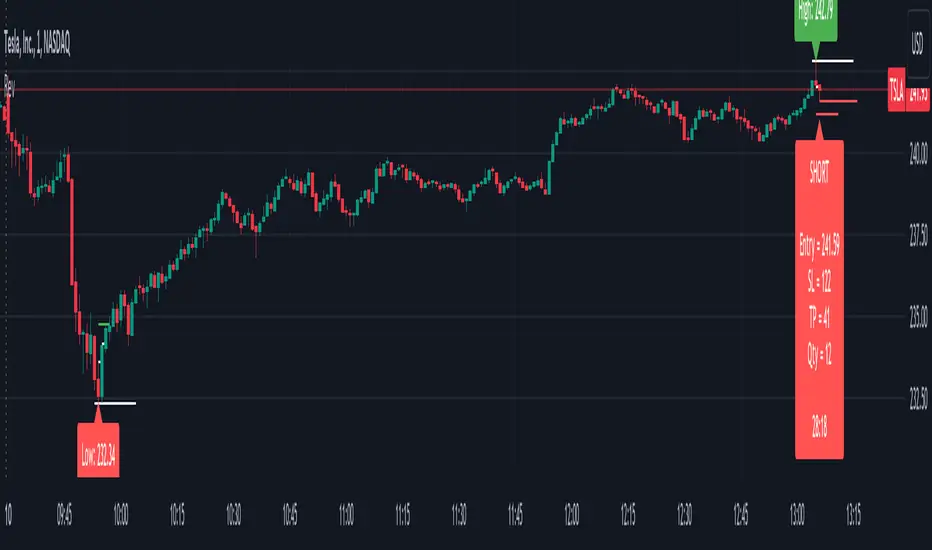
Intraday ReversalReversal Indicator
This Reversal Indicator is designed to capture high-probability reversal trades by analyzing price action at the day’s high or low. It identifies key levels, confirms breaks, and provides clear trade entry parameters based on trader margin, offering a simple yet effective approach for managing risk and potential profit. Best timeframe for trading is 1m.
Key Features:
1. Marks the Day's High and Low Candle:
- Automatically identifies and marks the high and low of the current trading day, acting as potential reversal zones.
2. Entry Trigger:
- A trade signal is generated when the price breaks below the high/low candle.
3. Trade Entry Parameters Display:
- Before the trade entry, the indicator presents a trade entry label on the chart, displaying essential information such as Stop Loss, Take Profit, and Shares Quantity, calculated according to the trader's available margin.
4. Stop Loss:
- The Stop Loss is automatically set a specified number of ticks above the day's high (for shorts) or below the day's low (for longs), ensuring tight risk management.
5. Take Profit:
- The Take Profit level is calculated as a percentage of the Stop Loss distance, providing proportional reward-to-risk ratios based on customizable preferences.
6. Visual Take Profit Line:
- Once a trade is entered, the indicator draws a visible Take Profit line on the chart. This line is initially red, signaling an active trade. If the market hits the Take Profit target, the line turns green, indicating a successful exit.
7. Setup Reset:
- The indicator resets itself with new high / low of the day
This Reversal Indicator simplifies trade execution by automating key decisions, allowing traders to focus on managing the trade rather than constantly monitoring price action. Perfect for traders looking to capitalize on daily reversal patterns with clear risk/reward parameters.
Liquidity Grab ReversalIndicator looks for liquidity grab & reversal trades on any timeframe. These types of trades reveal how the big institutions, banks and hedge funds trade with big money. If they want their very big positions to be filled they need to find areas in chart where the majority of the money is sitting. Where is it? Where is the majority of orders placed? Right below supports or right above resistances, these orders are stoplosses or stop orders. So they need to push the price to these areas, take all the available stoplosses and trigger all the available stop orders in order to fill their positions and then push the price to the opposite side to make profit (and retail to lose).
Indicator looks for support or resistance (S/R) areas which are represented by dotted lines. This S/R areas are created by minimum of 2 pivot high/low (H/L). Every pivot H/L that creates the S/R area is marked with diamond label. This S/R area is called liquidity. After liquidity is created, indicator looks for liquidity grab (mostly represented by fast spike to this area) and then price should go fast to the opposite side. This behaviour can be called reversal after liquidity grab. If we want to participate in the reversal we can put stop order at high of the candle that grabbed the support/liquidity if it is long liquidity grab or at low of the candle that grabbed the resistance/liquidity if it is short liquidity grab. These entry points are represented by solid lines. Stoplosses can be placed to the local maximum/minimum created after liquidity grab - so if entry is at high of the liquidity grab candle then stoploss can be put at low of the structure created after liquidity grab.
In settings of the indicator you can set whether only long or only short liquidity grabs are shown. Long liquidity grabs are green and short ones are red.
You can adjust core settings of the indicator:
Liquidity H/Ls Look Back/Forward Period: For PIVOT HIGH there has to be X (by default 1) candle/s lower to the left and X (by default 1) candle/s lower to the right and vice versa for PIVOT LOW,
Liquidity Grab by Close or High/Low.

K's Reversal Indicator IK's reversal indicator I is a special combination between Bollinger bands and the MACD oscillator. It is a contrarian indicator that depends on the following conditions:
• A buy signal is generated whenever the current market price is below the 100-period lower Bollinger band while simultaneously, the MACD value must be above its signal line. At the same time, the previous MACD value must be below its previous signal line.
• A sell (short) signal is generated whenever the current market price is above the 100-period upper Bollinger band while simultaneously, the MACD value must be below its signal line. At the same time, the previous MACD value must be above its previous signal line.
The way to use K's reversal indicator is to combine it with your already long/short bias in a sideways/range market in order to maximize the probability of success.
Limitations of the indicator include the following:
• There are no clear exit rules that work well on average across the markets. Even though K’s reversal indicator gives contrarian signals, it does not show when to exit the positions.
• As with other indicators, it underperforms on some markets and is not to be used everywhere.
• False signals tend to occur during trending markets but there is no proven way to detect a false signal.

Naked Bar Upward ReversalAMEX:SPY
The Naked Bar Upward Reversal is a three bar candlestick pattern with an inside candle as a entry point. This pattern is bullish since it has a candle closing red from the previous candle; the most bearish pattern possible. The following inside candle is a reversal of its previous candle with an open above the previous candle's close. Look to buy the next open above the inside candle's close.
This is a bullish reversal pattern and should be used in this context. Successful entries are found in corrections along an upward trend, or buying into a dip. Performance drops when the pattern appears at tops. To improve profitability, use a cluster of evidence to enhance the performance of this pattern. The intended time frame is within the daily and weekly.

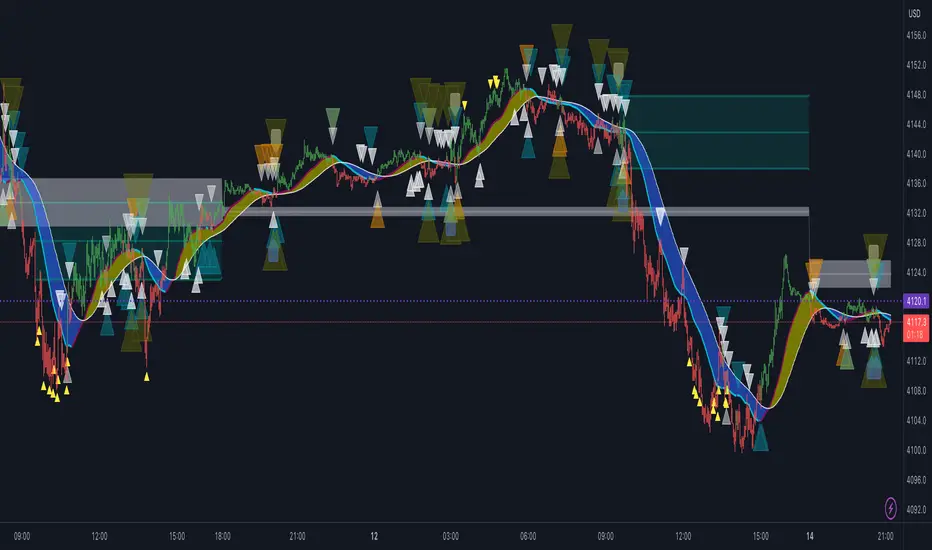
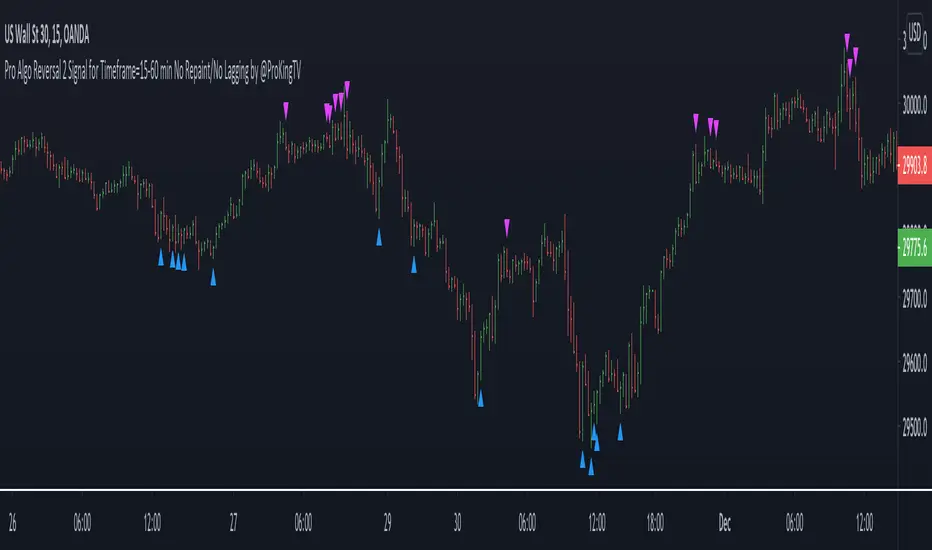
Pro Algo Reversal 2 Signal No Repaint/No Lagging by @ProKingTVThis is a Reversal trading signal system (part 2) for any range markets. It’s better used with timeframe from 15 min to 60 min for day trading or swing trading. It generates reversal signals for the important turning point bars and candles with no repaint and no lagging.
Part 2 internal R/S setting is different from part 1. Use this script with part 1.
How does it work?
* Defines support/resistance (S/R) levels based on floor trader’s pivot points and my own S/R levels.
* Calculates the reversal signals, price reactions close to all above S/R levels.
* Generates reversal trading signal: buy/long or sell/short based on all combined factors.
What are the Reversal signals?
* Blue arrow means trend is reversed to bullish
* Pink arrow means trend is reversed to bearish
How to use?
* Blue up arrow : Buy(Long) or continuous Buy(Long)
* Pink down arrow : Sell(Short) or continuous Sell(Short)
* Have to increase time frame to reduce signal noises, prefer 15-60 min.
* There is no way to filter all noises even with higher time frame, all the trades must have a stop.
How to access?
* PM me to obtain access
* 10 day Free Trial is available
Pro Algo Reversal 1 Signal No Repaint/No Lagging
This is a Reversal trading signal system (part 1) for any range markets. It’s better used with timeframe from 15 min to 60 min for day trading or swing trading. It generates reversal signals for the important turning point bars and candles with no repaint and no lagging.
How does it work?
* Defines support/resistance(S/R) levels based on floor trader’s pivot points and my own S/R levels.
* Calculates the reversal signals, price reactions close to all above S/R levels.
* Generates reversal trading signal: buy/long or sell/short based on all combined factors.
What are the Reversal signals?
* Blue arrow means trend is reversed to bullish
* Pink arrow means trend is reversed to bearish
How to use?
* Blue up arrow : Buy(Long) or continuous Buy(Long)
* Pink down arrow : Sell(Short) or continuous Sell(Short)
* Have to increase time frame to reduce signal noises, prefer 15-60 min.
* There is no way to filter all noises even with higher time frame, all the trades must have a stop.
How to access?
* PM me to obtain access
* 10 day Free Trial is available