Advanced Trend finder by S B PrasadAdvanced Trend finder – by S B Prasad
A Professional Multi-Engine Trend, Breakout & Scalping System
Advanced Trend Navigator is a powerful all-in-one trading indicator that fuses smart EMA trend detection, adaptive multi-filters, ribbon trend analysis, automatic trend channels, divergence detection, and built-in SL/Target projection into a single, visually intuitive system.
It is engineered for both scalpers and swing traders, with special optimization for 1-minute and 5-minute charts, while remaining highly reliable on higher timeframes.
🔹 What Makes This Indicator Unique?
Unlike single-logic indicators, Advanced Trend Navigator uses a dual-engine + structure-based approach:
EMA Smart Signal Engine → detects trend, reversals, and momentum shifts
Ribbon + Trend Channel Engine → confirms structure, breakouts, and continuation
Adaptive Filters + Divergence → remove noise and boost confidence
Risk Engine (SL/TP) → projects structured trade exits
This confluence-based design dramatically reduces false signals.
🔹 Core Features
1️⃣ Smart EMA Trend Engine
Dual EMA crossover system (Fast & Slow)
Automatic optimization for 1-minute timeframe
Detects:
Trend direction
Trend reversals
Momentum shifts
2️⃣ Multi-Layer Signal Filters
Signals are validated using a powerful adaptive filter stack:
Volume Filter (above-average volume confirmation)
RSI Filter with dynamic buy/sell thresholds
Bollinger Bands (overbought / oversold zones)
Momentum Filter (ROC-based strength detection)
Volatility Adaptation (ATR-based regime detection)
These filters dramatically reduce noise and false entries.
3️⃣ RSI Divergence Detection (1-Minute Optimized)
Bullish and bearish divergence detection
Automatic confidence boost when divergence appears
Helps identify early reversals and exhaustion zones
4️⃣ Enhanced Signal Logic
Signals are generated using a confluence of:
EMA crossovers
Candle direction
Volume + RSI + BB + Momentum
Divergence + trend-change logic
Separate logic is used for:
1-minute scalping
Higher-timeframe trend trading
5️⃣ Ribbon Trend System (CoraWave + LazyLine)
Advanced smoothed ribbon using:
CoraWave (fast line)
LazyLine (slow line)
Dynamic color-changing trend visualization
Ribbon fill highlights:
Strong bullish zones
Strong bearish zones
Neutral / transition phases
6️⃣ Automatic Trend Channel
Pivot-based dynamic trend channels
ATR-adjusted channel width
Auto-extended support & resistance structure
Visual map of evolving trend direction
7️⃣ Buy / Sell Breakout Signals (No-Spam Logic)
Signals only when:
Ribbon trend agrees
Price breaks channel boundaries
Built-in cooldown filter to prevent over-trading
Separate engine from EMA signals for dual confirmation
8️⃣ Built-In SL / Target Projection
Automatic Stop-Loss based on channel boundary
Risk-based Target 1 and Target 2 (R-multiples)
Dynamic plotting of:
SL line
Target 1 line
Target 2 line
9️⃣ Smart Time & Profit Projection
ATR-based time-to-move estimation
Dynamic profit potential estimation
Displays:
Expected move duration (minutes)
Approximate profit projection
🔟 Confidence Scoring System
Dynamic confidence % for each signal
Automatically increases when:
Divergence is detected
Bollinger extremes are triggered
🎨 Visual & Usability Features
Color-coded:
EMA lines
Ribbon trend
Trend channels
Background trend bias
Dynamic:
LONG / SHORT arrows
Signal labels with confidence + projection
Current trend status box
🔔 Alerts Included
EMA-based LONG / SHORT alerts
Ribbon fast/slow trend change alerts
Channel breakout BUY / SELL alerts
Alert messages include:
Symbol
Confidence %
Time projection
⚡ Recommended Presets
🟢 1-Minute Scalping
Fast EMA: 3 | Slow EMA: 8
Volume Filter: ON (1.1)
RSI: ON
Bollinger Bands: ON
Momentum: ON
Volatility Adaptation: ON
Ribbon: 10 / 3 / 15
Channel: Pivot 5 | ATR 14 | Width 1.5
Cooldown: 20
Targets: 1R & 2R
🔵 5-Minute Scalping (Author Preset)
Fast EMA: 5 | Slow EMA: 13
Volume Filter: ON (1.2)
RSI: OFF
Bollinger Bands: ON
Momentum: OFF
Volatility Adaptation: OFF
Ribbon: 12 / 3 / 18
Channel: Pivot 7 | ATR 14 | Width 1.7
Cooldown: 25
Targets: 1R & 2.5R
🟣 Swing Trading (15m–1H)
Fast EMA: 9 | Slow EMA: 21
Filters: All OFF
Ribbon: 15 / 5 / 25
Channel: Pivot 10 | ATR 14 | Width 2.0
Cooldown: 40
Targets: 1.5R & 3R
🎯 How to Trade This Indicator
BUY Setup:
Fast EMA > Slow EMA
Ribbon is green and rising
Price breaks above upper channel
Volume filter passes
Buy arrow appears
SELL Setup:
Fast EMA < Slow EMA
Ribbon is red and falling
Price breaks below lower channel
Volume filter passes
Sell arrow appears
❌ Avoid Trades When
Ribbon is flat or mixed colors
Channel is very narrow
Price is inside the channel
Volume filter fails
Market is extremely choppy
⚠️ Disclaimer
This indicator is a technical analysis tool, not financial advice.
Always use proper risk management and confirm signals with market context.
Past performance does not guarantee future results.
Cari dalam skrip untuk "roc"

Apex Wallet - Lorentzian Classification: Adaptive Signal SuiteOverview The Apex Wallet Lorentzian Classification is a high-performance signal engine that utilizes an adaptive multi-feature approach to identify high-probability entry points. It synthesizes five distinct technical features—RSI, CCI, ADX, MFI, and ROC—to calculate a weighted trend bias.
Dynamic Adaptation The core strength of this indicator is its ability to automatically recalibrate its internal periods based on your selected Trading Mode.
Scalping: Uses ultra-fast periods (e.g., RSI 7, ADX 10) for quick reaction on 1m to 5m charts.
Day-Trading: Balanced settings (e.g., RSI 14, ADX 14) optimized for 15m to 1h timeframes.
Swing-Trading: Smooth, long-term filters (e.g., RSI 21, ADX 20) to capture major market shifts.
Logic & Signal Flow
Feature Extraction: The script calculates five momentum and volatility features using the current close price.
Signal Summation: Each feature contributes to a global signal score based on established technical thresholds.
EMA Smoothing: The raw signal is processed through an EMA filter to eliminate market noise and false breakouts.
Execution: Clear BUY and SELL labels are printed directly on the chart when the smoothed score crosses specific conviction levels.
Key Features:
Zero-Configuration: No need to manually adjust lengths; simply pick your trading style.
Clean Visuals: High-fidelity labels (BUY/SELL) with integrated alert conditions for automation.
Prop-Firm Ready: Ideal for traders needing fast confirmation for high-conviction trades.

Delta Reaction Zones [BOSWaves]Delta Reaction Zones - Cumulative Delta-Based Supply and Demand Identification with Flow-Weighted Zone Construction
Overview
Delta Reaction Zones is a volume flow-aware supply and demand detection system that identifies price levels where significant buying or selling pressure accumulated, constructing adaptive zones around cumulative delta extremes with intelligent flow composition analysis.
Instead of relying on traditional price-based support and resistance or fixed pivot structures, zone placement, thickness, and directional characterization are determined through delta accumulation patterns, volatility-adaptive sizing, and the proportional composition of positive versus negative volume flow.
This creates dynamic reaction boundaries that reflect actual order flow imbalances rather than arbitrary price levels - contracting during low volatility environments, expanding during elevated volatility periods, and incorporating flow composition statistics to reveal whether zones formed under buying or selling dominance.
Price is therefore evaluated relative to zones anchored at delta extremes rather than conventional technical levels.
Conceptual Framework
Delta Reaction Zones is founded on the principle that meaningful support and resistance emerge where cumulative volume flow reaches local extremes rather than where price alone forms patterns.
Traditional support and resistance methods identify turning points through price structure, which often ignores the underlying order flow dynamics that drive those reversals. This framework replaces price-centric logic with delta-driven zone construction informed by actual buying and selling pressure.
Three core principles guide the design:
Zone placement should correspond to cumulative delta extremes, not price pivots alone.
Zone thickness must adapt to current market volatility conditions.
Flow composition context reveals whether zones formed under accumulation or distribution.
This shifts supply and demand analysis from static price levels into adaptive, flow-anchored reaction boundaries.
Theoretical Foundation
The indicator combines delta proxy methodology, cumulative volume tracking, adaptive volatility measurement, and flow decomposition analysis.
A signed volume delta proxy estimates directional order flow on each bar, which accumulates into a running cumulative delta series. Pivot detection identifies local extremes in either cumulative delta or its rate of change, marking levels where flow momentum reached inflection points. Average True Range (ATR) provides volatility-responsive zone sizing, while impulse window analysis decomposes recent flow into positive and negative components with percentage weighting.
Four internal systems operate in tandem:
Delta Accumulation Engine : Computes smoothed signed volume and maintains cumulative delta tracking for directional flow measurement.
Pivot Detection System : Identifies significant turning points in cumulative delta or delta rate of change to anchor zone placement.
Adaptive Zone Construction : Scales zone thickness dynamically using ATR-based volatility measurement around pivot anchors.
Flow Composition Analysis : Calculates positive and negative flow percentages over a configurable impulse window to characterize zone formation context.
This design allows zones to reflect actual order flow behavior rather than reacting mechanically to price formations.
How It Works
Delta Reaction Zones evaluates price through a sequence of flow-aware processes:
Signed Volume Delta Calculation : Each bar's volume is directionally signed based on close-open relationship, creating a proxy for buying versus selling pressure.
Cumulative Delta Tracking : Signed volume accumulates into a running total, revealing sustained directional flow over time.
Pivot Identification : Local highs and lows in cumulative delta (or its rate of change) mark significant flow inflection points where zones anchor.
Volatility-Adaptive Sizing : ATR multiplier determines zone half-width, automatically adjusting thickness to current market conditions.
Flow Decomposition : Positive and negative volume components are separated and percentage-weighted over the impulse window to reveal dominant flow direction.
Intelligent Zone Merging : Overlapping zones of the same type automatically merge into broader reaction areas, with flow statistics blended proportionally.
Dynamic Extension and Visualization : Zones extend forward with gradient-filled composition segments showing buy versus sell flow proportions.
Breach Detection and Cleanup : Zones invalidate automatically when price closes beyond their boundaries, maintaining chart clarity.
Together, these elements form a continuously updating supply and demand framework anchored in order flow reality.
Interpretation
Delta Reaction Zones should be interpreted as flow-anchored supply and demand boundaries:
Support Zones (Green) : Form at cumulative delta lows, marking levels where selling exhaustion or buying accumulation occurred.
Resistance Zones (Red) : Establish at cumulative delta highs, identifying areas where buying exhaustion or selling distribution dominated.
Flow Composition Segments : Visual gradient within each zone reveals the buy/sell flow proportion during zone formation. The upper segment (red tint) represents negative (selling) flow percentage while the lower segment (green tint) represents positive (buying) flow percentage.
BUY FLOW / SELL FLOW / MIXED Labels : Indicate dominant flow character when one direction exceeds 60% of total impulse window activity.
Net Delta Statistics : Display cumulative flow totals (Δ) alongside percentage breakdowns for immediate context.
Zone Thickness : Reflects current volatility environment - wider zones in volatile conditions, tighter zones in calm markets.
Zone Merging : Multiple nearby pivots consolidate into broader reaction areas, weighted by their respective flow magnitudes.
Flow composition, volatility context, and delta magnitude outweigh isolated price reactions.
Signal Logic & Visual Cues
Delta Reaction Zones presents two primary interaction signals:
Support Reclaim (RC) : Green label appears when price crosses back above a support zone's midline after trading below it, suggesting renewed buying interest.
Resistance Re-enter (RE) : Red label displays when price crosses back below a resistance zone's midline after trading above it, indicating resumed selling pressure.
Alert generation covers zone creation and midline reclaim/re-entry events for systematic monitoring.
Strategy Integration
Delta Reaction Zones fits within order flow-informed and supply/demand trading approaches:
Flow-Anchored Entry Zones : Use zones as high-probability reaction areas where historical order flow imbalances occurred.
Composition-Based Bias : Favor trades aligning with dominant flow character - long setups near zones formed under buying dominance, short setups near selling-dominated zones.
Volatility-Aware Targeting : Expect wider reaction ranges when ATR expands zones, tighter ranges when ATR contracts them.
Merge-Informed Conviction : Broader merged zones represent multiple flow inflection points, potentially offering stronger support/resistance.
Midline Reclaim Validation : Use RC/RE signals as confirmation of zone respect rather than standalone entry triggers.
Multi-Timeframe Flow Context : Apply higher-timeframe delta zones to inform lower-timeframe entry precision.
Technical Implementation Details
Core Engine : Signed volume delta proxy with EMA smoothing
Accumulation Model : Persistent cumulative delta tracking with optional rate-of-change pivot detection
Zone Construction : ATR-scaled thickness around pivot anchors
Flow Analysis : Positive/negative decomposition over configurable impulse window
Visualization : Gradient-filled zones with embedded flow statistics and percentage segments
Signal Logic : Midline crossover detection with breach-based invalidation
Merge System : Proximity-based consolidation with weighted flow blending
Performance Profile : Optimized for real-time execution with configurable zone limits
Optimal Application Parameters
Timeframe Guidance:
1 - 5 min : Micro-structure flow zones for scalping and short-term reversals
15 - 60 min : Intraday supply/demand identification with flow context
4H - Daily : Swing-level reaction zones with macro flow characterization
Suggested Baseline Configuration:
Delta Smoothing Length : 3
Pivot Length : 12
Pivot Source : Cumulative Delta
Impulse Window : 100
ATR Length : 14
ATR Multiplier : 0.35 (reduce for lower timeframes)
Maximum Zones : 8
Merge Overlapping Zones : Enabled
Merge Gap : 20 ticks
These suggested parameters should be used as a baseline; their effectiveness depends on the asset's volume profile, tick structure, and preferred zone density, so fine-tuning is expected for optimal performance.
Parameter Calibration Notes
Use the following adjustments to refine behavior without altering the core logic:
Zones appearing oversized : Reduce ATR Multiplier to tighten zone thickness, especially on lower timeframes.
Excessive zone clutter : Increase Pivot Length to demand stronger delta extremes before zone creation.
Unstable delta readings : Increase Delta Smoothing Length to reduce bar-to-bar noise in flow calculation.
Missing significant levels : Decrease Pivot Length or switch Pivot Source to "Cumulative Delta RoC" for flow acceleration sensitivity.
Flow percentages feel stale : Reduce Impulse Window Length to emphasize more recent buying/selling composition.
Too many merged zones : Decrease Merge Gap (ticks) or disable merging to preserve individual pivot zones.
Adjustments should be incremental and evaluated across multiple session types rather than isolated market conditions.
Performance Characteristics
High Effectiveness:
Markets with consistent volume and order flow characteristics
Instruments where delta proxy correlates well with actual tape reading
Mean-reversion strategies targeting flow exhaustion zones
Trend continuation entries at zones aligned with dominant flow direction
Reduced Effectiveness:
Extremely low volume environments where delta proxy becomes unreliable
News-driven or gapped markets with discontinuous flow
Highly manipulated or illiquid instruments with erratic volume patterns
Integration Guidelines
Confluence : Combine with BOSWaves structure, market profile, or traditional supply/demand analysis
Flow Respect : Trust zones formed with strong net delta magnitude and clear flow dominance
Context Awareness : Consider whether current market regime matches zone formation conditions
Merge Recognition : Treat merged zones as higher-conviction areas due to multiple flow inflections
Breach Discipline : Exit zone-based setups cleanly when price invalidates boundaries
Disclaimer
Delta Reaction Zones is a professional-grade order flow and supply/demand analysis tool. It uses a volume-based delta proxy that estimates directional pressure but does not access true order book data. Results depend on market conditions, volume reliability, parameter selection, and disciplined execution. BOSWaves recommends deploying this indicator within a broader analytical framework that incorporates price structure, volatility context, and comprehensive risk management.

BTC - Cycle Integrity Index (CII) BTC - Cycle Integrity Index (CII) | RM
Are we following a calendar or a capital flow? Is the Halving still the heartbeat of Bitcoin, or has the institutional "Engine" taken over?
The most polarized debate in the digital asset space today centers on a single question: Is the 4-year Halving Cycle dead? While some market participants wait for a pre-ordained calendar countdown, the reality of 2026 suggests that visual guesswork is no longer sufficient. As institutional gravity takes hold, we cannot rely on the simple "Clock" of the past. Instead, we must audit the Integrity of the present.
The Cycle Integrity Index (CII) was engineered to move beyond simple price action and provide a clinical answer to the market's biggest mystery: "Is this trend supported by structural substance, or is it merely speculative foam?" By aggregating eight diverse Pillars into a single 0-100% score, this model uses Gaussian Distributions and Sigmoid Normalization to distinguish between professional accumulation and retail-driven chaos. We aren't guessing where we are in a cycle; we are measuring the internal health of the asset's engine in real-time.
Why these 8 Pillars?
The CII does not rely on a single indicator because the "New Era" of Bitcoin is multi-dimensional. To capture the full picture, I selected eight specific pillars that cover the three layers of market truth:
• The Capital Layer: Global Liquidity (M2) and ETF Flows (Wall Street Absorption).
• The Network Layer: Mining Difficulty and Security Backbone expansion.
• The Sentiment Layer: Long-Term Holder conviction, Valuation Heat (MVRV), and Corporate Adoption (MSTR). While alternatives like the Pi Cycle or RSI exist, they are often "one-dimensional." The CII is a synthesis—a modular engine where every part validates the others.
How the Calculation Works
The CII is a sophisticated model for Bitcoin. It aggregates 8 diverse pillars into a single 0-100% score in the following way:
• Mathematical Normalization: We don't just use raw prices. We use Gaussian Distributions to find "Institutional DNA" in drawdowns and Sigmoid (S-Curve) functions to score volatility and valuation.
• Dynamic Weighting: The index is modular. If a data source (like a specific on-chain metric) is toggled off, the engine automatically redistributes the weight among the active sensors so the final integrity score is always balanced to 100%.
• Multi-Source Integration: The script pulls from Global Liquidity (M2), ETF flows, Corporate Treasury premiums (MSTR), and Network Difficulty to create a truly "Full-Stack" view of the asset.
The 8 Pillars of Integrity
Pillar 1: Drawdown DNA The "Identity Crisis" Filter
• Concept: Audits the depth of corrections to distinguish between "Institutional Floors" and "Retail Panics."
• Logic: Historically, retail crashes reached -80%, while institutions view -20% to -25% as primary value entries.
• Implementation: Uses a Gaussian (Normal) Distribution centered at -25%. Scores of 10/10 are awarded for holding institutional targets; scores decay as drawdowns accelerate toward legacy "crash" levels.
Basis: DNA Drawdown
Pillar 2: Volatility Regime The "Smoothness" Audit
• Concept: Measures the "vibration" of the trend. High-integrity moves are characterized by "smooth" price action.
• Logic: Erratic volatility signals speculative bubbles; consistent "volatility clusters" indicate professional trend-following.
• Implementation: Calculates a Z-Score of the 14-day ATR against a 100-day benchmark. This is passed through a Sigmoid function to penalize "chaotic" price shocks while rewarding stability.
Basis: RVPM
Pillar 3: Liquidity Sync (Global M2) The Macro Heartbeat
• Concept: Audits whether price growth is fueled by monetary expansion or internal speculative leverage.
• Logic: True cycle integrity requires a positive correlation between Central Bank balance sheets and price action.
• Implementation: Aggregates a custom Global Liquidity Proxy (Fed, RRP, TGA, PBoC, ECB, BoJ). It measures the Pearson Correlation between BTC and M2 with a standardized 80-day transmission lag.
Basis: Liquisync
Pillar 4: ETF Absorption (Wall Street Entry) The "Cost Basis" Defense
• Concept: Tracks the aggregate institutional cost-basis since the January 2024 Spot ETF launch.
• Logic: Integrity is high when the "Wall Street Floor" is defended; it fails when the aggregate position is underwater.
• Implementation: A Cumulative VWAP engine tracking the "Big 3" (IBIT, FBTC, BITB). Scoring decays based on the percentage distance the price drifts below this institutional average entry.
Basis: Institutional Cost Corridor
Note: Turning this to OFF will significantly expand the timeframe of the indicator on the chart (otherwise it will just start in 2024)
Pillar 5: LTH Dormancy (Conviction) The HODL Floor Audit
• Concept: Monitors the conviction of Long-Term Holders (LTH) to identify supply-side constraints.
• Logic: Sustainable cycles require stable or increasing 1Y+ dormant supply; rapid "thawing" signals distribution.
• Implementation: Uses Min-Max Normalization on the Active 1Y Supply over a 252-day window. A score of 10/10 indicates peak annual holding conviction.
Basis: RHODL Proxy & VDD Multiple
Pillar 6: Valuation Intensity The MVRV Heat Map
• Concept: Measures market "overheat" by comparing Market Value to Realized Value.
• Logic: High integrity trends rise steadily; vertical spikes in MVRV indicate "speculative foam" and bubble risk.
• Implementation: Performs a Relative Rank Analysis of the MVRV Ratio over a 730-day window, passed through a high-steepness Sigmoid curve to identify extreme valuation anomalies.
Pillar 7: Miner Stress The Security Backbone
• Concept: Tracks Mining Difficulty to ensure network infrastructure is expanding alongside price.
• Logic: Difficulty expansion signals health; drops in difficulty (Miner Stress) signal capitulation and sell-side pressure.
• Implementation: Monitors the 30-day Rate of Change (ROC) of Global Mining Difficulty. Maintains a 10/10 score during expansion; decays rapidly during network contraction.
Pillar 8: Corporate Adoption The MSTR NAV Proxy
• Concept: Audits the MicroStrategy (MSTR) premium as a barometer for institutional demand.
• Logic: A high premium indicates a willingness to pay a "convenience fee" for BTC exposure; a collapsing premium signals waning appetite.
• Implementation: Calculates the Adjusted Enterprise Value (Market Cap + Debt - Cash) relative to the Net Asset Value (NAV) of its BTC holdings.
Note1: Debt and share parameters are user-adjustable to maintain accuracy as corporate balance sheets evolve.
Note2: I just included this because I was curious about the mNAV calculation I saw in other scripts, where the printed value often does not match exactly the propagated value from the MSTR page itself. Hence, for my live calculation, we calculate the Adjusted Enterprise Value to find the "Market NAV" (mNAV). Unlike simpler scripts that only look at Market Cap vs. Bitcoin holdings, our engine accounts for the Capital Structure . We explicitly factor in the corporate debt (approx. $8.24B long-term + $7.95B convertible notes) and subtract the cash reserves (approx. $2.18B) to find the true cost Wall Street is paying for the underlying Bitcoin. Since this will ran "old" very quickly, I recommend to update in the code by yourself from time to time, or just de-select this parameter.
Interpretation Guide
• Score 100% (The Perfect Storm): This represents a state of "Maximum Integrity." All 8 pillars are in perfect institutional alignment—liquidity is surging, conviction is at yearly highs, and price action is perfectly smooth. This is the hallmark of a healthy, structural parabolic run.
• 75% - 100% (High Integrity): Robust trend. Price is supported by structural demand and macro tailwinds.
• 35% - 75% (Equilibrium): Transition zone. The market is digesting gains or waiting for a new liquidity pulse.
• 0% - 35% (Fragile): Speculative foam. Structural support has failed.
• Score 0% (The Ghost Trend): Absolute structural failure. All pillars (liquidity, miners, LTH, ETFs) have broken down. Note: Due to the robust nature of the Bitcoin network, the index naturally floors around 20-30% during deep bear markets, as specific pillars (like Miner Security) rarely drop to zero.
To provide a complete experience, I have included the Cycle Triad —a visualization layer consisting of the Halving, Ideal Peak, and Ideal Low. It is important to understand the role of this feature:
• Benchmark Only (Not Calculated): The Triad is based purely on historical evidence from previous Bitcoin epochs. While the Halving is fixed anyway, the "Ideal Peak" or "Ideal Low" are not calculated or computed by the 8 pillars. These are user-adjustable temporal anchors drawn on the chart to provide a static map of the "Legacy 4-Year Cycle."
• The Temporal Audit: The power of the CII lies in comparing the Engine (the 8 Pillars) against the Clock (the Triad) . By overlaying historical time-windows on top of our integrity math, we can see if the "New Era" is currently ahead of, behind, or perfectly in sync with the past.
• The "Peak Divergence" Logic: Based on the specific models selected for this ECU—specifically Volatility Decay and Valuation Heat —traders will notice that a cycle peak often coincides with a low integrity score (Red Zone) . While the index measures structural health, a low score is a byproduct of a market that has become "too hot to handle."
• Regime Detection: Although the primary goal is to audit the "New Era," the CII is highly effective at detecting overheated regimes. When the score drops toward the 25–35% range, the structural floor is giving way to speculative foam—making it a dual-purpose tool for both cycle analysis and risk management.
Dashboard Calibration & Settings
Cycle Triad Calibration
• Ideal Peak/Trough Window: Defines the historical "Average Days" from a Halving to the cycle top and bottom. This sets the vertical anchors for the Halving, Peak, and Low labels.
• Show Cycle Triad: A master toggle to enable or disable the temporal lines and labels on your dashboard.
The CII Master ECU is fully modular. You can toggle individual pillars ON/OFF to focus on specific market dimensions, and calibrate the sensitivity of each sensor to match your strategic bias.
• P1: Drawdown DNA Lookback (Weeks): Defines the window for the "Rolling High." Inst. Target (%): The specific percentage drawdown you define as "Institutional Support" (e.g., -25%).
• P2: Volatility Regime Benchmark (Days): The historical window used to define "Normal" vs. "Abnormal" volatility.
• P3: Liquidity Sync Corr. Window (Bars): The lookback for the Pearson Correlation calculation. Transmission Lag (Bars): The delay (standard 80 days) for Central Bank M2 to hit price.
• P4: ETF Absorption FBTC Ticker: The data source for the ETF volume audit (Default: CBOE:FBTC).
• P5: LTH Dormancy LTH Source: The ticker for 1Y+ Active Supply (Default: GLASSNODE:BTC_ACTIVE1Y). Norm. Window: The lookback (252 days) used to rank current conviction.
• P6: Valuation Intensity MVRV Source: The ticker for the MVRV Ratio (Default: INTOTHEBLOCK:BTC_MVRV). Relative Window: The lookback (730 days) to calculate the valuation rank.
• P7: Miner Stress Mining Diff: The data source for Global Mining Difficulty (Default: QUANDL:BCHAIN/DIFF).
• P8: Corporate Adoption Shares (M) & BTC (K): The balance sheet parameters for MicroStrategy (MSTR). Update these as the company executes new purchases to maintain mNAV accuracy.
Operational Usage This index is best used on the Daily (D) (recommended - description for inputs optimized for this time-window) or Weekly (W) timeframes. While the code is optimized to fetch daily data regardless of your chart setting, the structural "Integrity" of a cycle is a macro phenomenon and should be viewed with a medium-to-long-term lens.
The Verdict: Is the 4-Year Cycle Still Alive?
Based on the data provided by the CII Master ECU, the answer remains a nuanced "Work in Progress." The evidence presents a fascinating conflict between legacy patterns and the new institutional regime:
• The Case for the Cycle: Historically, a local "Peak" in price corresponds with a "Local Low" in our integrity indicator (Red Zone). We observed this exact phenomenon in October 2025. When viewed through the lens of the "Ideal Peak" anchor, this alignment suggests that the 4-year temporal rhythm is still exerts a massive influence on market behavior.
• The Case for the New Era: While the timing of the October 2025 peak followed the legacy script, the intensity did not. Previous cycle tops produced far more aggressive and persistent "Red Zone" clusters. The relative brevity of the integrity breakdown suggests that the "Institutional Era" provides a much higher floor than the retail-driven bubbles of 2017 and 2021.
• The Institutional Floor: Our data shows that while "Tops" still resemble the 4-year cycle, the "Lows" now reflect a regime of constant institutional absorption. This suggests that the brutal 80% drawdowns of the past may be replaced by the "Institutional DNA" of Pillar 1.
Final Outlook: As we move through 2026, the ultimate test lies in the Q3/Q4 window. While classical theory demands a "Cycle Low" during this period, the CII will be our primary auditor. We cannot definitively say the cycle is dead, but we can say it has evolved. We will not know if the 4-year low will manifest until the model either flags a total structural breakdown or confirms that the institutional "Floor" has permanently shifted the rhythm of the asset.
Tags: Bitcoin, Institutional, Macro, On-chain, Liquidity, MSTR, ETF, Cycle
Note to Moderators: This script is a "Master Index" that aggregates several quantitative models I have previously published on this platform (including DNA Drawdown, RVPM, and Liquisync). I am the original author of the logic and source code referenced in the "Basis" sections of the description.

AIO Oscillator SuiteOverview
The AIO Oscillator Suite is a comprehensive, all-in-one technical analysis tool designed to declutter your chart and streamline your workflow. Instead of constantly adding, removing, and re-configuring different oscillators, this script allows you to switch between 30+ of the most popular and effective momentum, trend, and volatility indicators from a single dropdown menu.
Whether you are a trend follower, a mean-reversion trader, or a volatility analyst, this suite provides instant access to the tools you need without consuming multiple indicator slots on your chart.
Features & Included Indicators
This suite includes a vast array of oscillators, meticulously coded to match standard calculations. You can instantly toggle between:
Momentum & Trend : RSI, Stochastic, Stoch RSI, MACD, PPO, TSI, Williams %R, Momentum (ROC), Ultimate Oscillator, CMO, Connors RSI.
Volatility : ATR, Bollinger %b, Choppiness Index.
Volume-Based : Money Flow Index (MFI), Chaikin Money Flow (CMF), Chaikin Oscillator, Force Index, Ease of Movement (EOM), OBV Oscillator, ADX/DMI.
Advanced/Specialized : TRIX, KST, Aroon, Fisher Transform, Cyber Cycle, Vortex, Balance of Power (BOP), Relative Vigor Index (RVI), Detrended Price Oscillator (DPO).
How It Works
Dynamic Plotting: The script intelligently adjusts the plotting style based on your selection. It automatically renders upper/lower bands (e.g., 70/30 for RSI), midlines (0 lines for MACD), histograms, or signal lines depending on the specific requirements of the chosen indicator.
Clean Interface: To keep your chart pristine, all input parameters (lengths, sources, smoothing factors) are hidden from the status line. You only see the current value of the indicator, ensuring a distraction-free analysis environment.
Customization: Every indicator retains its full set of customizable settings. You can tweak lengths, smoothing types (RMA, SMA, EMA, WMA), and sources within the settings menu.
Level Overrides: By default, the script uses standard levels for each indicator (e.g., 70/30 for RSI, 100/-100 for CCI). However, you can enable the "Override Default Levels" option in the settings to manually define your own Upper, Lower, and Midline values for any indicator.
How to Use
Add the indicator to your chart.
Open the Settings menu.
Under the "Main Settings" group, use the dropdown menu to select your desired indicator (default is RSI).
Adjust the specific parameters for that indicator in the sections below if necessary.
(Optional) To set custom overbought/oversold levels, check the "Override Default Levels?" box and enter your preferred values.
Benefits for Traders
Efficiency: Save time by not having to search for and load different scripts for every analysis technique.
Space Saving: TradingView limits the number of indicators per chart based on your plan. This script counts as only one indicator but functions as thirty.
Comparative Analysis: Quickly cycle through different oscillators to confirm signals. For example, if you see a divergence on RSI, you can instantly check if the same divergence exists on the Stochastic or TSI without leaving the screen.
Disclaimer
This tool is for informational and educational purposes only. It does not constitute financial advice or a recommendation to trade. Technical indicators should be used as part of a comprehensive trading strategy. Past performance is not indicative of future results. Always practice proper risk management.
Open Source
The code is published as open-source to allow the community to verify calculations, learn from the logic, and customize it further if needed.

Momentum Echo Oscillator [Community Edition]Concept: The Momentum Echo Oscillator (MEO) is a modern take on classical momentum oscillators. Most indicators only look at the "now". MEO introduces the concept of Momentum Echoes—historical momentum harmonics that are weighted and blended back into the current price velocity.
Why use MEO? Standard momentum tools (like ROC or RSI) can be very "jittery" or noisy. By integrating historical echoes, MEO provides a smoother, more rhythmic representation of price flow, making it easier to spot genuine trend reversals.
Key Elements:
Primary Momentum: The immediate speed of price.
Echo Harmonics: Two adjustable lookback points that act as a "memory" for the indicator, filtering out false breakouts.
Dynamic Histogram: Visualizes the gap between the Echo Engine and the Trigger Line, highlighting acceleration and deceleration.
Settings:
Echo Weight: Adjust how much "memory" you want the indicator to have.
Smoothing: Clean up the signals for higher timeframes.
This is an open-source tool for the TradingView community. Enjoy!

Reversal Strength with Momentum Ratings on 4hr charts Here's a quick breakdown of what you'll see on your chart and how to actually use the indicator!
Reversal Labels:
↑ = Bullish reversal (price reversing upward)
↓ = Bearish reversal (price reversing downward)
STRONG (bright green/red) = High-confidence reversal (score > 65)
weak (faded green/red) = Low-confidence reversal (score ≤ 65)
Number on label = Reversal strength score (0-100)
Momentum Table (Top Right):
Overall Score (0-100) = Total momentum strength
Green (80+) = Very strong momentum
Yellow (40-60) = Moderate momentum
Orange/Red (<40) = Weak/stalling momentum
Individual Momentum Scores (each worth 0-20 points):
Volume = How much trading activity vs average
Price ROC = How fast price is moving (rate of change)
MA Spacing = How spread out the moving averages are (trend strength)
ADX = Directional movement indicator (trend conviction)
RSI Mom. = How far RSI is from neutral 50 (momentum extreme)
Status Indicators:
🔥 STRONG = Momentum > 70 (strong move happening)
📈 BUILDING = Momentum 50-70 (gaining strength)
⚠️ WEAK = Momentum 30-50 (losing steam)
💤 STALLING = Momentum < 30 (very weak/choppy)
Background Tint:
Light green background = Strong momentum (>70)
Light red background = Very weak momentum (<30)
The key is: look for STRONG reversal labels when momentum is building/strong for the best trade setups! Also this is mainly for the 4hr time frame.

Scalp Boost LONG✦ Overview
Scalp Boost LONG is a visual tool designed to highlight potential short-term upward impulses.
A signal is generated only when multiple market conditions align at the candle close, combining momentum dynamics, local probability shifts, and abnormal volume behavior.
The indicator does not repaint.
✦ Concept
The tool focuses on selective situations where the market shows signs of micro-breakout potential.
If all internal conditions are confirmed — a LONG event is displayed.
If not — the chart remains clean.
This builds a low-noise signal model, prioritizing quality over frequency.
✦ Signal Logic
The LONG signal requires confirmation of all core conditions:
• Local impulse dynamics
Identifies short-term acceleration suggesting a breakout from a compressed price structure.
• Probability beyond a statistical zone
Uses relative breakout probability instead of fixed levels, checking whether price exceeds expected local ranges.
• Abnormal volume activity
Highlights candles with monetary flow above a custom threshold, signaling increased market interest.
• Anti-overheat filter
Conditions avoiding exhausted or low-momentum phases where continuation is less likely.
Only when all filters are aligned a LONG marker appears.
✦ Visual Structure
The chart display is intentionally minimal:
• ROC Curve
Subdued line, showing short-term momentum without distraction.
• LONG Marker
Green triangle below the candle on confirmed events.
• Candle Highlight
Soft background highlight on the signal bar.
• Volume Marker
Small red dot at the bottom of candles with abnormal monetary flow.
All visual elements appear only on candle close.
✦ Alerts
A clean event structure is available for notifications:
LONG Signal
This allows receiving alerts during chart analysis or in automated workflows while keeping full control over decision-making.
✦ Notes & Guidelines
This tool:
is not a trading system,
does not provide targets or stops,
may trigger against the dominant trend,
should be combined with the user’s own methodology.
Signals are rare by design.
Do not interpret each event as a trend continuation — it highlights conditions, not outcomes.
✦ Suggested Use
-(Non-mandatory ideas for advanced users)
-identifying potential micro-breakouts,
-timing entries around volume spikes,
-adding context to scalping models,
-filtering impulsive moves from noise.
-suitable for a 5-minute timeframe
The indicator can be helpful as a confirmation layer, not a standalone decision tool.

Rate Of Change With HistogramCustomized standard ROC indicator to represent as Histogram instead of standard line

Dumb Money Flow - Retail Panic & FOMO# Dumb Money Flow (DMF) - Retail Panic & FOMO
## 🌊 Overview
**Dumb Money Flow (DMF)** is a powerful **contrarian indicator** designed to track the emotional state of the retail "herd." It identifies moments of extreme **Panic** (irrational selling) and **FOMO** (irrational buying) by analyzing on-chain data, volume anomalies, and price velocity.
In crypto markets, retail traders often buy the top (FOMO) and sell the bottom (Panic). This indicator helps you do the opposite: **Buy when the herd is fearful, and Sell when the herd is greedy.**
---
## 🧠 How It Works
The indicator combines multiple data points into a single **Sentiment Index** (0-100), normalized over a 90-day period to ensure it always uses the full range of the chart.
### 1. Panic Index (Bearish Sentiment)
Tracks signs of capitulation and fear. High values contribute to the **Panic Zone**.
* **Exchange Inflows:** Spikes in funds moving to exchanges (preparing to sell).
* **Volume Spikes:** High volume during price drops (panic selling).
* **Price Crash (ROC):** Rapid, emotional price drops over 3 days.
* **Volatility (ATR):** High market nervousness and instability.
### 2. FOMO Index (Bullish Sentiment)
Tracks signs of euphoria and greed. High values contribute to the **FOMO Zone**.
* **Exchange Outflows:** Funds moving to cold storage (HODLing/Greed).
* **Profitable Addresses:** When >90% of holders are in profit, tops often form.
* **Parabolic Rise:** Rapid, unsustainable price increases.
---
## 🎨 Visual Guide
The indicator uses a distinct color scheme to highlight extremes:
* **🟢 Dark Green Zone (> 80): Extreme FOMO**
* **Meaning:** The crowd is euphoric. Risk of a correction is high.
* **Action:** Consider taking profits or looking for short entries.
* **🔴 Dark Burgundy Zone (< 20): Extreme Panic**
* **Meaning:** The crowd is capitulating. Prices may be oversold.
* **Action:** Look for buying opportunities (catching the knife with confirmation).
* **🔵 Light Blue Line:**
* The smoothed moving average of the sentiment, helpful for seeing the trend direction.
---
## 🛠️ How to Use (Trading Strategies)
### 1. Contrarian Reversals (The Primary Strategy)
* **Buy Signal:** Wait for the line to drop deep into the **Burgundy Panic Zone (< 20)** and then start curling up. This indicates that the worst of the selling pressure is over.
* **Sell Signal:** Wait for the line to spike into the **Green FOMO Zone (> 80)** and then start curling down. This suggests buying exhaustion.
### 2. Divergences
* **Bullish Divergence:** Price makes a **Lower Low**, but the DMF Indicator makes a **Higher Low** (less panic on the second drop). This is a strong reversal signal.
* **Bearish Divergence:** Price makes a **Higher High**, but the DMF Indicator makes a **Lower High** (less FOMO/buying power on the second peak).
### 3. Trend Confirmation (Midline Cross)
* **Crossing 50 Up:** Sentiment is shifting from Fear to Greed (Bullish).
* **Crossing 50 Down:** Sentiment is shifting from Greed to Fear (Bearish).
---
## ⚙️ Settings
* **Data Source:** Defaults to `INTOTHEBLOCK` for on-chain data.
* **Crypto Asset:** Auto-detects BTC/ETH, but can be forced.
* **Normalization Period:** Default 90 days. Determines the "window" for defining what is considered "Extreme" relative to recent history.
* **Weights:** You can customize how much each factor (Volume, Inflows, Price) contributes to the index.
---
**Disclaimer:** This indicator is for educational purposes only. "Dumb Money" analysis is a probability tool, not a crystal ball. Always manage your risk.
**Indicator by:** @iCD_creator
**Version:** 1.0
**Pine Script™ Version:** 6
---
## Updates & Support
For questions, suggestions, or bug reports, please comment below or message the author.
**Like this indicator? Leave a 👍 and share your feedback!**

Super momentum DBSISuper momentum DBSI: The Ultimate Guide
1. What is this Indicator?
The Super momentum DBSI is a "Consensus Engine." Instead of relying on a single line (like an RSI) to tell you where the market is going, this tool calculates 33 distinct technical indicators simultaneously for every single candle.
It treats the market like a democracy. It asks 33 mathematical "voters" (Momentum, Trend, Volume, Volatility) if they are Bullish or Bearish.
If 30 out of 33 say "Buy," the score is high (Yellow), and the trend is extremely strong.
If only 15 say "Buy," the score is low (Teal), and the trend is weak or choppy.
2. Visual Guide: How to Read the Numbers
The Scores
Top Number (Bears): Represents Selling Pressure.
Bottom Number (Bulls): Represents Buying Pressure.
The Colors (The Traffic Lights)
The colors are your primary signal. They tell you who is currently winning the war.
🟡 YELLOW (Dominance):
This indicates the Winning Side.
If the Bottom Number is Yellow, Bulls are in control.
If the Top Number is Yellow, Bears are in control.
🔴 RED (Weakness):
This appears on the Top. It means Bears are present but losing.
🔵 TEAL (Weakness):
This appears on the Bottom. It means Bulls are present but losing.
3. Trading Strategy
Scenario A: The "Strong Buy" (Long Entry)
The Setup: You are looking for a shift in momentum where Buyers overwhelm Sellers.
Watch the Bottom Number: Wait for it to turn Yellow.
Confirm Strength: Ensure the score is above 15 and rising (e.g., 12 → 18 → 22).
Check the Top: The Top Number should be Red and low (below 10).
Trigger: Enter on the candle close.
Scenario B: The "Strong Sell" (Short Entry)
The Setup: You are looking for Sellers to crush the Buyers.
Watch the Top Number: Wait for it to turn Yellow.
Confirm Strength: Ensure the score is above 15 and rising.
Check the Bottom: The Bottom Number should be Teal and low.
Trigger: Enter on the candle close.
Scenario C: The "No Trade Zone" (Choppy Market)
The Setup: The market is confused.
Visual: Top is Red, Bottom is Teal.
Meaning: NOBODY IS WINNING. There is no Yellow number.
Action: Do not trade. This usually happens during lunch hours, weekends, or right before big news. This filter alone will save you from many false breakouts.
4. What is Inside? (The 33 Indicators)
To give you confidence in the signals, here is exactly what the script is checking:
Group 1: Momentum (Oscillators)
Detects if price is moving fast.
RSI (Relative Strength Index)
CCI (Commodity Channel Index)
Stochastic
Williams %R
Momentum
Rate of Change (ROC)
Ultimate Oscillator
Awesome Oscillator
True Strength Index (TSI)
Stoch RSI
TRIX
Chande Momentum Oscillator
Group 2: Trend Direction
Detects the general path of the market.
13. MACD
14. Parabolic SAR
15. SuperTrend
16. ALMA (Moving Average)
17. Aroon
18. ADX (Directional Movement)
19. Coppock Curve
20. Ichimoku Conversion Line
21. Hull Moving Average
Group 3: Price Action
Detects where price is relative to averages.
22. Price vs EMA 20
23. Price vs EMA 50
24. Price vs EMA 200
Group 4: Volume & Force
Detects if there is money behind the move.
25. Money Flow Index (MFI)
26. On Balance Volume (OBV)
27. Chaikin Money Flow (CMF)
28. VWAP (Intraday)
29. Elder Force Index
30. Ease of Movement
Group 5: Volatility
Detects if price is pushing the outer limits.
31. Bollinger Bands
32. Keltner Channels
33. Donchian Channels
5. Pro Tips for Success
Don't Catch Knives: If the Bear score (Top) is Yellow and 25+, do not try to buy the dip. Wait for the Yellow score to break.
Exit Early: If you are Long and the Yellow Bull score drops from 28 to 15 in one candle, TAKE PROFIT. The momentum has died.
Use Higher Timeframes: This indicator works best on 15m, 1H, and 4H charts. On the 1m chart, it may be too volatile.

KC-BB Squeeze Trend Trader█ OVERVIEW
The KC-BB Squeeze Trend Trader identifies volatility compression and expansion by detecting when Bollinger Bands contract inside Keltner Channels and then release with confirmed momentum. It highlights potential trend-starting breakouts by combining squeeze detection, directional momentum, trend bias, and optional volume filters.
During periods of low volatility, price consolidates and energy builds. When volatility expands again, strong directional moves often follow. This tool helps traders spot those opportunities early with clear visual cues and optional performance tracking.
█ KEY FEATURES
Squeeze detection using Bollinger Bands inside Keltner Channels
Automatic identification of volatility expansion after the squeeze ends
Optional filters for momentum, trend direction, volume, and signal cooldown
Dynamic color fills for squeeze, bullish expansion, bearish expansion, and neutral states
Dashboard showing squeeze duration, tightness, momentum, trend, and volume context
Optional win-rate analytics using ATR-based target and stop evaluation
Multi-timeframe confirmation for higher-quality breakouts
█ HOW IT WORKS
A squeeze occurs when both Bollinger Bands sit inside the Keltner Channels.
A breakout begins when the Bollinger Bands expand outside the KCs.
Long signals appear when squeeze release aligns with bullish momentum and trend strength.
Short signals appear when bearish momentum and trend conditions agree.
Volume and cooldown filters help reduce noise and avoid low-quality entries.
█ HOW TO USE
Wait for a squeeze period (yellow fill).
Monitor duration and tightness: longer/tighter squeezes often lead to stronger moves.
When a long or short signal appears, use the plotted ATR-based target and stop as reference levels.
Watch for contraction or exit hints when momentum fades or volatility narrows again.
Higher timeframes generally provide cleaner and more reliable signals.
█ TIMEFRAME GUIDANCE
Crypto: 4H or 1D; consider increasing KC multiplier for high volatility.
Forex: 1H–4H; longer squeeze duration can improve selectivity.
Stocks: 1D–1W; consider slightly higher BB multiplier on slow-moving markets.
█ SETTINGS SUMMARY
Adjustable Bollinger Band and Keltner Channel lengths and multipliers
Three momentum modes: Linear Regression, Price–SMA, or ROC
Trend and volume filters (optional)
Configurable minimum squeeze duration and signal cooldown
ATR-based target and stop multipliers
Optional historically tight squeeze filter (percentile-based)
█ ALERTS
Squeeze Detected
Squeeze Released
Long Entry
Short Entry
Exit Hint
Historically Tight Squeeze
█ NOTES
ATR-based win-rate calculations provide simplified performance estimates.
Past behavior does not guarantee future movement.
Use position sizing and risk management appropriate for the instrument and timeframe.
█ CREDITS
Inspired by the Bollinger Band and Keltner Channel squeeze concept popularized by John Carter’s TTM Squeeze, with added enhancements for squeeze strength, filtering, and real-time performance metrics.

Quantum Market Analyzer X7Quantum Market Analyzer X7 - Complete Study Guide
Table of Contents
1. Overview
2. Indicator Components
3. Signal Interpretation
4. Live Market Analysis Guide
5. Best Practices
6. Limitations and Considerations
7. Risk Disclaimer
________________________________________
Overview
The Quantum Market Analyzer X7 is a comprehensive multi-timeframe technical analysis indicator that combines traditional and modern analytical methods. It aggregates signals from multiple technical indicators across seven key analysis categories to provide traders with a consolidated view of market sentiment and potential trading opportunities.
Key Features:
• Multi-Indicator Analysis: Combines 20+ technical indicators
• Real-Time Dashboard: Professional interface with customizable display
• Signal Aggregation: Weighted scoring system for overall market sentiment
• Advanced Analytics: Includes Order Block detection, Supertrend, and Volume analysis
• Visual Progress Indicators: Easy-to-read progress bars for signal strength
________________________________________
Indicator Components
1. Oscillators Section
Purpose: Identifies overbought/oversold conditions and momentum changes
Included Indicators:
• RSI (14): Relative Strength Index - momentum oscillator
• Stochastic (14): Compares closing price to price range
• CCI (20): Commodity Channel Index - cycle identification
• Williams %R (14): Momentum indicator similar to Stochastic
• MACD (12,26,9): Moving Average Convergence Divergence
• Momentum (10): Rate of price change
• ROC (9): Rate of Change
• Bollinger Bands (20,2): Volatility-based indicator
Signal Interpretation:
• Strong Buy (6+ points): Multiple oscillators indicate oversold conditions
• Buy (2-5 points): Moderate bullish momentum
• Neutral (-1 to 1 points): Balanced conditions
• Sell (-2 to -5 points): Moderate bearish momentum
• Strong Sell (-6+ points): Multiple oscillators indicate overbought conditions
2. Moving Averages Section
Purpose: Determines trend direction and strength
Included Indicators:
• SMA: 10, 20, 50, 100, 200 periods
• EMA: 10, 20, 50 periods
Signal Logic:
• Price >2% above MA = Strong Buy (+2)
• Price above MA = Buy (+1)
• Price below MA = Sell (-1)
• Price >2% below MA = Strong Sell (-2)
Signal Interpretation:
• Strong Buy (6+ points): Price well above multiple MAs, strong uptrend
• Buy (2-5 points): Price above most MAs, bullish trend
• Neutral (-1 to 1 points): Mixed MA signals, consolidation
• Sell (-2 to -5 points): Price below most MAs, bearish trend
• Strong Sell (-6+ points): Price well below multiple MAs, strong downtrend
3. Order Block Analysis
Purpose: Identifies institutional support/resistance levels and breakouts
How It Works:
• Detects historical levels where large orders were placed
• Monitors price behavior around these levels
• Identifies breakouts from established order blocks
Signal Types:
• BULLISH BRK (+2): Breakout above resistance order block
• BEARISH BRK (-2): Breakdown below support order block
• ABOVE SUP (+1): Price holding above support
• BELOW RES (-1): Price rejected at resistance
• NEUTRAL (0): No significant order block interaction
4. Supertrend Analysis
Purpose: Trend following indicator based on Average True Range
Parameters:
• ATR Period: 10 (default)
• ATR Multiplier: 6.0 (default)
Signal Types:
• BULLISH (+2): Price above Supertrend line
• BEARISH (-2): Price below Supertrend line
• NEUTRAL (0): Transition period
5. Trendline/Channel Analysis
Purpose: Identifies trend channels and breakout patterns
Components:
• Dynamic trendline calculation using pivot points
• Channel width based on historical volatility
• Breakout detection algorithm
Signal Types:
• UPPER BRK (+2): Breakout above upper channel
• LOWER BRK (-2): Breakdown below lower channel
• ABOVE MID (+1): Price above channel midline
• BELOW MID (-1): Price below channel midline
6. Volume Analysis
Purpose: Confirms price movements with volume data
Components:
• Volume spikes detection
• On Balance Volume (OBV)
• Volume Price Trend (VPT)
• Money Flow Index (MFI)
• Accumulation/Distribution Line
Signal Calculation: Multiple volume indicators are combined to determine institutional activity and confirm price movements.
________________________________________
Signal Interpretation
Overall Summary Signals
The indicator aggregates all component signals into an overall market sentiment:
Signal Score Range Interpretation Action
STRONG BUY 10+ Overwhelming bullish consensus Consider long positions
BUY 4-9 Moderate to strong bullish bias Look for long opportunities
NEUTRAL -3 to 3 Mixed signals, consolidation Wait for clearer direction
SELL -4 to -9 Moderate to strong bearish bias Look for short opportunities
STRONG SELL -10+ Overwhelming bearish consensus Consider short positions
Progress Bar Interpretation
• Filled bars indicate signal strength
• Green bars: Bullish signals
• Red bars: Bearish signals
• More filled bars = stronger conviction
________________________________________
Live Market Analysis Guide
Step 1: Initial Assessment
1. Check Overall Summary: Start with the main signal
2. Verify with Component Analysis: Ensure signals align
3. Look for Divergences: Identify conflicting signals
Step 2: Timeframe Analysis
1. Set Appropriate Timeframe: Use 1H for intraday, 4H/1D for swing trading
2. Multi-Timeframe Confirmation: Check higher timeframes for trend context
3. Entry Timing: Use lower timeframes for precise entry points
Step 3: Signal Confirmation Process.
For Buy Signals:
1. Oscillators: Look for oversold conditions (RSI <30, Stoch <20)
2. Moving Averages: Price should be above key MAs
3. Order Blocks: Confirm bounce from support levels
4. Volume: Check for accumulation patterns
5. Supertrend: Ensure bullish trend alignment.
For Sell Signals:
1. Oscillators: Look for overbought conditions (RSI >70, Stoch >80)
2. Moving Averages: Price should be below key MAs
3. Order Blocks: Confirm rejection at resistance levels
4. Volume: Check for distribution patterns
5. Supertrend: Ensure bearish trend alignment.
Step 4: Risk Management Integration
1. Signal Strength Assessment: Stronger signals = larger position size
2. Stop Loss Placement: Use Order Block levels for stops
3. Take Profit Targets: Based on channel analysis and resistance levels
4. Position Sizing: Adjust based on signal confidence
________________________________________
Best Practices
Entry Strategies
1. High Conviction Entries: Wait for STRONG BUY/SELL signals
2. Confluence Trading: Look for multiple components aligning
3. Breakout Trading: Use Order Block and Trendline breakouts
4. Trend Following: Align with Supertrend direction.
Risk Management
1. Never Risk More Than 2% Per Trade: Regardless of signal strength
2. Use Stop Losses: Place at invalidation levels
3. Scale Positions: Stronger signals warrant larger (but still controlled) positions
4. Diversification: Don't rely solely on one indicator.
Market Conditions
1. Trending Markets: Focus on Supertrend and MA signals
2. Range-Bound Markets: Emphasize Oscillator and Order Block signals
3. High Volatility: Reduce position sizes, widen stops
4. Low Volume: Be cautious of breakout signals.
Common Mistakes to Avoid
1. Signal Chasing: Don't enter after signals have already moved significantly
2. Ignoring Context: Consider overall market conditions
3. Overtrading: Wait for high-quality setups
4. Poor Risk Management: Always use appropriate position sizing
________________________________________
Limitations and Considerations
Technical Limitations
1. Lagging Nature: All technical indicators are based on historical data
2. False Signals: No indicator is 100% accurate
3. Market Regime Changes: Indicators may perform differently in various market conditions
4. Whipsaws: Possible in choppy, sideways markets.
Optimal Use Cases
1. Trending Markets: Performs best in clear trending environments
2. Medium to High Volatility: Requires sufficient price movement for signals
3. Liquid Markets: Works best with adequate volume and tight spreads
4. Multiple Timeframe Analysis: Most effective when used across different timeframes.
When to Use Caution
1. Major News Events: Fundamental analysis may override technical signals
2. Market Opens/Closes: Higher volatility can create false signals
3. Low Volume Periods: Signals may be less reliable
4. Holiday Trading: Reduced participation affects signal quality
________________________________________
Risk Disclaimer
IMPORTANT LEGAL DISCLAIMER FROM aiTrendview
WARNING: TRADING INVOLVES SUBSTANTIAL RISK OF LOSS
This Quantum Market Analyzer X7 indicator ("the Indicator") is provided for educational and informational purposes only. By using this indicator, you acknowledge and agree to the following terms:
No Investment Advice
• The Indicator does NOT constitute investment advice, financial advice, or trading recommendations
• All signals generated are based on historical price data and mathematical calculations
• Past performance does not guarantee future results
• No representation is made that any account will achieve profits or losses similar to those shown.
Risk Acknowledgment
• TRADING CARRIES SUBSTANTIAL RISK: You may lose some or all of your invested capital
• LEVERAGE AMPLIFIES RISK: Margin trading can result in losses exceeding your initial investment
• MARKET VOLATILITY: Financial markets are inherently unpredictable and volatile
• TECHNICAL ANALYSIS LIMITATIONS: No technical indicator is infallible or guarantees profitable trades.
User Responsibility
• YOU ARE SOLELY RESPONSIBLE for all trading decisions and their consequences
• CONDUCT YOUR OWN RESEARCH: Always perform independent analysis before making trading decisions
• CONSULT PROFESSIONALS: Seek advice from qualified financial advisors
• RISK MANAGEMENT: Implement appropriate risk management strategies
No Warranties
• The Indicator is provided "AS IS" without warranties of any kind
• aiTrendview makes no representations about the accuracy, reliability, or suitability of the Indicator
• Technical glitches, data feed issues, or calculation errors may occur
• The Indicator may not work as expected in all market conditions.
Limitation of Liability
• aiTrendview SHALL NOT BE LIABLE for any direct, indirect, incidental, or consequential damages
• This includes but is not limited to: trading losses, missed opportunities, data inaccuracies, or system failures
• MAXIMUM LIABILITY is limited to the amount paid for the indicator (if any)
Code Usage and Distribution
• This indicator is published on TradingView in accordance with TradingView's house rules
• UNAUTHORIZED MODIFICATION or redistribution of this code is prohibited
• Users may not claim ownership of this intellectual property
• Commercial use requires explicit written permission from aiTrendview.
Compliance and Regulations
• VERIFY LOCAL REGULATIONS: Ensure compliance with your jurisdiction's trading laws
• Some trading strategies may not be suitable for all investors
• Tax implications of trading are your responsibility
• Report trading activities as required by law
Specific Risk Factors
1. False Signals: The Indicator may generate incorrect buy/sell signals
2. Market Gaps: Overnight gaps can invalidate technical analysis
3. Fundamental Events: News and economic data can override technical signals
4. Liquidity Risk: Some markets may have insufficient liquidity
5. Technology Risk: Platform failures or connectivity issues may prevent order execution.
Professional Trading Warning
• THIS IS NOT PROFESSIONAL TRADING SOFTWARE: Not intended for institutional or professional trading
• NO REGULATORY APPROVAL: This indicator has not been approved by any financial regulatory authority
• EDUCATIONAL PURPOSE: Designed primarily for learning technical analysis concepts
FINAL WARNING
NEVER INVEST MONEY YOU CANNOT AFFORD TO LOSE
Trading financial instruments involves significant risk. The majority of retail traders lose money. Before using this indicator in live trading:
1. Practice on paper/demo accounts extensively
2. Start with small position sizes
3. Develop a comprehensive trading plan
4. Implement strict risk management rules
5. Continuously educate yourself about market dynamics
By using the Quantum Market Analyzer X7, you acknowledge that you have read, understood, and agree to this disclaimer. You assume full responsibility for all trading decisions and their outcomes.
Contact: For questions about this disclaimer or the indicator, contact aiTrendview through official TradingView channels only.
________________________________________
This study guide and indicator are published on TradingView in compliance with TradingView's community guidelines and house rules. All users must adhere to TradingView's terms of service when using this indicator.
Document Version: 1.0
Publisher: aiTrendview
________________________________________
Disclaimer
The content provided in this blog post is for educational and training purposes only. It is not intended to be, and should not be construed as, financial, investment, or trading advice. All charting and technical analysis examples are for illustrative purposes. Trading and investing in financial markets involve substantial risk of loss and are not suitable for every individual. Before making any financial decisions, you should consult with a qualified financial professional to assess your personal financial situation.

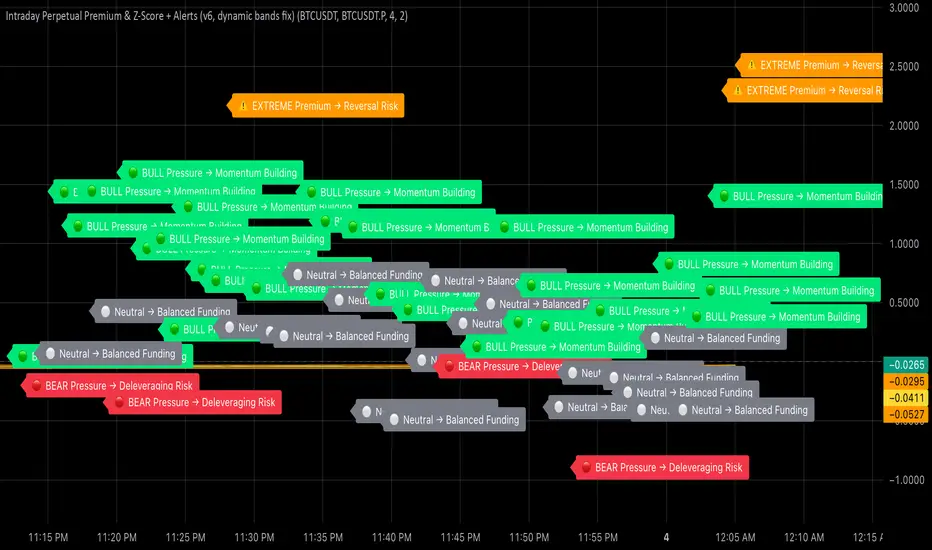
Intraday Perpetual Premium & Z-ScoreThis indicator measures the real-time premium of a perpetual futures contract relative to its spot market and interprets it through a statistical lens.
It helps traders detect when funding pressure is building, when leverage is being unwound, and when crowding in the futures market may precede volatility.
How it works
• Premium (%) = (Perp – Spot) ÷ Spot × 100
The script fetches both spot and perpetual prices and calculates their percentage difference each minute.
• Rolling Mean & Z-Score
Over a 4-hour look-back, it computes the average premium and standard deviation to derive a Z-Score, showing how stretched current sentiment is.
• Dynamic ±2σ Bands highlight statistically extreme premiums or discounts.
• Rate of Change (ROC) over one hour gauges the short-term directional acceleration of funding flows.
Colour & Label Interpretation
Visual cue Meaning Trading Implication
🟢 Green bars + “BULL Pressure” Premium rising faster than mean Leverage inflows → momentum strengthening
🔴 Red bars + “BEAR Pressure” Premium shrinking Leverage unwind → pull-back or consolidation
⚠️ Orange “EXTREME Premium/Discount” Crowded trade → heightened reversal risk
⚪ Grey bars Neutral Balanced conditions
Alerts
• Bull Pressure Alert → funding & premium rising (momentum building)
• Bear Pressure Alert → premium falling (deleveraging)
• Extreme Premium Alert → crowded longs; potential top
• Extreme Discount Alert → capitulation; possible bottom
Use case
Combine this indicator with your Heikin-Ashi, RSI, and MACD confluence rules:
• Enter only when your oscillators are low → curling up and Bull Pressure triggers.
• Trim or exit when Bear Pressure or Extreme Premium appears.
• Watch for Extreme Discount during flushes as an early bottoming clue.
Retail vs Banker Net Positions – Symmetry BreakRetail vs Banker Net Positions – Symmetry Break (Institution Focus)
Description:
This advanced indicator is a volume-proxy-based positioning tool that separates institutional vs. retail behavior using bar structure, trend-following logic, and statistical analysis. It identifies net position flows over time, detects institutional aggression spikes, and highlights symmetry breaks—those moments when institutional action diverges sharply from retail behavior. Designed for intraday to swing traders, this is a powerful tool for gauging smart money activity and retail exhaustion.
What It Does:
Separates Volume into Two Groups:
Institutional Proxy: Volume on large bars in trend direction
Retail Proxy: Volume on small or counter-trend bars
Calculates Net Positions (%):
Smooths cumulative buying vs. selling behavior for each group over time.
Highlights Symmetry Breaks:
Alerts when institutions make statistically abnormal moves while retail is quiet or doing the opposite.
Detects Extremes in Institutional Activity:
Flags major tops/bottoms in institutional positioning using swing pivots or rolling windows.
Retail Sentiment Flips:
Marks when the retail line crosses the zero line (e.g., flipping from net short to net long).
How to Use It:
Interpreting the Two Lines:
Aqua/Orange Line (Institutional Proxy):
Rising above zero = Net buying bias
Falling below zero = Net selling bias
Lime/Red Line (Retail Proxy):
Green = Retail buying; Red = Retail selling
Watch for crosses of zero for sentiment shifts
Spotting Symmetry Breaks:
Pink Circle or Background Highlight =
Institutions made a sharp, outsized move while retail was:
Quiet (low ROC), or
Moving in the opposite direction
These often precede explosive directional moves or stop hunts.
Institutional Extremes:
Marked with aqua (top) or orange (bottom) dots
Based on swing pivot logic or rolling highs/lows in institutional positioning
Optional filter: Only show extremes that coincide with a symmetry break
Settings You Can Tune:
Lookback lengths for trend, z-scores, smoothing
Z-Score thresholds to control sensitivity
Retail quiet filters to reduce false positives
Cool-down timer to avoid rapid repeat signals
Toggle visual aids like shading, markers, and threshold lines
Alerts Included:
-Retail flips (green/red)
- Institutional symmetry breaks
- Institutional extreme tops/bottoms
Strategy Tip:
Use this indicator to track institutional accumulation or distribution phases and catch asymmetric inflection points where the "smart money" acts decisively. Confluence with price structure or FVGs (Fair Value Gaps) can further enhance signal quality.

[AS] MACD-v & Hist [Alex Spiroglou | S.M.A.R.T. TRADER SYSTEMS] MACD-v & MACD-v Histogram
=======================================
Volatility Normalised Momentum 📈
Twice Awarded Indicator 🏆
=======================================
=======================================
✅ 1. INTRODUCTION TO THE MACD-v ✅
=======================================
I created the MACD-v in 2015,
as a way to deal with the limitations
of well known indicators like the Stochastic, RSI, MACD.
I decided to publicly share a very small part of my research
in the form of a research paper I wrote in 2022,
titled "MACD-v: Volatility Normalised Momentum".
That paper was awarded twice:
1. The "Charles H. Dow" Award (2022),
for outstanding research in Technical Analysis,
by the Chartered Market Technicians Association (CMTA)
2. The "Founders" Award (2022),
for advances in Active Investment Management,
by the National Association of Active Investment Managers (NAAIM)
=======================================
===================================================
❌ 2. WHY CREATE THE MACD-v ?
THE LIMITATIONS OF CONVENTIONAL MOMENTUM INDICATORS
====================================================
Technical Analysis indicators focused on momentum,
come in two general categories,
each with its own set of limitations:
(i) Range Bound Oscillators (RSI, Stochastics, etc)
These usually have a scaling of 0-100,
and thus have the advantage of having normalised readings,
that are comparable across time and securities.
However they have the following limitations (among others):
1. Skewing effect of steep trends
2. Indicator values do not adjust with and reflect true momentum
(indicator values are capped to 100)
(ii) Unbound Oscillators (MACD, RoC, etc)
These are boundless indicators,
and can expand with the market,
without being limited by a 0-100 scaling,
and thus have the advantage of really measuring momentum.
They have the main following limitations (among others):
1. Subjectivity of overbought / oversold levels
2. Not comparable across time
3. Not comparable across securities
=======================================
=======================================
💡 3. THE SOLUTION TO SOLVE THESE LIMITATIONS
=======================================
In order to deal with these limitations,
I decided to create an indicator,
that would be the "Best of two worlds".
A unique & hybrid indicator,
that would have objective normalised readings
(similar to Range Bound Oscillators - RSI)
but would also be able to have no upper/lower boundaries
(similar to Unbound Oscillators - MACD).
This would be achieved by "normalising" a boundless oscillator (MACD)
=======================================
==================================================
⛔ 4. DEEP DIVE INTO THE 5 LIMITATIONS OF THE MACD
==================================================
A Bloomberg study found that the MACD
is the most popular indicator after the RSI,
but the MACD has 5 BIG limitations.
Limitation 1: MACD values are not comparable across Time
The raw MACD values shift
as the underlying security's absolute value changes across time,
making historical comparisons obsolete
e.g S&P 500 maximum MACD was 1.56 in 1957-1971,
but reached 86.31 in 2019-2021 - not indicating 55x stronger momentum,
but simply different price levels.
Limitation 2: MACD values are not comparable across Assets
Traditional MACD cannot compare momentum between different assets.
S&P 500 MACD of 65 versus EUR/USD MACD of -0.5
reflects absolute price differences, not momentum differences
Limitation 3: MACD values cannot be Systematically Classified
Due to limitations #1 & #2, it is not possible to create
a momentum level classification scale
where one can define "fast", "slow", "overbought", "oversold" momentum
making systematic analysis impossible
Limitation 4: MACD Signal Line gives false crossovers in low-momentum ranges
In range-bound, low momentum environments,
most of the MACD signal line crossovers are false (noise)
Since there is no objective momentum classification system (limitation #3),
it is not possible to filter these signals out,
by avoiding them when momentum is low
Limitation 5: MACD Signal Line gives late crossovers in high momentum regimes.
Signal lag in strong trends not good at timing the turning point
— In high-momentum moves, MACD crossovers may come late.
Since there is no objective momentum classification system (limitation #3),
it is not possible to filter these signals out,
by avoiding them when momentum is high
===================================================================
===================================================================
🏆 5. MACD-v : THE SOLUTION TO THE LIMITATIONS OF THE MACD , RSI, etc
====================================================================
MACD-v is a volatility normalised momentum indicator.
It remedies these 5 limitations of the classic MACD,
while creating a tool with unique properties.
Formula: × 100
MACD-V enhances the classic MACD by normalizing for volatility,
transforming price-dependent readings into standardized momentum values.
This resolves key limitations of traditional MACD and adds significant analytical power.
Core Advantages of MACD-V
Advantage 1: Time-Based Stability
MACD-V values are consistent and comparable over time.
A reading of 100 has the same meaning today as it did in the past
(unlike traditional MACD which is influenced by changes in price and volatility over time)
Advantage 2: Cross-Market Comparability
MACD-V provides universal scaling.
Readings (e.g., ±50) apply consistently across all asset classes—stocks,
bonds, commodities, or currencies,
allowing traders to compare momentum across markets reliably.
Advantage 3: Objective Momentum Classification
MACD-V includes a defined 5-range momentum lifecycle
with standardized thresholds (e.g., -150 to +150).
This offers an objective framework for analyzing market conditions
and supports integration with broader models.
Advantage 4: False Signal Reduction in Low-Momentum Regimes
MACD-V introduces a "neutral zone" (typically -50 to +50)
to filter out these low-probability signals.
Advantage 5: Improved Signal Timing in High-Momentum Regimes
MACD-V identifies extremely strong trends,
allowing for more precise entry and exit points.
Advantage 6: Trend-Adaptive Scaling
Unlike bounded oscillators like RSI or Stochastic,
MACD-V dynamically expands with trend strength,
providing clearer momentum insights without artificial limits.
Advantage 7: Enhanced Divergence Detection
MACD-V offers more reliable divergence signals
by avoiding distortion at extreme levels,
a common flaw in bounded indicators (RSI, etc)
====================================================================
=======================================
⚒️ 5. HOW TO USE THE MACD-v: 7 CORE PATTERNS
HOW TO USE THE MACD-v Histogram: 2 CORE PATTERNS
=======================================
>>>>>> BASIC USE (RANGE RULES) <<<<<<
The MACD-v has 7 Core Patterns (Ranges) :
1. Risk Range (Overbought)
Condition: MACD-V > Signal Line and MACD-V > +150
Interpretation: Extremely strong bullish momentum—potential exhaustion or reversal zone.
2. Retracing
Condition: MACD-V < Signal Line and MACD-V > -50
Interpretation: Mild pullback within a bullish trend.
3. Rundown
Condition: MACD-V < Signal Line and -50 > MACD-V > -150
Interpretation: Momentum is weakening—bearish pressure building.
4. Risk Range (Oversold)
Condition: MACD-V < Signal Line and MACD-V < -150
Interpretation: Extreme bearish momentum—potential for reversal or capitulation.
5. Rebounding
Condition: MACD-V > Signal Line and MACD-V > -150
Interpretation: Bullish recovery from oversold or weak conditions.
6. Rallying
Condition: MACD-V > Signal Line and MACD-V > +50
Interpretation: Strengthening bullish trend—momentum accelerating.
7. Ranging (Neutral Zone)
Condition: MACD-V remains between -50 and +50 for 20+ bars
Interpretation: Sideways market—low conviction and momentum.
The MACD-v Histogram has 2 Core Patterns (Ranges) :
1. Risk (Overbought)
Condition: Histogram > +40
Interpretation: Short-term bullish momentum is stretched—possible overextension or reversal risk.
2. Risk (Oversold)
Condition: Histogram < -40
Interpretation: Short-term bearish momentum is stretched—potential for rebound or reversal.
=======================================
=======================================
📈 6. ADVANCED PATTERNS WITH MACD-v
=======================================
Thanks to its volatility normalization,
the MACD-V framework enables the development
of a wide range of advanced pattern recognition setups,
trading signals, and strategic models.
These patterns go beyond basic crossovers,
offering deeper insight into momentum structure,
regime shifts, and high-probability trade setups.
These are not part of this script
=======================================
===========================================================
⚙️ 7. FUNCTIONALITY - HOW TO ADD THE INDICATORS TO YOUR CHART
===========================================================
The script allows you to see :
1. MACD-v
The indicator with the ranges (150,50,0,-50,-150)
and colour coded according to its 7 basic patterns
2. MACD-v Histogram
The indicator The indicator with the ranges (40,0,-40)
and colour coded according to its 2 basic ranges / patterns
3. MACD-v Heatmap
You can see the MACD-v in a Multiple Timeframe basis,
using a colour-coded Heatmap
Note that lowest timeframe in the heatmap must be the one on the chart
i.e. if you see the daily chart, then the Heatmap will be Daily, Weekly, Monthly
4. MACD-v Dashboard
You can see the MACD-v for 7 markets,
in a multiple timeframe basis
=======================================
=======================================
🤝 CONTRIBUTIONS 🤝
=======================================
I would like to thank the following people:
1. Mike Christensen for coding the indicator
@TradersPostInc, @Mik3Christ3ns3n,
2. @Indicator-Jones For allowing me to use his Scanner
3. @Daveatt For allowing me to use his heatmap
=======================================
=======================================
⚠️ LEGAL - Usage and Attribution Notice ⚠️
=======================================
Use of this Script is permitted
for personal or non-commercial purposes,
including implementation by coders and TradingView users.
However, any form of paid redistribution,
resale, or commercial exploitation is strictly prohibited.
Proper attribution to the original author is expected and appreciated,
in order to acknowledge the source
and maintain the integrity of the original work.
Failure to comply with these terms,
or to take corrective action within 48 hours of notification,
will result in a formal report to TradingView’s moderation team,
and will actively pursue account suspension and removal of the infringing script(s).
Continued violations may result in further legal action, as deemed necessary.
=======================================
=======================================
⚠️ DISCLAIMER ⚠️
=======================================
This indicator is For Educational Purposes Only (F.E.P.O.).
I am just Teaching by Example (T.B.E.)
It does not constitute investment advice.
There are no guarantees in trading - except one.
You will have losses in trading.
I can guarantee you that with 100% certainty.
The author is not responsible for any financial losses
or trading decisions made based on this indicator. 🙏
Always perform your own analysis and use proper risk management. 🛡️
=======================================

WorldCup Dashboard + Institutional Sessions© 2025 NewMeta™ — Educational use only.
# Full, Premium Description
## WorldCup Dashboard + Institutional Sessions
**A trade-ready, intraday framework that combines market structure, real flow, and institutional timing.**
This toolkit fuses **Institutional Sessions** with a **price–volume decision engine** so you can see *who is active*, *where value sits*, and *whether the drive is real*. You get: **CVD/Delta**, volume-weighted **Momentum**, **Aggression** spikes, **FVG (MTF)** with nearest side, **Daily Volume Profile (VAH/POC/VAL)**, **ATR regime**, a **24h position gauge**, classic **candle patterns**, IBH/IBL + **first-hour “true close”** lines, and a **10-vote confluence scoreboard**—all in one view.
---
## What’s inside (and how to trade it)
### 🌍 Institutional Sessions (Sydney • Tokyo • London • New York)
* Session boxes + a highlighted **first hour**.
* Plots the **true close** (first-hour close) as a running line with a label.
**Use:** Many desks anchor risk to this print. Above = bullish bias; below = bearish. **IBH/IBL** breaks during London/NY carry the most signal.
### 📊 CVD / Delta (Flow)
* Net buyer vs seller pressure with smooth trend state.
**Use:** **Rising CVD + acceptance above mid/POC** confirms continuation. Bearish price + rising CVD = caution (possible absorption).
### ⚡ Volume-Weighted Momentum
* Momentum adjusted by participation quality (volume).
**Use:** Momentum>MA and >0 → trend drive is “real”; <0 and falling → distribution risk.
### 🔥 Aggression Detector
* ROC × normalized volume × wick factor to flag **forceful** candles.
**Use:** On spikes, avoid fading blindly—wait for pullbacks into **aligned FVG** or for aggression to cool.
### 🟦🟪 Fair Value Gaps (with MTF)
* Detects up to 3 recent FVGs and marks the **nearest** side to price.
**Use:** Trend pullbacks into **bullish FVG** for longs; bounces into **bearish FVG** for shorts. Optional threshold to filter weak gaps.
### 🧭 24h Gauge (positioning)
* Shows current price across the 24h low⇢high with a mid reference.
**Use:** Above mid and pushing upper third = momentum continuation setups; below mid = sell the rips bias.
### 🧱 Daily Volume Profile (manual per day)
* **VAH / POC / VAL** derived from discretized rows.
**Use:** **POC below** supports longs; **POC above** caps rallies. Fade VAH/VAL in ranges; treat them as break/hold levels in trends.
### 📈 ATR Regime
* **ATR vs ATR-avg** with direction and regime flag (**HIGH / NORMAL / LOW**).
**Use:** HIGH ⇒ give trades room & favor trend following. LOW ⇒ fade edges, scale targets.
### 🕯️ Candle Patterns (contextual, not standalone)
* Engulfings, Morning/Evening Star, 3 Soldiers/Crows, Harami, Hammer/Shooting Star, Double Top/Bottom.
**Use:** Only with session + flow + momentum alignment.
### 🤝 Price–Volume Classification
* Labels each bar as **continuation**, **exhaustion**, **distribution**, or **healthy pullback**.
**Use:** Align continuation reads with trend; treat “Price↑ + Vol↓” as a caution flag.
### 🧪 Confluence Scoreboard & B/S Meter
* Ten elements vote: 🔵 bull, ⚪ neutral, 🟣 bear.
**Use:** Execution filter—take setups when the board’s skew matches your trade direction.
---
## Playbooks (actionable)
**Trend Pullback (Long)**
1. London/NY active, Momentum↑, CVD↑, price above 24h mid & POC.
2. Pullback into **nearest bullish FVG**.
3. Invalidate under FVG low or **true-close** line.
4. Targets: IBH → VAH → 24h high.
**Range Fade (Short)**
1. Asia/quiet regime, **Price↑ + Vol↓** into **VAH**, ATR low.
2. Nearest FVG bearish or scoreboard skew bearish.
3. Invalidate above VAH/IBH.
4. Targets: POC → VAL.
**News/Impulse**
Aggression spike? Don’t chase. Let it pull back into the aligned FVG; require CVD/Momentum agreement before entry.
---
## Alerts (included)
* **Bull/Bear Confluence ≥ 7/10**
* **Intraday Target Achieved** / **Daily Target Achieved**
* **Session True-Close Retests** (Sydney/Tokyo/London/NY)
*(Keep alerts “Once per bar” unless you specifically want intrabar triggers.)*
---
## Setup Tips
* **UTC**: Choose the reference that matches how you track sessions (default UTC+2).
* **Volume threshold**: 2.0× is a strong baseline; raise for noisy alts, lower for majors.
* **CVD smoothing**: 14–24 for scalps; 24–34 for slower markets.
* **ATR lengths**: Keep defaults unless your asset has a persistent regime shift.
---
## Why this framework?
Because **timing (sessions)**, **truth (flow)**, and **location (value/FVG)** together beat any single signal. You get *who is trading*, *how strong the push is*, and *where risk lives*—on one screen—so execution is faster and cleaner.
---
**Disclaimer**: Educational use only. Not financial advice. Markets are risky—backtest and size responsibly.

Advanced HMM - 3 States CompleteHidden Markov Model
Aconsistent challenge for quantitative traders is the frequent behaviour modification of financial
markets, often abruptly, due to changing periods of government policy, regulatory environment
and other macroeconomic effects. Such periods are known as market regimes. Detecting such
changes is a common, albeit difficult, process undertaken by quantitative market participants.
These various regimes lead to adjustments of asset returns via shifts in their means, variances,
autocorrelation and covariances. This impacts the effectiveness of time series methods that rely
on stationarity. In particular it can lead to dynamically-varying correlation, excess kurtosis ("fat
tails"), heteroskedasticity (volatility clustering) and skewed returns.
There is a clear need to effectively detect these regimes. This aids optimal deployment of
quantitative trading strategies and tuning the parameters within them. The modeling task then
becomes an attempt to identify when a new regime has occurred adjusting strategy deployment,
risk management and position sizing criteria accordingly.
A principal method for carrying out regime detection is to use a statistical time series tech
nique known as a Hidden Markov Model . These models are well-suited to the task since they
involve inference on "hidden" generative processes via "noisy" indirect observations correlated
to these processes. In this instance the hidden, or latent, process is the underlying regime state,
while the asset returns are the indirect noisy observations that are influenced by these states.
MAIN FEATURES OF THE INDICATOR
The "Advanced HMM - 3 States Complete" indicator is an advanced technical analysis tool that uses Hidden Markov Model (HMM) to identify three main market regimes: BULL, BEAR, and SIDEWAYS.
🎯 KEY FEATURES:
1. HMM-based Trend Detection
3 market states: Bull (0), Bear (1), Sideways (2)
Dynamic probabilities: Calculates probability for each state based on price data
Transition matrix: Models state transitions between regimes
2. Analytical Features
Price volatility: Log returns and standard deviation
Momentum: Rate of Change (ROC)
Volume: Volume ratio vs moving average
Data normalization: Standardizes features to common scale
3. Visual Trading Signals
text
📍 BUY Signals:
- Green upward triangle below bars
- "LONG" label in green
📍 SELL Signals:
- Red downward triangle above bars
- "SHORT" label in red
📍 EXIT Signals:
- Orange X marks when transitioning to sideways
4. Information Display
Probability table (top-right): Shows percentage for each state
State label: Current regime with probability percentages
Chart background color: Reflects dominant market state
5. Automated Alerts
Alerts when new Bull/Bear market detected
Alerts when market transitions to sideways
Configurable TradingView notifications
6. Customizable Parameters
pinescript
length: 100 // Lookback period
smoothing_period: 20 // Probability smoothing
volatility_threshold: 0.5 // Volatility threshold
💡 PRACTICAL APPLICATIONS:
Identify primary trends with quantified probabilities
Entry/exit signals based on state transitions
Risk management during sideways markets
Trend confirmation when combined with other indicators
This indicator is particularly useful for market regime analysis and identifying trend transition points using advanced statistical probability methods.
🔧 TECHNICAL IMPLEMENTATION:
Composite observation: Weighted combination of returns (40%), momentum (30%), and volatility (30%)
Gaussian emission probabilities: Different distributions for each state
Manual HMM updates: Avoids matrix computation limitations in Pine Script
Real-time smoothing: EMA applied to state probabilities
The indicator provides institutional-grade regime detection in a visually intuitive package suitable for both discretionary and systematic traders.

QUANTUM MOMENTUMOverview
Quantum Momentum is a sophisticated technical analysis tool designed to help traders identify relative strength between assets through advanced momentum comparison. This cyberpunk-themed indicator visualizes momentum dynamics between your current trading symbol and any comparison asset of your choice, making it ideal for pairs trading, crypto correlation analysis, and multi-asset portfolio management.
Key Features
📊 Multi-Asset Momentum Comparison
Dual Symbol Analysis: Compare momentum between your chart symbol and any other tradable asset
Real-Time Tracking: Monitor relative momentum strength as market conditions evolve
Difference Visualization: Clear histogram display showing which asset has stronger momentum
🎯 Multiple Momentum Calculation Methods
Choose from four different momentum calculation types:
ROC (Rate of Change): Traditional percentage-based momentum measurement
RSI (Relative Strength Index): Oscillator-based momentum from 0-100 range
Percent Change: Simple percentage change over the lookback period
Raw Change: Absolute price change in native currency units
📈 Advanced Trend Filtering System
Enable optional trend filters to align momentum signals with prevailing market direction:
SMA (Simple Moving Average): Classic trend identification
EMA (Exponential Moving Average): Responsive trend detection
Price Action: Identifies trends through higher highs/lows or lower highs/lows patterns
ADX (Average Directional Index): Measures trend strength with customizable threshold
🎨 Futuristic Cyberpunk Design
Neon Color Scheme: Eye-catching cyan, magenta, and matrix green color palette
Glowing Visual Effects: Enhanced visibility with luminescent plot lines
Dynamic Background Shading: Subtle trend state visualization
Real-Time Data Table: Sleek information panel displaying current momentum values and trend status
How It Works
The indicator calculates momentum for both your current chart symbol and a comparison symbol (default: BTC/USDT) using your selected method and lookback period. The difference between these momentum values reveals which asset is exhibiting stronger momentum at any given time.
Positive Difference (Green): Your chart symbol has stronger momentum than the comparison asset
Negative Difference (Pink/Red): The comparison asset has stronger momentum than your chart symbol
When the trend filter is enabled, the indicator will only display signals that align with the detected market trend, helping filter out counter-trend noise.
Settings Guide
Symbol Settings
Compare Symbol: Choose any tradable asset to compare against (e.g., major indices, cryptocurrencies, forex pairs)
Momentum Settings
Momentum Length: Lookback period for momentum calculations (default: 14 bars)
Momentum Type: Select your preferred momentum calculation method
Display Options
Toggle visibility of current symbol momentum line
Toggle visibility of comparison symbol momentum line
Toggle visibility of momentum difference histogram
Optional zero line reference
Trend Filter Settings
Use Trend Filter: Enable/disable trend-based signal filtering
Trend Method: Choose from SMA, EMA, Price Action, or ADX
Trend Length: Period for trend calculations (default: 50)
ADX Threshold: Minimum ADX value to confirm trend strength (default: 25)
Best Use Cases
✅ Pairs Trading: Identify divergences in momentum between correlated assets
✅ Crypto Market Analysis: Compare altcoin momentum against Bitcoin or Ethereum
✅ Stock Market Rotation: Track sector or index relative strength
✅ Forex Strength Analysis: Monitor currency pair momentum relationships
✅ Multi-Timeframe Confirmation: Use alongside other indicators for confluence
✅ Mean Reversion Strategies: Spot extreme momentum divergences for potential reversals
Visual Indicators
⚡ Cyan Line: Your chart symbol's momentum
⚡ Magenta Line: Comparison symbol's momentum
📊 Green/Pink Histogram: Momentum difference (positive = green, negative = pink)
▲ Green Triangle: Bullish trend detected (when filter enabled)
▼ Red Triangle: Bearish trend detected (when filter enabled)
◈ Yellow Diamond: Neutral/sideways trend (when filter enabled)
Pro Tips
💡 Look for crossovers between the momentum lines as potential trade signals
💡 Combine with volume analysis for stronger confirmation
💡 Use momentum divergence (price making new highs/lows while momentum doesn't) for reversal signals
💡 Enable trend filter during ranging markets to reduce false signals
💡 Experiment with different momentum types to find what works best for your trading style
Technical Requirements
TradingView Pine Script Version: v6
Chart Type: Works on all chart types
Indicator Placement: Separate pane (overlay=false)
Data Requirements: Needs access to comparison symbol data

TwinPulse Q Lead SPY x QQQ Intermarket Pulse 1HTwinPulse Q Lead is a concise one hour indicator for SPY and QQQ that converts three sources of market information into a single pulse line, a mode readout with BUY SELL WAIT, and compact alerts. It blends intermarket leadership between QQQ and SPY, intraday flow from the slope of session VWAP, and where the current price sits inside the regular trading hours range. The three components are normalized, fused, compressed to a stable range, and smoothed for clear thresholds. The aim is a readable intraday regime signal that helps you decide when to participate and when to stand aside.
The script is built with Pine v6, uses request security with lookahead off, and does not repaint. It is an indicator, not a strategy. It does not contain any solicitation, links, or outside references. The description is self contained and explains both logic and use so that any trader can understand the design without reading code.
What makes this original and useful
Intermarket leadership is measured directly from QQQ and SPY on your working timeframe using a Z score of the return spread. When growth is leading value heavy large caps, leadership turns positive. When it lags, leadership turns negative. This gives a real time read of the Nasdaq versus S and P tug of war that most day traders watch informally.
Intraday flow is taken from the slope of the session VWAP. A linear regression of VWAP over a short window captures whether value is rising or falling inside the day. Dividing by ATR normalizes slope by typical movement so that the signal is comparable across weeks.
Session position places price inside the current regular hours high to low. It answers whether the day is trading in the top half, the bottom half, or the middle. This is a simple but powerful context filter for breakouts and fades.
The three components are fused into one pulse, compressed with either hyperbolic tangent or softsign to keep values bounded, and then smoothed by a short EMA. This yields a stable range with a zero line so the eye can read shifts quickly.
The panel shows a human readable mode with reasons and a strength score. Traders who do not want to read lines can rely on a simple state and a compact justification that explains why the state is set.
This is not a mashup that simply overlays unrelated indicators. Each component was chosen to answer a distinct question that is common to SPY and QQQ intraday decision making. Leadership answers who is in charge, flow answers whether value inside the session is building or leaking, and position answers if price is pressing the extremes or circling the middle. The pulse ties the three together and prevents any single component from dominating.
How the calculations work
Leadership. Compute a short rate of change for SPY and QQQ. Subtract SPY from QQQ to get spread returns, then compute a rolling Z score over a longer window. Positive values mean QQQ is leading. Negative values mean SPY is leading.
Flow. Compute session VWAP on the active symbol. Regress VWAP over a short window to obtain a slope estimate. Divide by ATR to scale slope by current volatility so that a small rise on a quiet day is not treated the same as a small rise on a wild day.
Position. Track the highest high and lowest low since the start of regular hours. Place the current close inside that range on a zero to one scale, then recenter to a minus one to plus one scale. Positive means the top half of the day, negative means the bottom half.
Fusion. Multiply each component by a weight so users can emphasize or de emphasize leadership, flow, or position. Sum to a raw pulse.
Compression. Pass the raw pulse through a bounded function. Hyperbolic tangent is smooth and has natural saturation near the extremes. Softsign is faster and behaves like a smoother version of sign near zero. Compression avoids unbounded excursions and makes thresholds meaningful across days.
Smoothing. Apply a short EMA to the compressed pulse to reduce noise. This creates the main line called TwinPulse in the plot.
Thresholds. You can use static symmetric levels or adaptive levels. The adaptive option computes a mean and a standard deviation of the smoothed pulse over a user window, then sets upper and lower thresholds as mean plus or minus sigma times standard deviation. This allows thresholds to adjust across regimes. Static levels are still available for traders who want repeatable levels.
Events and mode. A long event fires when the smoothed pulse crosses the upper threshold with positive flow and any optional filters agree. A short event fires on the symmetric condition. The mode reads the current state rather than fire and forget. It returns BUY when the smoothed pulse is above the upper threshold with positive flow, SELL when the smoothed pulse is below the lower threshold with negative flow, otherwise WAIT. A cooldown controls how often events can fire so alerts do not spam during choppy periods.
Inputs and default values
The script ships with defaults chosen for SPY and QQQ on one hour charts.
Symbols. SPY and QQQ by default. You can switch to any pair. Many users may test IWM versus SPY for small cap reads.
Regular hours selector. On by default. This restricts the position factor to New York regular hours. Turn it off if you prefer full session behavior.
ROC length is three bars. Z score length is fifty bars. VWAP slope window is ten bars. ATR length is fourteen bars. Pulse smoothing length is three bars.
Compression mode. Choose hyperbolic tangent or softsign. Hyperbolic tangent is default.
Weights. Leadership and flow are one by default. Position is set to zero point seven to give a modest influence to where price sits inside the day.
Thresholds. Adaptive thresholds are on by default with a lookback of one hundred bars and a sigma width of zero point eight. Static levels at plus or minus zero point six are ready if you disable adaptive mode.
Filters. ADX filter is off by default. If you enable it, the script requires ADX above a user minimum before it will signal. Higher time frame confirmation is off by default. When enabled it compares the smoothed pulse on the confirm timeframe to zero and requires alignment for longs or shorts.
Cooldown. Three bars by default so that alerts do not trigger too frequently.
UI. Bar coloring is on by default. The panel is on by default and sits at the top right.
All request security calls use lookahead off and will not request future data. All persistent state variables are assigned in a way that prevents repainting. The indicator does not use non standard chart types in its logic.
How to use the indicator
Load a one hour chart of SPY or QQQ. Keep a clean chart so that the script output is easy to read.
Turn on regular hours if you want the session position to reflect the cash session. This is recommended for SPY and QQQ.
Watch the panel. Mode reads BUY or SELL or WAIT. The strength value is a simple vote based score that ranges from zero to one hundred. It counts leadership, flow, ADX if enabled, and higher time frame confirmation if enabled. You can use strength to filter weak states.
Consider action only when mode is BUY or SELL and the signal has not just fired on the last bar. The triangles mark where an event fired. Alerts use the same logic as the events. WAIT means stand aside.
To slow the system, enable ADX and set a higher minimum or enable higher time frame confirmation. To speed it up, disable the filters, disable adaptive thresholds, or tighten the sigma width.
When publishing, use a clean chart with only this indicator. Show the symbol and timeframe clearly and make sure the plot legend is visible. If you add drawings on the chart, only include ones that help readers understand the output.
Publication notes and compliance
This description is written in English. The title uses ASCII and only uses capital letters for common abbreviations. The script is original and explains how and why the components work together. There are no links or promotional material. The script does not claim performance. It does not use lookahead. The panel and alerts exist to help a human read and act with discipline. The indicator can be published as open source or as protected. If you choose protected, the description still allows readers to understand how the logic works without access to the code.
If you later convert the logic into a strategy for publication, use realistic commission and slippage, risk no more than a small share of equity per trade, and choose a dataset that yields a large enough sample. Explain any deviations from these default recommendations in your strategy description. Do not publish results from non standard chart types since they can mislead readers on signal timing.
Limitations and risks
Intermarket leadership is a relative measure. There are hours when both SPY and QQQ fall while leadership remains positive. Treat leadership as a context, not a stand alone trigger.
VWAP slope is a path measure inside the session. It can flip several times on a choppy day. That is why the script uses a short smoothing and an optional cooldown. Use ADX or higher time frame confirmation to avoid the worst chop.
Session position assumes a meaningful regular hours range. On half days or around openings with gaps the position factor can be less informative. If this bothers you, reduce the weight of position or turn it off.
Compression and smoothing introduce lag by design. The goal is stability and clarity. If you want earlier but noisier signals, reduce smoothing and weights, and use static thresholds.
No indicator guarantees future results. TwinPulse Q Lead is a decision aid. It should be combined with your risk rules, position size policy, and a clear exit plan. Past behavior is not a promise for the future.
Frequently asked questions
What symbols are supported. Any symbol can be used as the chart symbol. Leadership uses the two user symbols which default to SPY and QQQ. Many traders may try IWM versus SPY or DIA versus SPY.
Can I change the timeframe. Yes, but the design target is one hour. On very short timeframes the VWAP slope becomes very sensitive and you should consider stronger filters.
Does the script repaint. No. It uses request security with lookahead off and the panel updates on the last bar only. Events are based on bar close conditions unless you attach alerts on any alert function call which will still respect the logic without looking into the future.
How are the strength numbers built. The strength score is the share of aligned votes across leadership, flow, ADX if enabled, and higher time frame confirmation if enabled. A value near one hundred means many filters agree. A value near fifty means partial alignment. It is not a probability or an accuracy number.
Can I use non standard chart types. You can view the indicator on them but do not publish signals from non standard chart types because that can mislead readers about timing. Use classic candles or bars when you publish and when you test.
Why do I sometimes see BUY but the price is not moving. A BUY mode requires pulse above the upper threshold and positive flow. It does not require higher highs immediately. Treat BUY as a permission to look for entries using your own execution rules.

Oscillator CandlesticksI've always wondered why we don't use candlesticks for oscillators...then I stopped wondering and made an oscillator with candlesticks.
The following oscillators are available as a proof of concept:
* Consumer Channel Index (CCI)
* Rate of Change (ROC)
* Relative Strength Index (RSI)
* Trend Strength Index (TSI)
You can add a moving average to the ohlc4 value of the oscillator and choose the type of the moving average and whether it should be influenced by volume.

MTF RSI Heatmap)# MTF RSI Heatmap — v2.7.2
**Hybrid Higher-TF Trend + Intraday Impulse Detection + Smart Counters & Alerts**
Turn your lower pane into a **multi-timeframe market bias dashboard**. This heatmap blends classic RSI momentum with a **hybrid Daily/Weekly MA-stack trend** and an **intraday impulse override** that flags fast moves *as they happen*. Clean, configurable, and built for real trading flow.
---
## What it shows
* **6 stacked rows = 6 timeframes** (bottom → top).
* **Colors**: Green = Bull, Red = Bear, Yellow = Neutral.
* **Header counter**: `Bull X/6 | Bear Y/6` = live agreement across visible rows.
* **Impulse markers** ▲/▼ on intraday rows (5m/15m/60m/240m) when a shock move triggers.
* **Signal bar**: A thin column above the top row when at least **N of 6** rows align (configurable).
---
## Why it’s different
* **Impulse Override (intraday)**
Detects sharp moves using % change over the last *N* bars, optionally gated by **volume > SMA × multiplier**. This catches dumps/pops earlier than RSI alone.
* **Hybrid D/W (structure over noise)**
Daily/Weekly rows can use an **MA stack (8/21/55)** instead of RSI for a more stable higher-timeframe trend read. Optional **price > fast MA** filter for stricter confirmation.
* **Intrabar option**
Flip rows **during the bar** for early reads (accepting repaint on TF close), or keep it close-only for no surprises.
---
## Key features
* 🌈 **Theme**: Classic or High-Contrast colors.
* 🧠 **RSI thresholds**: Bull above 55, Bear below 45 (editable).
* 🧲 **RSI smoothing** (EMA) for intraday rows to reduce flicker.
* 🧰 **Compact left legend** with adjustable text size & opacity.
* 🚨 **Alerts**:
* **Impulse-only** (per TF and “any intraday”)
* **N-of-6 confirmation** (bull/bear)
---
## Recommended settings (fast opens & news)
* **Impulse**: `Bars = 1–2`, `Threshold = 0.25–0.35%`, `Vol confirm = ON`, `Multiplier = 1.3–1.5`.
* **Hybrid D/W**: `ON`, `EMA 8/21/55`, `Price filter = ON`.
* **Intrabar**: `ON` if you want intra-bar updates (repaints at TF close).
---
## How to read it
1. **Row scan**: Are the bottom (fast) rows aligning first? That’s early momentum.
2. **Header counter**: Look for 4+/6 agreement as momentum broadens.
3. **Signal bar**: Acts as a “go/no-go” confirmation when your threshold is met.
4. **Impulse ▲/▼**: Use as a **heads-up** for acceleration; then watch if rows cascade in that direction.
---
## Alerts (exact names)
Create alerts with these built-ins:
* **Impulse UP — any intraday**
* **Impulse DOWN — any intraday**
* **Impulse UP — TF1 / TF2 / TF3 / TF4**
* **Impulse DOWN — TF1 / TF2 / TF3 / TF4**
* **Bull confirmation** (N-of-6)
* **Bear confirmation** (N-of-6)
Tip: Use **Once per bar** or **Once per bar close** depending on whether you enabled *Intrabar*.
---
## Inputs overview
* **Timeframes & visibility** per row.
* **RSI**: length, bull/bear thresholds, optional EMA smoothing (intraday only).
* **Impulse**: bars, %, volume confirm, SMA length, multiplier, markers.
* **Hybrid D/W**: MA type (EMA/SMA/HMA), 8/21/55 lengths, price filter.
* **Theme & Legend**: color theme, label size (Tiny/Small/Normal), legend opacity.
* **Signal**: N required for confirmation (default 4).
---
## Pro tips
* Combine with **session opens**, **VWAP**, and **liquidity levels**.
* If you trade breakouts, let **impulse triggers** cue attention, then wait for **N-of-6** confirmation.
* For swing bias, lean on **Hybrid D/W**—it changes slower, but with intent.
---
## Notes & limitations
* **Intrabar = repaint expected** on higher-TF closes—by design for earlier context.
* Colors/thresholds are general guidance, not signals by themselves.
* Past performance ≠ future results; **this is not financial advice**.
---
If you enjoy this, drop a ⭐ and tell me what you want next: background shading on confirmation, tooltips with RSI/ROC per row, or a MACD/RSI hybrid mode. Trade sharp! ✨
Katana_Fox RSI Pro - Advanced Momentum Indicator with Clear BUOverview:
Connors RSI Pro is a sophisticated enhancement of the classic Connors RSI indicator, designed for traders who demand professional-grade tools. This premium version combines multiple momentum components with intelligent signaling and beautiful visualization to give you an edge in the markets.
Key Features:
🎯 Clear BUY/SELL Signal System
BUY signals in green when CRSI crosses above oversold level
SELL signals in red when CRSI crosses below overbought level
Clean, professional labels that are easy to read
Customizable overbought/oversold levels (70/30 default)
🎨 Professional Visualization
Modern color scheme that adapts to market conditions
Customizable background fills for better readability
Smooth, easy-to-read line plotting
⚡ Enhanced Calculations
Triple-component momentum analysis (RSI, UpDown RSI, Percent Rank)
EMA smoothing for reduced noise and false signals
Configurable lengths for each component
🔔 Advanced Alert System
4 distinct alert conditions for various market scenarios
Compatible with TradingView's native alert system
Perfect for automated trading strategies
Input Parameters:
RSI Length (3): Period for standard RSI calculation
UpDown Length (2): Period for UpDown RSI component
ROC Length (100): Period for Rate of Change percentile ranking
Signal Alerts: Toggle BUY/SELL signals on/off
Custom Colors: Choose between classic and modern color schemes
Trading Signals:
BUY (Green Label): Bullish signal when CRSI crosses above oversold level
SELL (Red Label): Bearish signal when CRSI crosses below overbought level
Background Colors: Visual zones indicating momentum strength
Ideal For:
Swing traders seeking momentum reversals
Day traders looking for overbought/oversold conditions
Algorithmic traders needing reliable signals
Technical analysts wanting multi-timeframe confirmation
How to Use:
Oversold Bounce: Enter long when CRSI shows BUY signal above 30
Overbought Rejection: Enter short when CRSI shows SELL signal below 70
Trend Confirmation: Use the 50-level crossover for trend direction
Divergence Trading: Look for price/indicator divergences at extremes
Upgrade your trading arsenal with Connors RSI Pro - where professional analytics meet clear trading signals!
