RSI Divergences (Regular, Hidden, Exaggerated)RSI Divergences (Regular, Hidden, Exaggerated)
This indicator detects and visually highlights all major types of RSI divergences on your chart: Regular, Hidden, and Exaggerated divergences, both bullish and bearish.
Key Features:
Calculates RSI based on a user-defined length and timeframe that automatically matches your chart's timeframe.
Identifies pivot highs and lows on both price and RSI using customizable pivot left/right bars.
Detects divergences when RSI and price movements disagree, signaling potential trend reversals or continuation.
Differentiates between three types of divergences:
Regular Divergence: Classic signal for possible trend reversal.
Hidden Divergence: Often indicates trend continuation.
Exaggerated Divergence: A less common form signaling momentum changes.
Draws clear colored lines and labels on the RSI pane for each divergence, using green for bullish and red for bearish signals.
Includes RSI overbought (70) and oversold (30) bands with gradient fills to help visualize RSI zones.
Efficient use of arrays to track pivots and manage plotting history for smooth performance.
Usage:
Ideal for traders looking to leverage RSI divergences for better timing entries and exits in trending and range-bound markets. The script is fully customizable and works seamlessly across different timeframes
Cari dalam skrip untuk "rsi divergence"

RSI Divergence Pro Price Overlay High-Prob v6RSI Divergence Pro — Comprehensive Usage Guide
1) What This Indicator Does (in plain English)
Goal: Detect high-probability reversal (and optionally continuation) points using RSI divergences, then draw clean visual lines on price (red/bearish, green/bullish) and attach a % Strength label to help you quickly decide if it’s worth trading.
Core logic:
• Finds confirmed peaks and valleys using ta.pivothigh and ta.pivotlow.
• Bearish: Price makes Higher High while RSI makes Lower High.
• Bullish: Price makes Lower Low while RSI makes Higher Low.
• Filters for high probability: RSI near OB/OS, min RSI diff, ATR scaling, pivot spacing.
• Draws lines on price chart and attaches % Strength label.
• Alerts trigger only when a new divergence line is drawn.
2) Inputs & What Each One Means
• RSI Period: Shorter = more reactive; longer = smoother.
• Pivot Left/Right: Controls peak/valley confirmation.
• RSI Overbought/Oversold: Default 60/40; tighten for lower TFs.
• Min RSI Divergence: Minimum difference between RSI pivots.
• ATR Length & Min Price Move vs ATR: Ensures structural change.
• Bars Between Pivots: Avoid micro noise and stale signals.
• Hidden Divergence toggle: OFF for reversal; ON for continuation.
3) The % Strength Label — What It Represents
Combines RSI divergence magnitude (60%), Price move vs ATR (30%), OB/OS proximity (10%).
Interpretation:
• 80–100%: A-grade signals.
• 60–79%: Good, tradable with confirmation.
• 40–59%: Caution.
• <40%: Usually skip.
4) High-Probability Trading Workflow (H1)
1. Step 1: Scan & identify the signal.
2. Step 2: Confirm with price action (structure break or engulfing).
3. Step 3: Entry (conservative or aggressive).
4. Step 4: Stop placement (pivot ±0.5×ATR).
5. Step 5: Take profit & management (TP1 1×ATR, TP2 2×ATR, trail).
5) Confluence & Filters
• EMA slope confirmation.
• Structure alignment with S/R zones.
• Volatility regime check.
6) Example Scenarios
• A) Bearish Classic Divergence: HH price + LH RSI, Strength 83%.
• B) Bullish Classic Divergence: LL price + HL RSI, Strength 68%.
• C) Hidden Bullish Divergence: HL price + LL RSI, Strength 75%.
7) Common Pitfalls & How to Avoid Them
• Forcing signals in dead volatility.
• Taking divergences in strong trends without confirmation.
• Ignoring pivot spacing.
8) Tuning for Your Style
• H1 defaults: RSI 10, pivots 5/5, thresholds 60/40.
• M15/M5: thresholds 65/35, min RSI diff 10–12.
• H4/D1: thresholds 58/42, ATR multiple 0.4–0.6.
9) Multi-Asset Notes
• FX majors: overlap session ideal.
• Indices: require engulfing confirmation.
• Crypto: use ATR multiple ≥0.7.
10) Alerts — How to Use Them
• Set alerts Once per bar close.
• Alert names: Bearish RSI Divergence, Bullish RSI Divergence.
11) Backtesting & Forward Testing
• Define rules: entry, stop, TP.
• Track Strength % bins.
12) Troubleshooting & Diagnostics
• No lines? Loosen thresholds.
• Too many lines? Tighten thresholds.
13) Quick Operator’s Checklist
• Signal present?
• Location near S/R?
• Confirmation present?
14) Future Upgrade Options
• Session filter (London–NY overlap).
• EMA slope confirmation.
• Structure-break confirmation.
• Alert text enhancements.

RSI Divergence (Nikko)RSI Divergence by Nikko
🧠 RSI Divergence Detector — Nikko Edition This script is an enhanced RSI Divergence detector built with Pine Script v6, modified for better visuals and practical usability. It uses linear regression to detect bullish and bearish divergences between the RSI and price action — one of the most reliable early signals in technical analysis.
✅ Improvements from the Original:
- Clean divergence lines using regression fitting.
- Optional label display to reduce clutter (Display Labels toggle).
- Adjustable line thickness (Display Line Width).
- A subtle heatmap background to highlight RSI overbought/oversold zones.
- Uses max accuracy with high calc_bars_count and custom extrapolation window.
🔍 How It Works: The script applies linear regression (least squares method) on both RSI data, and Price (close) data.
It then compares the direction of RSI vs. direction of Price over a set length. If price is making higher highs while RSI makes lower highs, it's a bearish divergence. If price is making lower lows while RSI makes higher lows, it's a bullish divergence. Additional filters (e.g., momentum and slope thresholds) are used to validate only strong divergences.
🔧 Input Parameters: RSI Length: The RSI period (default: 14). RSI Divergence Length: The lookback period for regression (default: 25). Source: Which price data to calculate RSI from (default: close). Display Labels: Show/hide “Bullish” or “Bearish” labels on the chart. Display Line Width: Adjusts how thick the plotted divergence lines appear.
📣 Alerts: Alerts are built-in for both RSI Buy (bullish divergence) and RSI Sell (bearish divergence) so you can use it in automation or notifications.
🚀 Personal Note: I’ve been using this script daily in my own trading, which is why I took time to improve both the logic and visual clarity. If you want a divergence tool that doesn't clutter your chart but gives strong signals, this might be what you're looking for.

RSI Divergences KittenRSI Divergences + Adjustable RSI σ-Bands + Band Pierce Signals (with optional US weekend filter)
Description:
This indicator combines three RSI tools into one clean workflow:
1. RSI σ-Bands (mean ± k·σ)
It builds dynamic upper/lower bands around RSI using a moving mean and standard deviation. These bands adapt to regime changes (expanding in volatile periods, contracting in quiet periods). Bands can be clipped to RSI’s natural 0–100 range and optionally filled for readability.
2. Band “Pierce” Signals
It prints a marker when RSI crosses outside the upper band (overextension) or outside the lower band (underextension). These pierces are useful as timing signals for mean-reversion setups, especially when you expect price to revert back toward a reference mean (e.g., VWAP). Optional “re-entry” markers show when RSI crosses back inside the bands.
3. Proper RSI Divergences (Regular + Hidden)
Divergences are detected using RSI pivots (not price pivots). At each RSI pivot, the script samples the corresponding price high/low on that pivot bar and compares it to the previous pivot within a configurable bar-distance window.
• Bullish divergence: price lower low + RSI higher low
• Hidden bullish: price higher low + RSI lower low
• Bearish divergence: price higher high + RSI lower high
• Hidden bearish: price lower high + RSI higher high
Line width is configurable for visibility.
Manual Band Adjustment (Near-Miss Control):
If your best reversals “nearly” tag the band, you can manually tune sensitivity without rewriting the math:
• Band offset (RSI points): nudges trigger levels
• Band width scale: tightens/widens the σ-band envelope
US Weekend Filter (Optional):
You can optionally suppress pierce/divergence signals during US weekend hours (Fri 17:00 ET → Sun 17:00 ET) and optionally shade those periods to help isolate low-liquidity behavior.
Notes / Intended Use:
This is designed as a mean-reversion timing tool, not a standalone trading system. For best results, combine signals with a market “mean” (e.g., rolling VWAP) and basic risk controls.

RSI Divergence Pro+ VolumeRSI Divergence Pro+ Volume
What It Does:
RSI Divergence Pro+ Volume is a non-repainting indicator that helps traders spot potential bullish and bearish reversal zones using a classic technical analysis concept—RSI divergence—combined with advanced volume confirmation. The script highlights moments when price and RSI disagree, filtering for signals only when there is a significant volume spike, which helps reduce false positives in quiet or illiquid markets.
How It Works:
Bullish Divergence: Triggered when price makes a lower low but RSI forms a higher low, suggesting possible exhaustion in selling pressure.
Bearish Divergence: Triggered when price makes a higher high but RSI forms a lower high, signaling potential buying exhaustion.
Volume Confirmation: Signals only appear when trading volume exceeds a dynamic threshold (based on a user-defined moving average and multiplier), making alerts more reliable.
Visual Features: Customizable labels and optional gradient highlights mark the exact bars where divergence with volume confirmation occurs, making signals easy to see.
Alert System: Built-in alerts for both bullish and bearish divergences so traders can receive instant notifications.
How to Use:
Apply the script to any timeframe or liquid asset (15m–4H recommended for best results).
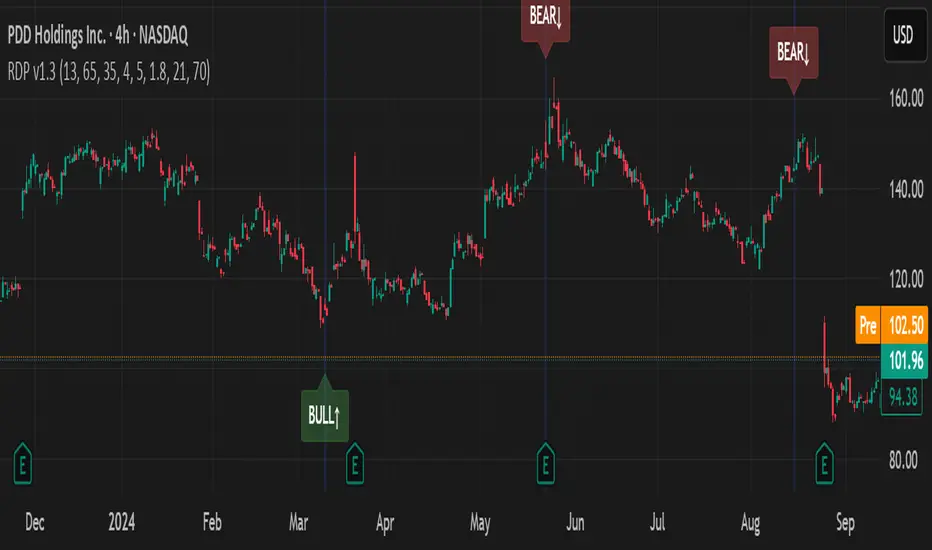
Watch for green “BULL↑” labels below bars (bullish divergence) and red “BEAR↓” labels above bars (bearish divergence).
Blue/violet background highlights confirm volume-verified signals.
Combine with your own risk management and confirmation tools for trade entries/exits.
Adjust lookback and volume settings to match your asset and style.
Originality & Usefulness:
This indicator stands out by combining traditional RSI divergence with advanced volume filtering, giving more credible and actionable reversal alerts. All logic is non-repainting and calculated on closed bars only. Settings are fully grouped and customizable, with professional visuals for clarity.
Limitations & Disclaimers:
Not every divergence results in a major reversal—use with other analysis.
More effective in trending or volatile markets; may produce more false signals in choppy/range conditions.
Signals are generated on bar close and do not repaint.
No indicator is a substitute for proper trading discipline and risk management.
RSI Divergence (No pivots, delta + cooldown)RSI Divergence (No Pivots, Delta + Cooldown)
This indicator detects classic RSI divergence without using pivots/fractals and without looking into future bars. It is designed to behave closer to “human eyeballing” by comparing current extremes to the last N bars, and it triggers signals only on bar close (non-repainting after the candle closes).
Logic
Bearish divergence: Price makes a new lookback high (relative to the previous lookback bars), while RSI does not make a new high.
A signal is printed only if RSI is at least Δ RSI points below the previous RSI high over the same lookback window.
Bullish divergence: Price makes a new lookback low (relative to the previous lookback bars), while RSI does not make a new low.
A signal is printed only if RSI is at least Δ RSI points above the previous RSI low over the same lookback window.
Inputs
RSI Length: RSI period.
Lookback (bars): Number of past bars used to define “new high/low” for both price and RSI.
Use High/Low (else Close): Choose whether price extremes are based on High/Low or Close.
RSI delta (points): Minimum RSI gap required to confirm the divergence (reduces weak/noisy signals).
Cooldown after signal (bars): After any signal, the indicator suppresses new signals for the next X bars to reduce alert/label spam.
Alerts
The script includes two alert conditions:
Bearish divergence (delta + cooldown)
Bullish divergence (delta + cooldown)
Recommended alert setting: Once per bar close.

RSI Divergence Indicator + Current Value - YOSIRSI Divergence Indicator – TradingView
The RSI Divergence Indicator is a custom TradingView tool designed to detect and visualize both regular and hidden divergences between price action and the Relative Strength Index (RSI).
🔹 Core Features:
Plots RSI with standard overbought (70), oversold (30), and midline (50) levels.
Highlights regular bullish divergence (price makes lower low, RSI makes higher low).
Highlights regular bearish divergence (price makes higher high, RSI makes lower high).
Detects hidden bullish divergence (price higher low, RSI lower low).
Detects hidden bearish divergence (price lower high, RSI higher high).
Clear visual signals using colored markers and labels (“Bull”, “Bear”, “H Bull”, “H Bear”).
Built-in alert conditions to notify traders when new divergences appear.
🔹 Customization:
Adjustable RSI period and source (default: 14, close).
Configurable pivot lookback (left & right) for fine-tuning divergence detection.
Options to enable/disable plotting of specific divergence types.
Custom colors for bullish, bearish, hidden bullish, and hidden bearish signals.
🔹 Added Upgrade (based on your request):
Displays the current RSI value next to the line, allowing quick reference without hovering.

RSI Divergence + Hidden RSI Divergence + Hidden (TV-like pairing, final)
What it does
This indicator plots RSI and automatically detects both regular and hidden divergences by pairing RSI pivots with price pivots. It supports a TradingView-like loose pairing (within a user-defined bar tolerance) and a strict same-bar pairing. Detected signals are drawn with lines and optional labels on the RSI pane for quick visual verification.
Divergence logic
Regular Bullish (label: Bull)
Price makes a lower low while RSI makes a higher low → potential upward reversal.
Regular Bearish (label: Bear)
Price makes a higher high while RSI makes a lower high → potential downward reversal.
Hidden Bullish (label: H_Bull)
Price makes a higher low while RSI makes a lower low → trend-continuation bias upward.
Hidden Bearish (label: H_Bear)
Price makes a lower high while RSI makes a higher high → trend-continuation bias downward.
All conditions use pivot-to-pivot comparisons with optional equality tolerance for price and RSI to reduce false “equal” mismatches.
Pairing modes
TV-like
Pairs the latest price and RSI pivots if their pivot bars occur within ±tolBars.
A lightweight “pending” buffer allows pairing a newly detected pivot with a recent opposite pivot that arrived a few bars earlier/later (within tolerance).
Same Bar
Price and RSI pivots must occur on the exact same bar to form a pair.
Key inputs
RSI Source & Length: srcRsi, rsiLen (default 14). RSI line and reference levels (70/50/30) can be shown/hidden.
Pivot Window: leftBars, rightBars for both price and RSI pivots.
Pairing: pairMode = TV-like or Same Bar; tolBars for bar tolerance (TV-like only).
Price Pivot Basis: priceMode = High/Low (default) or Close.
Equality Tolerance:
allowEqual (use >=/<=),
priceEpsTks (ticks) for price equality slack,
rsiEps (points) for RSI equality slack.
Visibility: showRSI, showRegular, showHidden, showLabels.
Visuals
Lines (on RSI):
Regular Bearish: red
Regular Bullish: lime
Hidden Bearish: orange
Hidden Bullish: teal
Labels (optional): "Bear", "Bull", "H_Bear", "H_Bull" placed on the RSI series at the second pivot.
Alerts
Four alert conditions are provided and fire when the corresponding divergence is confirmed:
Bear (Regular)
Bull (Regular)
H_Bear (Hidden)
H_Bull (Hidden)
Notes & tips
Divergences are evaluated only when both price and RSI pivots exist and can be paired under the selected mode.
Pivot sensitivity: smaller leftBars/rightBars → earlier but noisier signals; larger values → fewer, more stable pivots.
Tolerance: If you miss valid setups because pivots land a few bars apart, use TV-like with a small tolBars (e.g., 1–2). If you prefer stricter confirmation, use Same Bar.
Equality slack: Use priceEpsTks and rsiEps to avoid rejecting near-equal highs/lows due to tiny differences.
Works on any symbol/timeframe; as with all divergence tools, treat signals as context—combine with trend, structure, and risk management.

RSI Divergence LiquidityRSI Divergence Liquidity is an indicator designed to help you catch high-probability BUY reversals by combining two powerful concepts:
OANDA:XAUUSD
Liquidity Sweep / Swing Low: automatically marks swing-low levels and tracks when price sweeps below them and reacts back.
Bullish RSI Divergence: filters noise by comparing RSI at the swing area versus RSI at the retest, favoring reversals with stronger momentum confirmation.
How it works
The script draws Swing Low lines using Pivot Lows. When a new Swing Low forms, the previous one is cut/frozen .
When price retests a Swing Low and the candle conditions are met (bar n bullish, bar n-1 bearish), the script checks:
Whether RSI at n/n-1 is higher than the RSI at the swing (bullish divergence logic)
Whether min RSI at the swing is below a threshold (default < 36) to focus on oversold swing areas
If all conditions pass, the indicator prints an upward triangle right when bar n closes → a potential BUY signal.
How to use
Enter BUY when an up triangle appears at/near the Swing Low (liquidity sweep zone).
Stop Loss idea: below the most recent swing low / below the sweep wick.
Take Profit idea: nearest supply zone, prior high, or fixed RR such as 1:2 / 1:3 depending on your system.
Recommended settings
Best on: M5–H1 (depending on your style), especially effective when price is trending down and performs a clear sweep.
For stricter filtering: lower Max minRSI at Swing (x) to only take signals from deeper RSI lows.
Smaller Pivot Lookback → more swings/signals; larger values → fewer but cleaner swings.
Note: This tool improves probability, not certainty. Combine it with market structure / key levels and proper risk management for best results.


RSI Divergence on 4-Hour with 1hr & 15min CorrectionRSI Divergence on 4-hr chart viewed on the hourly chart, watch hourly and 15min rsi levels interact with correction of the 4 hr rsi divergence.

RSI Divergence v6RSI Divergence Band (Close inside High/Low)
This indicator is an advanced RSI visualization designed to show real-time momentum dynamics inside a controlled RSI range.
Unlike the standard RSI, this script builds a dynamic RSI band based on RSI calculated from High and Low prices, while ensuring that RSI based on Close always stays inside the band.
🔹 How it works
RSI is calculated separately for:
Close price (main signal line)
High price
Low price
The High/Low RSI values form a dynamic envelope
The band is automatically adjusted so the RSI Close line is always inside it
All values update on the live bar as price changes
🔹 Why this is useful
Visualizes intrabar pressure and volatility
Helps identify compression and expansion of momentum
Improves divergence analysis
Especially useful for scalping and short-term trading
🔹 Features
RSI length customization
Optional High/Low RSI band
Adjustable RSI levels (20 / 50 / 80 by default)
Clean and minimal visual design
No repainting on closed bars
🔹 Best use cases
Divergence trading
Momentum analysis
Scalping strategies
Market structure confirmation

RSI DivergenceRSI DIVERGENCE is a difference between a fast and a slow RSI. Default values are 5 for the fast one and 14 for the slow one.
You can use this indicator in 2 different ways:
normal RSI : check double or triple top/bottom on a chart meanwhile RSI is descending/ascending (check the example on chart)
signal line : when RSI Divergence cross zero line from bottom to top you get a buy signal (the line become green), vice versa when the RSI Divergence cross zero line in the opposite way you get a sell signal (the line become red)

RSI Divergence Indicator with closingRSI Divergence Indicator with Closing Line is an advanced momentum-analysis tool that combines Regular Divergence, Hidden Divergence, Multi-RSI comparison, Moving Averages, and a dynamic RSI Closing Line into one powerful oscillator panel.
This script is designed for traders who want deeper insight into momentum strength, trend exhaustion, and reversal zones by analyzing both price action and RSI structure.
RSI Divergence on Daily with 4hr & 1hr CorrectionRSI Divergence on Daily chart viewed in 4 hr timeframe to identifty 4 hr/1hr rsi corrections inside of the identified, Daily RSI level (source high)

RSI Divergence 2.0RSI Divergence script will paint green or red lines depending on which way the asset is moving. The code is accessible and can be viewed. I have added alerts and the ability to change the source for slow and fast RSI values.
I have yielded better results using OHLC4 rather than the regular closing candles. As you can see it is working well with COINBASE:BTCUSD and works on all timeframes.
Best of luck!

RSI Divergence Overlay with BGRSI Divergence Overlay with Bullish (Green) and Bearish (Red) notations

RSI Divergence ProjectionRSI Divergence Projection
Go beyond traditional, lagging indicators with this advanced RSI Divergence tool. It not only identifies four types of confirmed RSI divergence but also introduces a unique, forward-looking engine. This engine spots potential divergences as they form on the current candle and then projects the exact price threshold required to validate them.
Our core innovation is the Divergence Projection Line, a clean, clutter-free visualization that extends this calculated price target into the future, providing a clear and actionable level for your trading decisions.
The Core Logic: Understanding RSI Divergence
For those new to the concept, RSI Divergence is a powerful tool used to spot potential market reversals or continuations. It occurs when the price of an asset is moving in the opposite direction of the Relative Strength Index (RSI). This indicator automatically detects and plots four key types:
Regular Bullish Divergence: Price prints a lower low, but the RSI prints a higher low. This often signals that bearish momentum is fading and a potential reversal to the upside is near.
Hidden Bullish Divergence: Price prints a higher low, but the RSI prints a lower low. This is often seen in an uptrend and can signal a continuation of the bullish move.
Regular Bearish Divergence: Price prints a higher high, but the RSI prints a lower high. This suggests that bullish momentum is weakening and a potential reversal to the downside is coming.
Hidden Bearish Divergence: Price prints a lower high, but the RSI prints a higher high. This is often seen in a downtrend and can signal a continuation of the bearish move.
Confirmed divergences are plotted with solid-colored lines on the price chart and marked with a "B" (Bearish/Bullish) or "HB" (Hidden Bearish/Hidden Bullish) label.
The Core Innovation: The Divergence Projection
This is where the indicator truly shines and sets itself apart. Instead of waiting for a pivot point to be confirmed, our engine analyzes the current, unclosed candle.
Potential Divergence Detection: When the indicator notices that the current price and RSI are setting up for a potential divergence against the last confirmed pivot, it will draw a dashed line on the chart. This gives you a critical head-start before the signal is confirmed.
The Projection Line (Our Innovation): This is the game-changer. Rather than cluttering your chart with messy labels, the indicator calculates the exact closing price the next candle needs to achieve to make the current RSI level equal to the RSI of the last pivot.
It then projects a clean, horizontal dashed line at this price level into the future.
Attached to the end of this line is a single, consolidated label that tells you the type of potential divergence and the exact threshold price.
This unique visualization transforms a vague concept into a precise, actionable price target, completely free of chart clutter.
How to Use This Indicator
1. Trading Confirmed Divergences:
Look for the solid lines and the "B" or "HB" labels that appear after a candle has closed and a pivot is confirmed.
A Regular Bullish divergence can be an entry signal for a long position, often placed after the confirmation candle closes.
A Regular Bearish divergence can be an entry signal for a short position.
Hidden Divergences can be used as confirmation to stay in a trade or to enter a trade in the direction of the prevailing trend.
2. Using the Divergence Projection for a Tactical Advantage:
When a dashed line appears on the current price action, you are seeing a potential divergence in real-time.
Look to the right of the current candle for the Projection Line. The price level of this line is your key level to watch.
Example (Potential Bullish Divergence): You see a dashed green line forming from a previous low to the current lower low. To the right, you see a horizontal line projected with a label: "Potential Bull Div | Thresh: 10,750.50".
Interpretation: This means that if the next candle closes below 10,750.50, the RSI will not be high enough to form a divergence. However, if the price pushes up and the next candle closes above 10,750.50, the bullish divergence remains intact and is more likely to be confirmed. This gives you a concrete price level to monitor for entry or exit decisions.
How the Projection Engine Works: A Deeper Dive
To fully trust this tool, it's helpful to understand the logic behind it. The projection engine is not based on guesswork or repainting; it's based on a precise mathematical reverse-engineering of the RSI formula.
The Concept: The engine calculates the "tipping point." The Threshold Price is the exact closing price at which the new RSI value would be identical to the RSI value of the previous pivot point. It answers the question: "For this potential divergence to remain valid, where does the next candle need to close?"
The Technicals: The script takes the target RSI from the last pivot, reverse-engineers the formula to find the required average gain/loss ratio, and then solves for the one unknown variable: the gain or loss needed on the next candle. This required price change is then added to or subtracted from the previous close to determine the exact threshold price.
This calculation provides the precise closing price needed to hit our target, which is then plotted as the clean and simple Projection Line on your chart.
Features and Customization
- RSI Settings: Adjust the RSI period and source.
- Divergence Detection: Fine-tune the pivot lookback periods and the min/max range for detecting divergences.
- Price Source: Choose whether to detect divergences using candle Wicks or Bodies.
- Display Toggles: Enable or disable any of the four divergence types, as well as the entire projection engine, to keep your chart as clean as you need it.
Summary of Advantages
- Proactive Signals: Get ahead of the market by seeing potential divergences before they are confirmed.
- Unprecedented Clarity: Our unique Projection Line eliminates chart clutter from overlapping labels.
- Actionable Data: The threshold price provides a specific, objective level to watch, removing guesswork.
- Fully Customizable: Tailor the indicator's settings to match any timeframe or trading strategy.
- All-in-One Tool: No need for a separate RSI indicator; everything you need is displayed directly and cleanly on the price action.
We hope this tool empowers you to make more informed and timely trading decisions. Happy trading

RSI Divergences on price chart - Open Source CodeHello Traders,
I have some exciting news to share with you all! Recently, I came across an incredible RSI divergences indicator developed by Socrate_FR. This indicator, in my opinion has an exceptional accuracy in detecting RSI divergences. However, during my exploration of other indicators in the TradingView library that display signals on the price chart, I found that many of them were often unreliable and missed out on important divergences.One such example is the Prices / RSI Divergences Detector by vtllr. Although vtllr did an amazing job with the indicator, I noticed that it didn't capture several relevant divergences accurately.
This observation inspired me to enhance the most accurate RSI divergences indicator available by showcasing the signals directly on the price chart. By doing so, I aimed to address the issue of unreliable and missed divergences in other price chart indicators. With this enhanced version, you can now effortlessly identify and track RSI regular divergences on the price chart itself:
-Regular bullish divergence occurs when the price forms lower lows while the RSI indicator forms higher lows. It suggests a potential bullish reversal (green line plot)
-Regular bearish divergence occurs when the price forms higher highs while the RSI indicator forms lower highs. It suggests a potential bearish reversal (red line plot)
Another key mofication:
This Indicator introduces a simpler approach compared to the original Socrate indicator. While Socrate differentiated divergences into eight types for both bullish and bearish scenarios, our enhanced version focuses on two distinct categories: small and big divergences. This decision was made to provide a clearer and more user-friendly experience. By condensing the divergence types into two groups, traders can easily identify and analyze the significance of the divergences without getting overwhelmed by excessive variations. The small divergences represent relatively minor divergences, while the big divergences indicate stronger and more significant signals.
-Small divergences represent relatively minor divergences (plotshape small circle)
-Big divergences indicate stronger signals (plotshape big circle)
I firmly believe that this enhanced RSI Divergences Indicator will be an invaluable tool for traders who rely on RSI analysis in their trading strategies. It combines the accuracy of Socrate_FR's original indicator with the enhanced visibility of signals on the price chart, ensuring you never miss any important divergences.
If you're interested in trying out this enhanced version of the indicator, please feel free to access the open-source code. If you want to visit and try the original version of the code visit Socrate_FR profile.
www.tradingview.com
Keep attention!
It is important to note that no trading indicator or strategy is foolproof, and there is always a risk of losses in trading. While this indicator may provide useful information for making conclusions, it should not be used as the sole basis for making trading decisions. Traders should always use proper risk management techniques and consider multiple factors when making trading decisions.
Support us:)
If you find this new indicator helpful in your trading analysis, I would greatly appreciate your support! Please consider to follow, giving it a like, leaving feedback, or sharing it with your trading network. Your engagement will not only help me improve this tool but will also help other traders discover it and benefit from its features. Thank you for your support!

RSI Divergence StrategyOverview
The RSI Divergence Strategy Indicator is a trading tool that uses the RSI and divergences created to generate high-probability buy and sell signals.
I have provided the best formula of numbers to use for BTC on a 30 minute timeframe.
You can change where on RSI you enter and exit both long or short trades. This way you can experiment on different tokens using different entry/exit points. Can use on multiple timeframes.
This strategy is designed to open and close long or short trades based on the levels you provide it. You can then check on the RSI where the best levels are for each token you want to trade and amend it as required to generate a profitable strategy.
How It Works
The RSI Divergence Strategy Indicator uses bear and bull divergences in conjuction with a level you have input on the RSI.
RSI for Overbought/Oversold:
• Input variables for entry and exit levels and when the entry levels combine with a bear or bull divergence signal, a trade is alerted.
RSI Divergence:
• Buy and sell signals are confirmed when the RSI creates bearish or bullish divergences and these divergences are in the same area as your levels you input for entry to short or long.
After 7 years of experience and testing I have calculated the exact numbers required and produced a formula to calculate the exact input variables for a 30 minute Bitcoin chart.
Key Features
1️⃣ Divergence Identification – Ensures trades are taken only when a bull or bear divergence has formed.
2️⃣ Overbought/Oversold Input Filtering – Set up your own variables on the RSI for different markets after identifying patterns on the RSI in relation to a bearish or bullish divergence.
3️⃣ Works on any chart – Suitable for all markets and timeframes once you input the correct variables for entry and exit levels.
How to Use
🟢 Basic Trading:
• Use on any timeframe.
• Enter trade only when alert has fired off. Close when it says to exit.
• Change entry and exit levels in the properties of the strategy indicator.
• Make entry and exit levels coincide with bearish or bullish divergences on the RSI.
Check the strategy tester to see backtesting so you know if the indicator is profitable or not for that market and timeframe as each crypto token is different and so is the timeframe you choose.
📢 Webhook Automation:
• Set up TradingView Alerts to auto-execute trades via Webhook-compatible platforms.
Key additions for divergence visualization:
Divergence Arrows:
Bullish divergence: Green label with white 'bull ' text
Bearish divergence: Red label with white 'bear' text
Positioned at the pivot point
Divergence Lines:
Connects consecutive RSI pivot points
Automatically drawn between consecutive pivot points
Enhanced RSI Coloring:
Overbought zone: Red
Oversold zone: Green
Neutral zone: Gray
The visualization helps you instantly spot:
Where divergences are forming on the RSI
The pattern of higher lows (bullish) or lower highs (bearish)
Contextual coloring of RSI relative to standard levels
All divergence markers appear at the correct historical pivot points, making it easy to visually confirm divergence patterns as they develop.
Strategy levels and background zones also shown to help visual look.
Why This Combination?
This indicator is just a simple RSI tool.
It is designed to filter out weak trades and only execute trades that have:
✅ RSI Divergence
✅ Overbought or Oversold Conditions
It does not calculate downtrends or bear markets so care is recommended taking long trades during these times.
Why It’s Worth Using?
📈 Open Source – Free to use and learn from.
📉 Long or Short Term Trading Style – Entry/Exit parameters options are designed for both short or long term trades allowing you to experiment until you find a profitable strategy for that market you want to trade.
📢 Seamless Webhook Automation – Execute trades automatically with TradingView alerts.
💲 Ready to trade smarter?
✅ Add the RSI Divergence Strategy Indicator to your TradingView chart.

RSI Divergence + Sweep + Signal + Alerts Toolkit [TrendX_]The RSI Toolkit is a powerful set of tools designed to enhance the functionality of the traditional Relative Strength Index (RSI) indicator. By integrating advanced features such as Moving Averages, Divergences, and Sweeps, it helps traders identify key market dynamics, potential reversals, and newly-approach trading stragies.
The toolkit expands on standard RSI usage by incorporating features from smart money concepts (Just try to be creative 🤣 Hope you like it), providing a deeper understanding of momentum, liquidity sweeps, and trend reversals. It is suitable for RSI traders who want to make more informed and effective trading decisions.
💎 FEATURES
RSI Moving Average
The RSI Moving Average (RSI MA) is the moving average of the RSI itself. It can be customized to use various types of moving averages, including Simple Moving Average (SMA), Exponential Moving Average (EMA), Relative Moving Average (RMA), and Volume-Weighted Moving Average (VWMA).
The RSI MA smooths out the RSI fluctuations, making it easier to identify trends and crossovers. It helps traders spot momentum shifts and potential entry/exit points by observing when the RSI crosses above or below its moving average.
RSI Divergence
RSI Divergence identifies discrepancies between price action and RSI momentum. There are two types of divergences: Regular Divergence - Indicates a potential trend reversal; Hidden Divergence - Suggests the continuation of the current trend.
Divergence is a critical signal for spotting weakness or strength in a trend. Regular divergence highlights potential trend reversals, while hidden divergence confirms trend continuation, offering traders valuable insights into market momentum and possible trade setups.
RSI Sweep
RSI Sweep detects moments when the RSI removes liquidity from a trend structure by sweeping above or below the price at key momentum level crossing. These sweeps are overlaid on the RSI chart for easier visualized.
RSI Sweeps are significant because they indicate potential turning points in the market. When RSI sweeps occur: In an uptrend - they suggest buyers' momentum has peaked, possibly leading to a reversal; In a downtrend - they indicate sellers’ momentum has peaked, also hinting at a reversal.
(Note: This feature incorporates Liquidity Sweep concepts from Smart Money Concepts into RSI analysis, helping RSI traders identify areas where liquidity has been removed, which often precedes a trend reversal)
🔎 BREAKDOWN
RSI Moving Average
How MA created: The RSI value is calculated first using the standard RSI formula. The MA is then applied to the RSI values using the trader’s chosen type of MA (SMA, EMA, RMA, or VWMA). The flexibility to choose the type of MA allows traders to adjust the smoothing effect based on their trading style.
Why use MA: RSI by itself can be noisy and difficult to interpret in volatile markets. Applying moving average would provide a smoother, more reliable view of RSI trends.
RSI Divergence
How Regular Divergence created: Regular Divergence is detected when price forms HIGHER highs while RSI forms LOWER highs (bearish divergence) or when price forms LOWER lows while RSI forms HIGHER lows (bullish divergence).
How Hidden Divergence created: Hidden Divergence is identified when price forms HIGHER lows while RSI forms LOWER lows (bullish hidden divergence) or when price forms LOWER highs while RSI forms HIGHER highs (bearish hidden divergence).
Why use Divergence: Divergences provide early warning signals of a potential trend change. Regular divergence helps traders anticipate reversals, while hidden divergence supports trend continuation, enabling traders to align their trades with market momentum.
RSI Sweep
How Sweep created: Trend Structure Shift are identified based on the RSI crossing key momentum level of 50. To track these sweeps, the indicator pinpoints moments when liquidity is removed from the Trend Structure Shift. This is a direct application of Liquidity Sweep concepts used in Smart Money theories, adapted to RSI.
Why use Sweep: RSI Sweeps are created to help traders detect potential trend reversals. By identifying areas where momentum has exhausted during a certain trend direction, the indicator highlights opportunities for traders to enter trades early in a reversal or continuation phase.
⚙️ USAGES
Divergence + Sweep
This is an example of combining Devergence & Sweep in BTCUSDT (1 hour)
Wait for a divergence (regular or hidden) to form on the RSI. After the divergence is complete, look for a sweep to occur. A potential entry might be formed at the end of the sweep.
Divergences indicate a potential trend change, but confirmation is required to ensure the setup is valid. The RSI Sweep provides that confirmation by signaling a liquidity event, increasing the likelihood of a successful trade.
Sweep + MA Cross
This is an example of combining Devergence & Sweep in BTCUSDT (1 hour)
Wait for an RSI Sweep to form then a potential entry might be formed when the RSI crosses its MA.
The RSI Sweep highlights a potential turning point in the market. The MA cross serves as additional confirmation that momentum has shifted, providing a more reliable and more potential entry signal for trend continuations.
DISCLAIMER
This indicator is not financial advice, it can only help traders make better decisions. There are many factors and uncertainties that can affect the outcome of any endeavor, and no one can guarantee or predict with certainty what will occur. Therefore, one should always exercise caution and judgment when making decisions based on past performance.

RSI Divergence - Left Candles Onlyrsi
The **RSI Divergence** indicator in this script is designed to highlight **divergence** between the **Relative Strength Index (RSI)** and **price action** on a chart. Divergence can be a key signal for potential trend reversals or continuation in technical analysis.
### **Key Components of the Indicator:**
1. **RSI Calculation:**
- The **Relative Strength Index (RSI)** is calculated using a typical 14-period length, but the user can customize this input.
- RSI is a momentum oscillator that measures the speed and change of price movements, oscillating between 0 and 100. Values above 70 indicate overbought conditions, and values below 30 indicate oversold conditions.
2. **Divergence Logic:**
- **Bullish Divergence:** Occurs when the price forms a **lower low**, but the RSI forms a **higher low**. This suggests that despite price continuing to drop, momentum (RSI) is strengthening, which may indicate a potential price reversal to the upside.
- **Bearish Divergence:** Occurs when the price forms a **higher high**, but the RSI forms a **lower high**. This indicates that even though price is rising, the momentum (RSI) is weakening, which could signal a price reversal to the downside.
3. **Pivot Identification:**
- The script identifies **pivot points** (local highs and lows) on both price and RSI.
- **Bullish Divergence:** A lower price low with a higher RSI low.
- **Bearish Divergence:** A higher price high with a lower RSI high.
4. **Lookback Periods:**
- **Lookback Left (lookbackLeft):** Defines the number of bars to look back for pivot confirmation. This allows for adjusting the sensitivity of the divergence.
- The **divergence range** is constrained by two parameters:
- **Minimum range (rangeLower):** The minimum number of bars for divergence to be considered.
- **Maximum range (rangeUpper):** The maximum number of bars for divergence to be considered.
5. **Signal Generation and Plotting:**
- When a **bullish divergence** is detected, a **green label** is plotted below the bar where the divergence occurs.
- When a **bearish divergence** is detected, a **red label** is plotted above the bar.
- The script uses **`plotshape()`** to plot these labels on the chart.
6. **Alerts:**
- Alerts are configured for both **bullish** and **bearish divergences** so that you can be notified when a divergence signal occurs.
---
### **How the Indicator Works:**
- The RSI and price action are compared using **pivots**: The script checks whether the price and RSI are forming new highs or lows within the specified **lookback period**.
- If the conditions for divergence (higher/lower RSI pivot vs price pivot) are met, a signal is plotted on the chart.
- The script helps to visually identify potential reversal points and allows users to set alerts for these divergence signals.
---
### **Use Case:**
- This script is useful for traders looking to trade potential trend reversals based on **divergence** between price and RSI.
- **Bullish divergence** can indicate a **buy** opportunity, while **bearish divergence** can suggest a **sell** opportunity.
- The indicator works best in **volatile markets** and when combined with other technical analysis tools for confirmatio