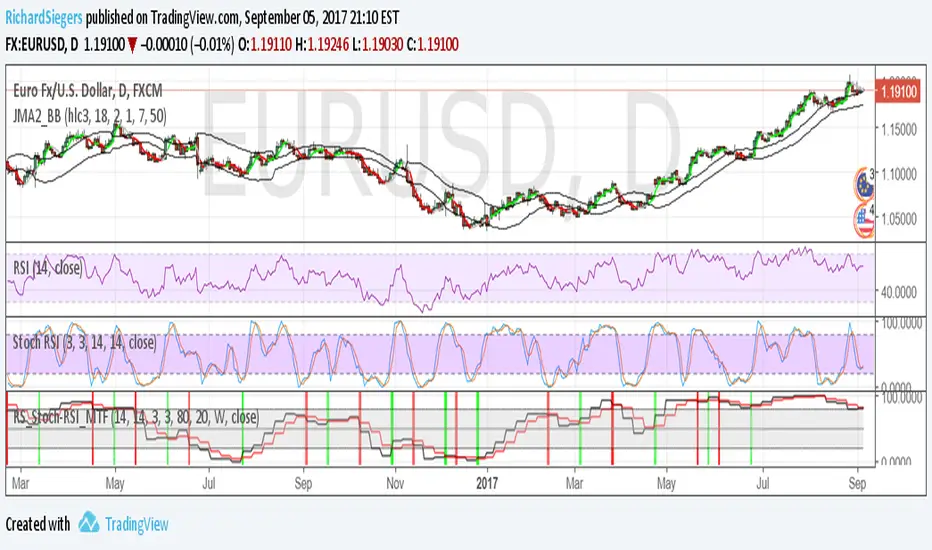
RS_Stoch-RSI_MTFmodification by Richard Siegers that turned stochastic mtf from ChrisMoody into stochastic-rsi mtfPenunjuk Pine Script®oleh RichardSiegersTelah dikemas kini 33218
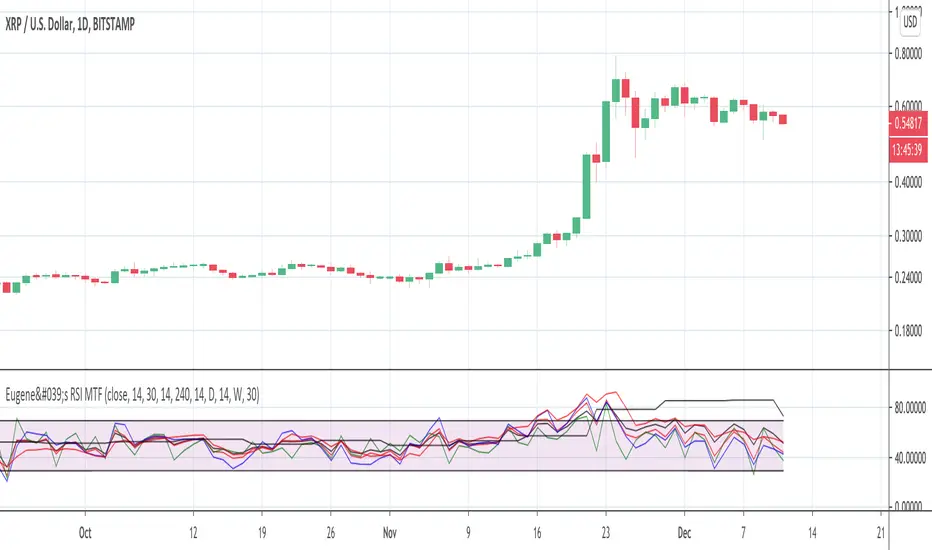
Eugene's RSI MTFFeel free to use this Multi Time Frame RSI indicator. You can select up to 4 time frames. You can plot either each of them or the average of all 4 or the faster 3. Enjoy. Please leave a like if it is useful to you.Penunjuk Pine Script®oleh habekeinenTelah dikemas kini 3345
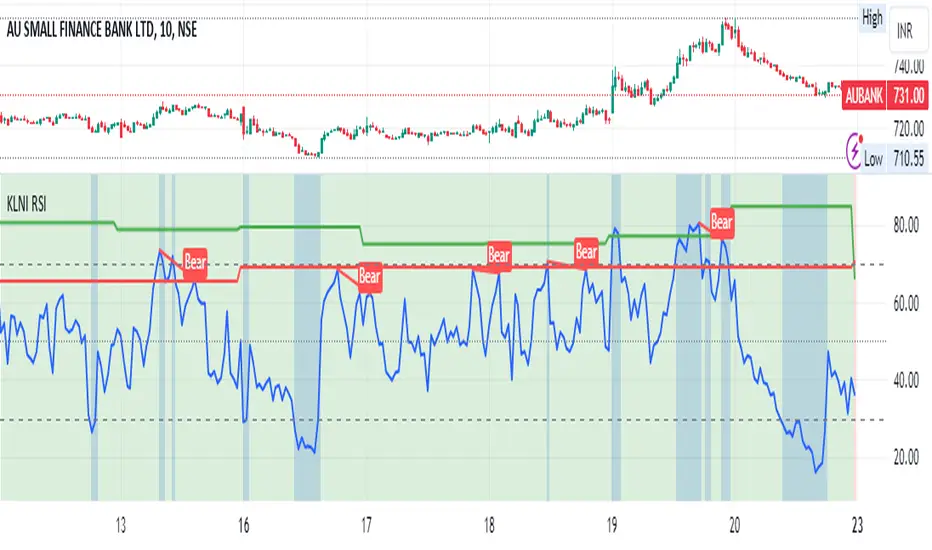
KLNI RSI MTFDescription of the RSI Multi-Timeframe Indicator The RSI Multi-Timeframe Indicator allows you to track and compare the Relative Strength Index (RSI) across three different timeframes on the same chart. This is particularly useful for traders who want to gauge the momentum of an asset over multiple time periods simultaneously, helping to make more informed trading decisions. Key Features Multi-Timeframe RSI: You can select up to three timeframes to plot RSI on the same chart. Available timeframe options include: Current: Displays RSI for the current chart timeframe. 60 minutes (1 hour) Daily Weekly Monthly Custom RSI Settings: Adjust the RSI length and source (e.g., close price) through user inputs, allowing you to tailor the indicator to your strategy. Divergence Detection (Optional): The indicator can optionally detect and display bullish and bearish divergences between price and RSI for the first selected timeframe. Bullish divergence is shown when price makes a lower low, but RSI makes a higher low. Bearish divergence is shown when price makes a higher high, but RSI makes a lower high. Visual Aids: Overbought and oversold RSI levels are highlighted with background colors for clarity. Horizontal lines at 70 (overbought), 50 (neutral), and 30 (oversold) help quickly identify RSI conditions. How to Use This Indicator Inputs & Settings Timeframe Settings: First Timeframe: Choose the primary timeframe (e.g., 60 minutes, Daily, Weekly). Second Timeframe: Select the second timeframe to plot on the chart. Third Timeframe: Select the third timeframe for additional RSI analysis. RSI Settings: RSI Length: Set the period for RSI calculation (default: 14). Source: Select the price data for RSI calculation (default: close price). Show Divergence: Enable or disable the detection of divergence between price and RSI. Plotting on Chart The indicator will display three distinct RSI plots for the selected timeframes: RSI TF1 (blue line) for the first timeframe. RSI TF2 (green line) for the second timeframe. RSI TF3 (red line) for the third timeframe. Each RSI line corresponds to its chosen timeframe, allowing you to see how RSI behaves across different time periods. Reading the RSI Values Overbought: When RSI is above 70, the asset is considered overbought, potentially signaling a sell or short entry. Oversold: When RSI is below 30, the asset is considered oversold, possibly indicating a buying opportunity. Neutral: RSI around 50 is neutral and may suggest a lack of clear momentum. Divergence Detection If enabled, the indicator will highlight points of divergence: Bullish Divergence: A green label will appear below the chart where price is making lower lows, but RSI is making higher lows, suggesting potential bullish momentum. Bearish Divergence: A red label will appear when price is making higher highs, but RSI is making lower highs, indicating potential bearish pressure. Practical Applications Momentum Confirmation: Use this indicator to confirm the strength of a trend by comparing RSI across multiple timeframes. For example, if RSI is above 50 on all three timeframes, it may confirm strong upward momentum. Overbought/Oversold Signals: When RSI is overbought on multiple timeframes, it could signal an impending reversal or correction. Conversely, oversold conditions across timeframes might indicate a buy opportunity. Divergence Detection: Spot divergence between price and RSI to identify potential trend reversals early. Divergence can provide early signals of changing market momentum. Summary This indicator is a powerful tool for multi-timeframe RSI analysis, helping traders understand momentum shifts across different timeframes. It offers customizability, divergence detection, and visual aids to streamline your technical analysis and decision-making process.Penunjuk Pine Script®oleh siddanagouda26
AP_Ultimate CCI MTF v5**AP Ultimate CCI Multi-Timeframe Indicator** *Track Commodity Channel Index trends across multiple timeframes in one view!* **Overview:** Adapted from ChrisMoody's popular RSI MTF concept, this enhanced version brings powerful multi-timeframe analysis to the CCI indicator. Perfect for traders who want to confirm trends across different time horizons without switching charts. **Key Features:** 📈 **Dual CCI Analysis** - Primary CCI (Default: 1H) + Secondary CCI (Default: 4H) - Fully customizable timeframes for both indicators - Independent length settings (14-50 periods recommended) 🚦 **Visual Trading Signals** - Automatic Buy/Sell markers on crossovers - 🟢 **B** Signals: When CCI crosses above -100 (Oversold reversal) - 🔴 **S** Signals: When CCI crosses below +100 (Overbought reversal) - Clean triangular markers at chart edges for clear visibility 🎨 **Customizable Visuals** - Adjustable overbought/oversold levels (Default: ±100) - Background highlights for extreme zones - Modern color schemes with transparency control - Optional zero line display ⚙️ **Technical Specs** - Built in Pine Script v6 - Non-repainting calculations - Timeframe-aware alerts support - Optimized for all asset classes **How to Use (my use case):** 1. Apply to 15M-4H charts for intraday trading 2. Default setup: Compare 1H vs 4H CCI 3. Look for confluence between timeframes: - Strong trend = Both CCIs moving in same direction - Reversal signal = Crossovers with volume confirmation 4. Combine with price action or support/resistance **Why this Indicator:** ✅ Eliminates manual timeframe switching ✅ Identifies hidden divergences between time horizons ✅ Works equally well for stocks, forex, and crypto ✅ Perfect for momentum and mean-reversion strategies *Pro Tip: Pair with volume indicators and moving averages for enhanced confirmation!* Penunjuk Pine Script®oleh nuipai24
Inverse Fisher RSI-MTFSimple Inverse fisher with MTF function. Penunjuk Pine Script®oleh RafaelZioni44187
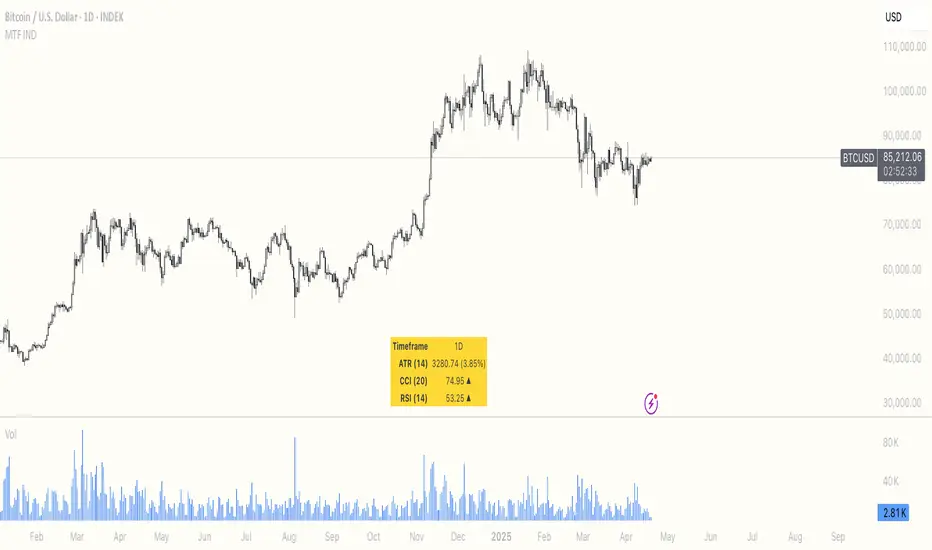
Multi Timeframe ATR, CCI & RSIMulti Timeframe ATR, CCI & RSI (MTF IND) This indicator displays ATR, CCI, and RSI values from a custom selected timeframe in a clean table overlay. It helps monitor volatility and momentum from higher/lower timeframes directly on your current chart. Features: • Select custom timeframe for all indicators (e.g., 1D, 1W, 65m, etc.) • ATR with selectable smoothing type (RMA, SMA, EMA, WMA) • CCI & RSI with trend arrows (▲ rising, ▼ falling, ▬ neutral) • Compact summary tablePenunjuk Pine Script®oleh RustamTaveri22
PowerTrend Pro Strategy – Gold OptimizedTired of false signals on Gold? PowerTrend Pro combines VWAP, Supertrend, RSI, and smart MA filters with trailing stops & break-even logic to deliver high-probability trades on XAUUSD. PowerTrend Pro Strategy is a professional-grade trading system designed to capture high-probability swing and intraday opportunities on XAUUSD (Gold) and other volatile markets. 🔑 Core Features VWAP Anchoring – institutional fair value reference to filter trades. Supertrend (ATR-based) – adaptive trend filter tuned for Gold’s volatility. Multi-Timeframe RSI – confirms momentum alignment across intraday and higher timeframe. EMA + SMA Combo – ensures trades follow strong directional bias, reducing false signals. Dynamic Risk Management Adjustable Take Profit / Stop Loss (%) Trailing Stop that locks in profits on extended moves Break-Even Logic (stop loss moves to entry once price is in profit) ⚡ Gold-Tuned Presets XAUUSD 1H → tighter TP/SL & faster entries for active intraday trading. XAUUSD 4H → wider ATR filter & trailing stops to capture bigger swings. Generic Mode → works on Forex, Indices, and Crypto (fully customizable). 🎯 Why It Works Gold is notoriously volatile — quick spikes wipe out weak strategies. PowerTrend Pro solves this by combining: ✅ Institutional bias (VWAP) ✅ Adaptive trend filter (Supertrend) ✅ Momentum confirmation (RSI MTF) ✅ Robust trend structure (EMA + SMA) ✅ Smart exits (TP, SL, trailing & breakeven) This multi-layer confirmation makes entries stronger and keeps risk under control. 🛠️ Usage Add the strategy to your chart. Choose a preset (XAUUSD 1H, 4H, or Generic). Run Strategy Tester for performance metrics. Optimize TP/SL and ATR values for your broker & market conditions. 🔥 Pro Tip: Combine this strategy with a session filter (London/NY overlap) or volume confirmation to boost accuracy in Gold.Strategi Pine Script®oleh MarkSteve_722147
Master Crypto Overlay [R2D2]The Gemini Master Crypto Overlay: User Guide 1. Introduction The Gemini Master Crypto Overlay is a professional-grade TradingView script designed to consolidate six powerful institutional indicators into a single, clean "heads-up display" (HUD). Instead of cluttering your chart with multiple sub-windows (which shrinks your view of the price), this script uses smart overlays and a data dashboard to provide actionable data instantly. It is optimized for the Daily timeframe as requested, but functions on all timeframes. Included Indicators: Ichimoku Cloud: Identifies the primary trend and support/resistance zones. MACD (Custom Crypto Settings): Optimized (3-10-16) for catching fast crypto moves. WaveTrend Oscillator: Visual signals for Overbought/Oversold entries. Supertrend: A trailing stop-loss line to keep you in profitable trades. Ultimate RSI (MTF): Multi-timeframe analysis to ensure you are trading with the higher trend. Volume Reference (VWAP): An on-chart proxy for Volume Profile to spot fair value. 2. Installation Instructions Step 1: Open Pine Editor Launch your chart on TradingView. At the bottom of the screen, click the tab labeled Pine Editor. Step 2: Paste the Code Delete any text currently in the editor window. Copy the code block at the bottom of this response. Paste it into the editor. Step 3: Save and Add Click "Save" (top right of the editor) and name it "Master Crypto Overlay". Click "Add to chart". Note: You may hide the "Pine Editor" panel now by clicking the arrow at the bottom center of the screen. 3. How to Use the Interface The script is designed to be intuitive. Here is what you are looking at: A. The Dashboard (Bottom Right) This is your "Confluence Checker." It summarizes the status of the major indicators in real-time. GREEN: Bullish (Buy/Hold) RED: Bearish (Sell/Short) GRAY: Neutral/Choppy (Stay out) Pro Tip: Do not enter a trade unless at least 3 out of 4 signals on the dashboard match your direction. B. On-Chart Signals Clouds (Red/Green): If the cloud is Green and rising, only look for Long trades. If Red, only look for Short trades. Supertrend Line: This continuous line trails the price. If price is above it (Green line), you are safe. If price closes below it, the trend has reversed. MACD Labels: Small "MACD" text appears when momentum flips. WaveTrend Circles: Blue Circle (Bottom): Price is "Oversold." Good time to buy if the trend is up. Orange Circle (Top): Price is "Overbought." Good time to take profit. 4. Strategy: Maximizing Trading Returns To make money with this script, you need a rule-based system. Do not just blindly click when you see a label. Use this "Trend & Trigger" strategy: The "Golden Entry" (High Probability Long) Trend Check: Ensure price is ABOVE the Ichimoku Cloud. Dashboard Check: Verify the RSI Status says "BULL (>50)". The Trigger: Wait for a pullback where price touches the Supertrend Line (Green) or the top of the Cloud. The Entry: Enter the trade when a Blue WaveTrend Circle appears OR a MACD Buy Label prints. Stop Loss: Place your stop loss slightly below the Supertrend line. The "Exit Strategy" (Protecting Profits) Conservative: Sell half your position when an Orange WaveTrend Circle appears. Trend Follower: Hold the rest of your position until the Supertrend Line turns RED. Penunjuk Pine Script®oleh R2D2_4Life8
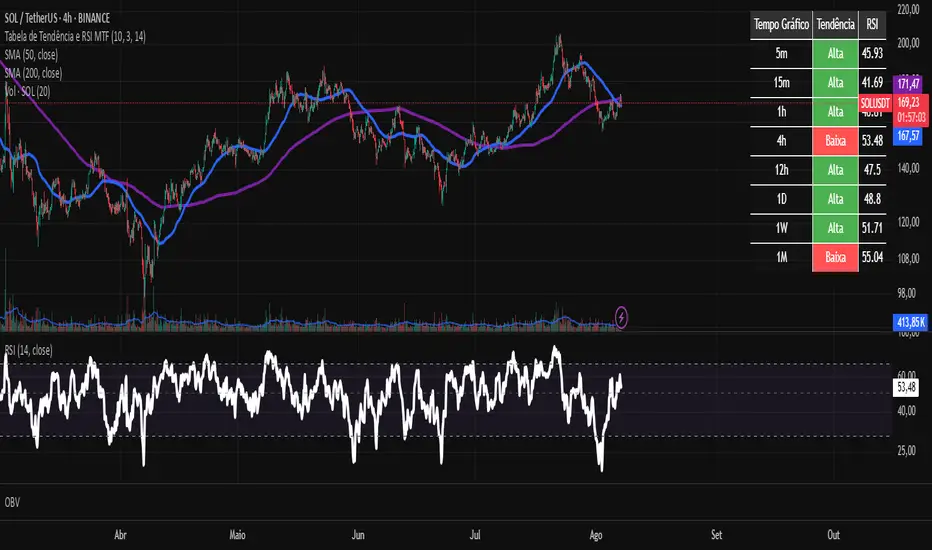
Tabela de Tendência e RSI MTF - PCThis custom TradingView indicator provides a consolidated view of trend and Relative Strength Index (RSI) across multiple timeframes, all within an intuitive table directly on your chart. Designed for traders seeking quick and efficient analysis of market momentum and direction across different time horizons, this indicator automatically adapts to the asset you are currently viewing.Penunjuk Pine Script®oleh ipedrocatao2210
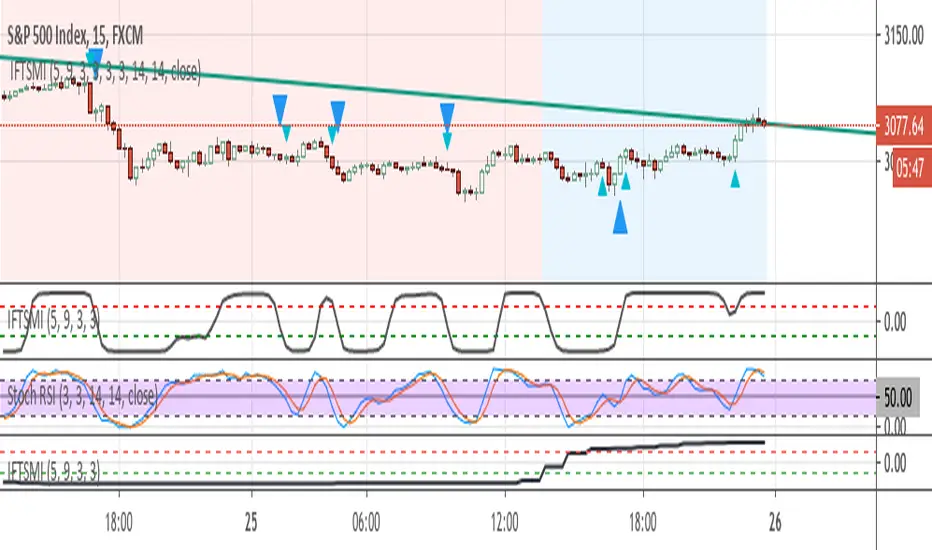
Inverse Fisher Transform of SMI and sto. RSI, MTF confirmedThe system uses 1 hour and 15 min timeframe data. Signals coming from 15 min Inverse Fisher Transform of SMI and stochastic RSI are confirmed by 1 hour Inverse Fisher Transform SMI, according to the following rules: long cond.: 15 min IFTSMI crosses ABOVE -0.5 or SRSI k-line crosses ABOVE 50 while 1-hour IFTSMI is already ABOVE -0.5 short cond.:15 min IFTSMI crosses BELOW 0.5 or SRSI k-line crosses BELOW 50 while 1-hour IFTSMI is already BELOW 0.5 SMI and Inverse Fisher Transform of SMI codes belong to @kivancozbilgic. Penunjuk Pine Script®oleh GurselKona202
CM_Ultimate RSI Triple TimeframeCM_Ultimate RSI MTF modified. enough one extra line? NO, I need more lines! I added another timeframe's extra RSIline. default 60/15/5m RSIlinePenunjuk Pine Script®oleh madoqa347
finding the lowEasy script that give you to find low points in much more effective way ,so it very good to find entry exit can be by fibs , pivot or take profit system etc but the hardest thing in a trade is to locate where the low is found so using this special rsi +mtf system of no repaint it more easy to detect it Penunjuk Pine Script®oleh RafaelZioniTelah dikemas kini 66223
IntelliTrader - RSI - MTF 1m / 5m / 15m / 1h / 4h / 1dlight green = 1m green = 5m light blue = 15m blue = 1h light purple = 4h purple = 1dPenunjuk Pine Script®oleh QuantTherapy116