RSI with SMA + 70/60/50/40/30 LevelsIndicator Name:
RSI with SMA + 70/60/50/40/30 Levels
🧩 Concept Overview:
यह indicator दो popular tools को combine करता है:
RSI (Relative Strength Index) – momentum indicator जो market ke overbought aur oversold zones ko identify karta hai.
SMA (Simple Moving Average) – trend smoother jo RSI ke movement ko average karke lagging confirmation deta hai.
इन दोनों के साथ 70, 60, 50, 40, और 30 की multiple reference lines draw की जाती हैं, ताकि trader को RSI ke swings aur reversals easily samajh aaye.
⚙️ Indicator Components:
RSI Line:
Default Period: 14 (customize kar sakte ho).
Show karta hai price momentum – agar RSI 70 ke upar jaata hai to market overbought zone me hota hai; agar 30 ke niche jaata hai to oversold zone me.
SMA on RSI:
RSI ka smooth version (usually 9-period SMA).
Trend confirmation ke liye – jab RSI line SMA ke upar cross karti hai to bullish signal, aur neeche cross kare to bearish signal.
Horizontal Levels:
70: Overbought zone (potential sell area).
60: Strong bullish momentum line (trend confirmation).
50: Neutral / midline (trend direction flip area).
40: Weak bearish zone (trend losing strength).
30: Oversold zone (potential buy area).
💡 How to Use:
Trend Identification:
RSI > 60 aur SMA ke upar → Bullish trend.
RSI < 40 aur SMA ke neeche → Bearish trend.
Reversal Spotting:
RSI 70 ke upar jaake wapas niche aaye → Sell signal.
RSI 30 ke neeche jaake wapas upar aaye → Buy signal.
Confirmation Using SMA:
RSI cross SMA from below → Confirmed bullish reversal.
RSI cross SMA from above → Confirmed bearish reversal.
Cari dalam skrip untuk "rsi"

RSI Breakout Zones█ OVERVIEW
“RSI Breakout Zones” is a technical analysis tool that identifies significant zones on the chart based on the Relative Strength Index (RSI). The indicator maps overbought (OB) and oversold (OS) zones using boxes, then extends them until the next zone of the same type is detected, highlighting breakout points to aid in trade entry decisions. These zones often serve as areas of consolidation, support, or resistance.
█ CONCEPTS
The indicator identifies overbought (above 70) and oversold (below 30) zones, drawing boxes that extend until the next zone of the same type (OB for OB, OS for OS) is detected. Breakout signals are generated when the price crosses the zone boundaries, indicating potential shifts in market momentum.
Why are RSI zones important? These zones represent areas of extreme market sentiment, often leading to corrections or reversals. Overbought zones suggest potential selling pressure, while oversold zones indicate buying opportunities. After a breakout, a zone may switch roles, e.g., from support to resistance or vice versa, making it a key element in price action analysis. Larger zones, formed during high volatility, may attract price for retests due to stronger imbalances in buyer/seller dynamics. Consolidation often occurs within these zones as the market seeks equilibrium before further moves. However, in strong trends, zones may be decisively broken without immediate pullbacks, and their significance depends on their position relative to key support and resistance levels.
█ FEATURES
- RSI Zone Detection: Calculates RSI with a customizable length (default 14) and identifies overbought/oversold zones based on user-defined levels (default 70/30), drawing boxes that dynamically adjust to price action within the zone.
- Customizable Boxes: Zones extend until the next zone of the same type is detected. The indicator draws zones with adjustable colors for overbought (red) and oversold (green) areas, with options for box and zone transparency.
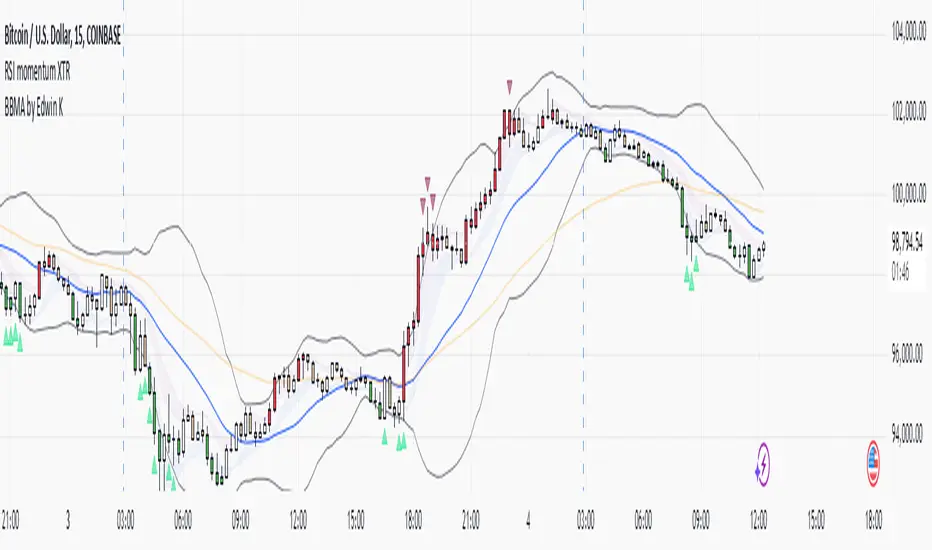
- Breakout Signals: Generates upward (green triangle) and downward (red triangle) breakout signals when the price crosses the top or bottom of a zone. Signals appear below or above the bar, indicating potential trade entry points.
- Midline: Automatically draws a dashed line at the midpoint of each zone, helping traders assess price behavior within the zone and potential halfway retests.
- Box Management: Option to remove outdated boxes.
- Alerts: Built-in support for alerts on breakout signals, enabling traders to receive notifications for key zone crossings.
█ HOW TO USE
Add to Chart: Apply the indicator to your TradingView chart via the Pine Editor or Indicators menu.
Configure Settings:
- RSI Settings: Adjust RSI Length (default 14), Overbought Level (default 70), and Oversold Level (default 30) to tailor zone detection sensitivity—higher lengths smooth signals for longer-term analysis.
- Box Settings: Configure colors and transparency for overbought (red) and oversold (green) zones, including box transparency (default 90) and zone transparency (default 90).
- Signal Settings: Customize breakout signal colors (green for upward, red for downward) and enable/disable keeping boxes after RSI normalization.
Interpreting Signals:
- Upward Breakout Signal: A green triangle below the bar indicates a breakout, suggesting potential bullish momentum and trend continuation or reversal.
- Downward Breakout Signal: A red triangle above the bar indicates a breakout, suggesting potential bearish momentum.
- RSI Zones: If the price re-enters a zone after a breakout, it may signal a false breakout or consolidation; persistent zones can act as future support/resistance levels. Consolidation often occurs within these zones as the market seeks equilibrium.
- Use signals alongside other technical analysis tools for confirmation, such as moving averages (to confirm trend direction), Fibonacci levels (to identify key price zones), or volume indicators (to validate breakout strength). Analyze RSI zones on higher timeframes for stronger signals due to broader market context.
█ APPLICATIONS
- Momentum Trading: Use RSI zones as overbought/oversold filters. In an uptrend, look for buying opportunities on upward breakouts, and in a downtrend, on downward breakouts. Combining with MACD crossovers, Fibonacci levels, or pivot points enhances zone significance.
- Inter-Zone Trading: Utilize breakouts from one RSI zone and hold the position until reaching the next zone, which may act as a target level or reversal point.
█ NOTES
- Test the indicator across different timeframes and markets (stocks, forex, crypto) to optimize RSI length and levels for your trading style.
- For best results, use in trending markets where RSI extremes are more predictive; in ranging markets, additional filters are recommended to reduce false signals.
- Always combine with risk management; RSI zones alone do not guarantee reversals, and false breakouts may occur in low-liquidity environments.

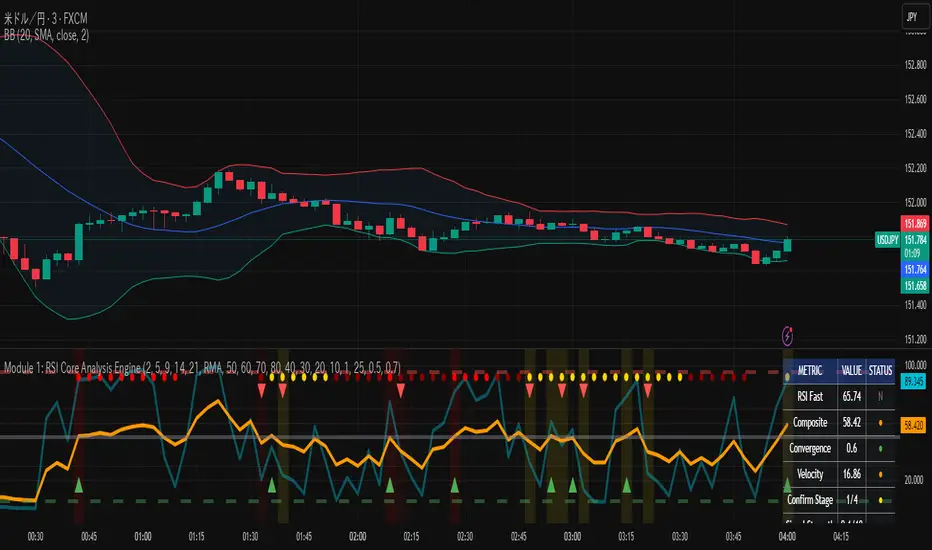
RSI Core Analysis EngineHI traders
This tool employs a higher-sensitivity RSI than conventional settings to capture market shifts earlier.
When the Ultra Fast RSI (UF) approaches upper or lower extremes, short-term profit-taking or pullbacks tend to occur, and a crossover between UF and the Composite RSI can serve as a signal of a regime change.
However, in strong trends the RSI can remain pinned for extended periods, so combine it with ADX, volume, and volatility measures to improve accuracy.
While early detection is an advantage, it also increases noise. This tool uses a four-stage confirmation process (DMI/ADX → MACD/Stochastics/RSI acceleration → five-layer alignment) and quality/confidence scores to filter for higher-expectancy setups.
It will not be effective in every market condition. Use it with predefined stop-losses and prudent position sizing.
-------------------------------------------------------------------------------------------------------
Strongly recommended preset (because the indicator packs many features):
Step 1 — Inputs tab
Center Level: 50
OB1: 60, OB2: 70, OB3: 95
OS1: 40, OS2: 30, OS3: 5
Step 2 — Style tab
✅ Ultra Fast RSI — Thickest
✖ Fast RSI
✖ Medium RSI
✖ Standard RSI
✖ Slow RSI
✅ Composite RSI — Thickest
✅ Stage Indicator
✖ RSI Velocity
✖ RSI Acceleration
✅ Quality Score
✅ Bullish Cross
✅ Bearish Cross
✅ Strong Signal Background
Levels:
・✅ Center 50 — Thickest
・✅ OB1 60, OB2 70, OB3 95 (thicker)
・✅ OS1 40, OS2 30, OS3 5 (thicker)
-------------------------------------------------------------------------------------------------------------
thats enough
have a nice trade
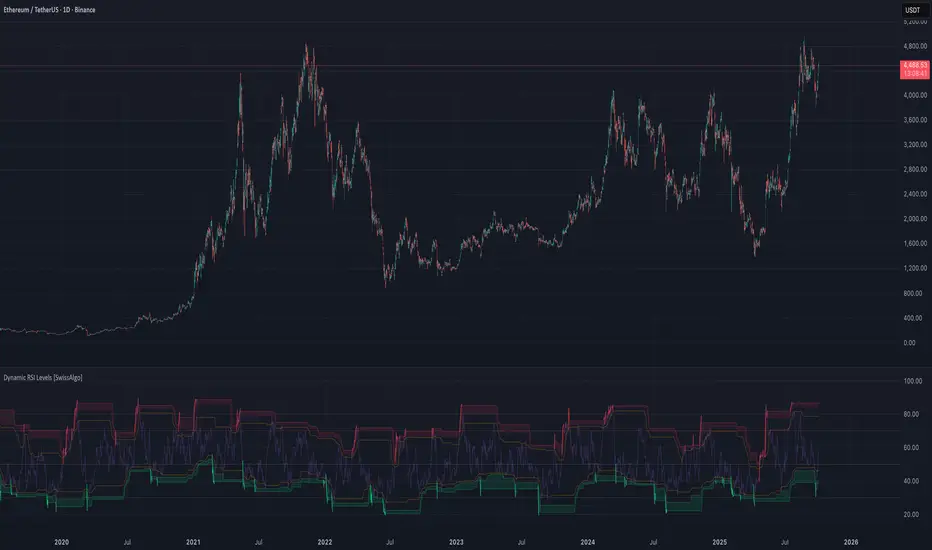
RSI with Dynamic Overbought/Oversold Levels [SwissAlgo]RSI with Dynamic Overbought/Oversold Levels
RSI indicator with adaptive overbought/oversold levels based on percentile analysis instead of fixed thresholds 30/70.
----------------------------------------------------------------
OVERVIEW
Traditional RSI uses static 30/70 levels that may fail to adapt to changing market conditions. This indicator calculates dynamic overbought/oversold zones based on recent price behavior, providing context-aware signals across dynamic volatility regimes.
----------------------------------------------------------------
KEY FEATURES
Dynamic percentile bands (98th, 95th, 90th, 10th, 5th, 2nd) that automatically adjust to current market volatility
Color-coded RSI line: red when above 98th percentile (extreme overbought), green when below 2nd percentile (extreme oversold), purple otherwise
Highlighted extreme zones with subtle background fills for easy visual identification
Adjustable responsiveness: Fast (50 bars), Medium (100 bars), or Slow (200 bars) for different trading styles and timeframes
Optional smoothing MA with multiple types: SMA, EMA, RMA, WMA, VWMA
Built-in alerts for extreme overbought/oversold conditions
----------------------------------------------------------------
HOW IT WORKS
The indicator tracks RSI values over a rolling window and calculates percentile ranks. When RSI reaches its 98th percentile, it means current momentum is stronger than 98% of recent readings — signaling a potentially extreme overbought condition relative to recent behavior, not just an arbitrary fixed level.
----------------------------------------------------------------
USAGE
Watch for RSI entering colored extreme zones (red/green fills) for potential exhaustion signals
Use the 90th/10th percentile bands as early warning levels
Combine with price action, support/resistance, or other indicators and your own analysis for confirmation
Adjust responsiveness based on your timeframe
----------------------------------------------------------------
SETTINGS
RSI Length: Standard 14-period default, adjustable
RSI Source: Close price default, customizable
Responsiveness: Choose how quickly percentile bands adapt to new data
Smoothing: Optional moving average overlay on RSI
Show Percentile Bands: Toggle visibility of dynamic levels
----------------------------------------------------------------
ALERTS
Two alert conditions are available:
RSI Extreme Overbought (crosses above 98th percentile)
RSI Extreme Oversold (crosses below 2nd percentile)
----------------------------------------------------------------
NOTES
Percentile levels recalculate as new data arrives, providing adaptive context rather than fixed historical values. This is intentional; the indicator shows where RSI stands relative to recent market behavior, not potentially outdated static thresholds.
----------------------------------------------------------------
LIMITATIONS & DISCLAIMER
PERCENTILE RECALCULATION
This indicator uses rolling percentile calculations that update as new price data arrives. Historical percentile levels may shift slightly as the lookback window moves forward . This is by design; the indicator provides context relative to recent market behavior, not static historical thresholds. Users should be aware that backtest results may differ slightly from real-time performance due to this adaptive nature.
NO PREDICTIVE CLAIMS
This indicator identifies when RSI reaches extreme levels relative to recent history. It does NOT predict future price movements, guarantee reversals, or provide trading signals. Extreme overbought/oversold conditions can persist during strong trends, price may continue moving in the same direction even after entering extreme zones.
ALERT TIMING
Alerts trigger when RSI crosses percentile thresholds on bar close. In fast-moving markets, significant price movement may occur between alert generation and user response. Always confirm conditions and DYOR before taking action.
NOT FINANCIAL ADVICE
This tool is for informational and educational purposes only. It does not constitute financial, investment, or trading advice. Past performance of any trading system or methodology is not indicative of future results. Trading involves substantial risk of loss and is not suitable for all investors.
USER RESPONSIBILITY
Users are solely responsible for their trading decisions. Always conduct your own analysis, implement proper risk management, and never risk more than you can afford to lose. Test thoroughly on paper/demo accounts before live trading.
NO WARRANTIES
This indicator is provided "as is" without warranties of any kind. The author assumes no responsibility for trading losses, technical errors, or any damages resulting from the use of this indicator.
RSI: alternative derivationMost traders accept the Relative Strength Index (RSI) as a standard tool for measuring momentum. But what if RSI is actually a position indicator?
This script introduces an alternative derivation of RSI, offering a fresh perspective on its true nature. Instead of relying on the traditional calculation of average gains and losses, this approach directly considers the price's position relative to its equilibrium (moving average), adjusted for volatility.
While the final value remains identical to the standard RSI, this alternative derivation offers a completely new understanding of the indicator.
Key components:
Price (Close)
Utilizes the closing price, consistent with the original RSI formula.
normalization factor
Transforms raw calculations into a fixed range between -1 and +1.
normalization_factor = 1 / (Length - 1)
EMA of Price
Applies Wilder’s Exponential Moving Average (EMA) to the price, serving as the anchor point for measuring price position, similar to the traditional RSI formula.
myEMA = ta.rma(close,Length)
EMA of close-to-close absolute changes (unit of volatility)
Adjusts for market differences by applying a Wilder’s EMA to absolute price changes (volatility), ensuring consistency across various assets.
CC_vol = ta.rma(math.abs(close - close ),Length)
Calculation Breakdown
DISTANCE:
Calculate the difference between the closing price and its Wilder's EMA. A positive value indicates the price is above the EMA; a negative value indicates it is below.
distance = close - myEMA
STANDARDIZED DISTANCE
Divide the distance by the unit of volatility to standardize the measurement across different markets.
S_distance = distance / CC_vol
NORMALIZED DISTANCE
Normalize the standardized distance using the normalization factor (n-1) to adjust for the lookback period.
N_distance = S_distance * normalization_factor
RSI
Finally, scale the normalized distance to fit within the standard RSI range of 0 to 100.
myRSI = 50 * (1 + N_distance)
The final equation:
RSI = 50 ×
What This Means for RSI
Same RSI Values, Different Interpretation
The standard RSI formula may obscure its true measurement, whereas this approach offers clarity.
RSI primarily indicates the price's position relative to its equilibrium, rather than directly measuring momentum.
RSI can still be used to analyze momentum, but in a more intuitive and well-informed way.

RSI MA Cross + Divergence Signal (V2) Core Logic
RSI + Moving Average
The script calculates a standard RSI (default 14).
It then overlays a moving average (SMA/EMA/WMA, default 9).
When RSI crosses above its MA → bullish momentum.
When RSI crosses below its MA → bearish momentum.
Divergence Filter
Signals are only valid if there’s confirmed divergence:
Bullish divergence: Price makes a lower low, RSI makes a higher low.
Bearish divergence: Price makes a higher high, RSI makes a lower high.
Overbought / Oversold Filter
Optional extra:
Bullish signals only valid if RSI ≤ 30 (oversold).
Bearish signals only valid if RSI ≥ 70 (overbought).
This ensures signals happen in “stretched” conditions.
Risk & Trade Management
Entries taken only when all conditions align.
Exits can be managed with ATR stops, partial take-profits, breakeven moves, and trailing stops (we coded these in the strategy version).
Cooldown, session filters, and daily loss guard to keep risk tight.
🔹 Strengths
✅ High selectivity: Combining RSI cross + divergence + OB/OS means signals are rare but higher quality.
✅ Great at catching reversals: Divergence highlights where price may be running out of steam.
✅ Risk management baked in: ATR stops + partial exits smooth out equity curve.
✅ Works across markets: ES, FX, crypto — anywhere RSI divergences are respected.
✅ Flexible: You can loosen/tighten filters depending on aggressiveness.
🔹 Weaknesses
❌ Lag from pivots: Divergence only confirms after a few bars → you enter late sometimes.
❌ Choppy in ranges: In sideways markets, RSI divergences appear often and whipsaw.
❌ Filters reduce signals: With all filters ON (divergence + OB/OS + trend + session), signals can be very rare — may under-trade.
❌ Not standalone: Needs higher-timeframe context (trend, liquidity pools) to avoid counter-trend entries.
🔹 Best Ways to Trade It
Use Higher Timeframe Bias
Run the strategy on 15m/1H, but only trade in direction of higher timeframe trend (e.g., 4H EMA).
Example: If daily is bullish → only take bullish divergences.
Pair With Structure
Look for signals at key zones: HTF support/resistance, VWAP, or FVGs.
Divergence + RSI cross inside an FVG is a strong entry trigger.
Adjust OB/OS for Volatility
For crypto/FX: use 35/65 instead of 30/70 (markets trend harder).
For ES/S&P: 30/70 works fine.
Risk Management Is King
Use partial exits: take profit at 1R, trail rest.
Size by % of equity (we coded this into the strategy).
Avoid News Spikes
Divergences break down around CPI, NFP, Fed announcements — stay flat.
🔹 When It Shines
Trending markets that make extended pushes → clean divergences.
Reversal zones (oversold → bullish bounce, overbought → bearish fade).
Swing trading (15m–4H) — less noise than 1m/5m scalping.
🔹 When to Avoid
Low volatility chop → lots of false divergences.
During high-impact news → RSI swings wildly.
In strong one-way trends without pullbacks — divergence keeps calling tops/bottoms too early.
✅ Summary:
This is a reversal-focused RSI divergence strategy with strict filters. It’s powerful when combined with higher-timeframe bias + structure confluence, but weak if traded blindly in choppy or news-driven conditions. Best to treat it as a precision entry trigger, not a full system — layer it on top of your FVG/ORB framework for maximum edge.

RSI Trend Navigator [QuantAlgo]🟢 Overview
The RSI Trend Navigator integrates RSI momentum calculations with adaptive exponential moving averages and ATR-based volatility bands to generate trend-following signals. The indicator applies variable smoothing coefficients based on RSI readings and incorporates normalized momentum adjustments to position a trend line that responds to both price action and underlying momentum conditions.
🟢 How It Works
The indicator begins by calculating and smoothing the RSI to reduce short-term fluctuations while preserving momentum information:
rsiValue = ta.rsi(source, rsiPeriod)
smoothedRSI = ta.ema(rsiValue, rsiSmoothing)
normalizedRSI = (smoothedRSI - 50) / 50
It then creates an adaptive smoothing coefficient that varies based on RSI positioning relative to the midpoint:
adaptiveAlpha = smoothedRSI > 50 ? 2.0 / (trendPeriod * 0.5 + 1) : 2.0 / (trendPeriod * 1.5 + 1)
This coefficient drives an adaptive trend calculation that responds more quickly when RSI indicates bullish momentum and more slowly during bearish conditions:
var float adaptiveTrend = source
adaptiveTrend := adaptiveAlpha * source + (1 - adaptiveAlpha) * nz(adaptiveTrend , source)
The normalized RSI values are converted into price-based adjustments using ATR for volatility scaling:
rsiAdjustment = normalizedRSI * ta.atr(14) * sensitivity
rsiTrendValue = adaptiveTrend + rsiAdjustment
ATR-based bands are constructed around this RSI-adjusted trend value to create dynamic boundaries that constrain trend line positioning:
atr = ta.atr(atrPeriod)
deviation = atr * atrMultiplier
upperBound = rsiTrendValue + deviation
lowerBound = rsiTrendValue - deviation
The trend line positioning uses these band constraints to determine its final value:
if upperBound < trendLine
trendLine := upperBound
if lowerBound > trendLine
trendLine := lowerBound
Signal generation occurs through directional comparison of the trend line against its previous value to establish bullish and bearish states:
trendUp = trendLine > trendLine
trendDown = trendLine < trendLine
if trendUp
isBullish := true
isBearish := false
else if trendDown
isBullish := false
isBearish := true
The final output colors the trend line green during bullish states and red during bearish states, creating visual buy/long and sell/short opportunity signals based on the combined RSI momentum and volatility-adjusted trend positioning.
🟢 Signal Interpretation
Rising Trend Line (Green): Indicates upward momentum where RSI influence and adaptive smoothing favor continued price advancement = Potential buy/long positions
Declining Trend Line (Red): Indicates downward momentum where RSI influence and adaptive smoothing favor continued price decline = Potential sell/short positions
Flattening Trend Lines: Occur when momentum weakens and the trend line slope approaches neutral, suggesting potential consolidation before the next move
Built-in Alert System: Automated notifications trigger when bullish or bearish states change, sending "RSI Trend Bullish Signal" or "RSI Trend Bearish Signal" messages for timely entry/exit
Color Bar Candles Option: Optional candle coloring feature that applies the same green/red trend colors to price bars, providing additional visual confirmation of the current trend direction

RSI Oscillator fxdealBased on the Pine Script code you provided, here is a detailed description of the indicator's features and functionality.
Indicator Overview
This is the Heikin Ashi RSI Oscillator (HARSI), a custom-built indicator for TradingView. It combines the principles of Heikin Ashi candles and the Relative Strength Index (RSI) to provide a smoothed, trend-focused oscillator in a separate pane below the main chart. The indicator visualizes trend strength, overbought/oversold conditions, and momentum changes using a series of configurable plots and lines.
Key Components and Features
Heikin Ashi RSI Candles: This is the core component. Instead of traditional price data, the indicator uses a custom Heikin Ashi calculation applied to the RSI values. This creates a smoothed, momentum-driven "candle" visualization that filters out market noise, making it easier to identify the direction and strength of the trend. The color of these candles changes to reflect bullish (teal) or bearish (red) momentum.
RSI Plot & Histogram: The indicator includes a standard RSI line plot and an optional histogram. The RSI can be displayed in "Smoothed Mode," which applies a Heikin Ashi-like smoothing to the RSI line itself to reduce volatility and improve trend identification. The histogram visually represents the RSI's value, with its height corresponding to the magnitude of the RSI.
Stochastic RSI: An optional Stochastic RSI is included to provide a different perspective on momentum. This is a "momentum of momentum" indicator that can be used for confirming trend changes or identifying overbought/oversold conditions within the RSI's own range. It can be plotted as either a ribbon (showing the K and D lines filled) or as individual lines.
Bollinger Bands (Stepline Style): The indicator overlays Bollinger Bands on the RSI. These bands adapt to the volatility of the RSI, providing dynamic overbought and oversold levels. The middle band is a simple moving average of the RSI. The upper and lower bands are plotted using a stepline style, giving them a distinct, staggered appearance.
Horizontal Lines: Several fixed horizontal lines are plotted to define key zones:
Overbought/Oversold (OB/OS) Zones: Customizable horizontal lines define overbought and oversold regions, with additional lines for "extreme" levels. These are based on the indicator's zero-median scale.
Traditional RSI Levels: Optional dotted horizontal lines at 70, 50, and 30 help users who are accustomed to traditional RSI readings quickly identify overbought, neutral, and oversold conditions.

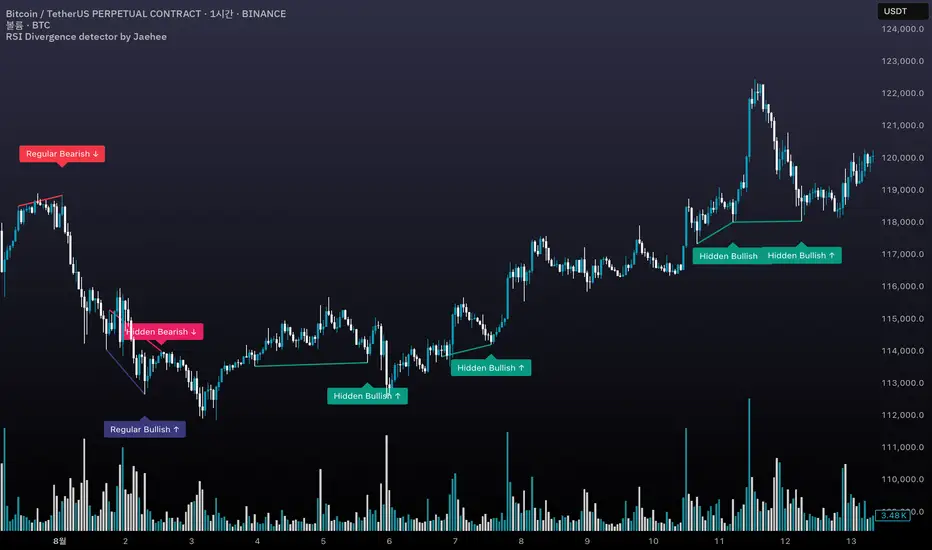
RSI Divergence detector by Jaehee📌 RSI DIVERGENCE DETECTOR — Instant Detection of Regular & Hidden Divergences with Color-Coded Labels
🔍 WHAT IT IS
• Detects regular and hidden divergences between price and RSI instantly, without the delay common in other divergence indicators
• Displays divergences directly on the chart with color-coded labels and connecting lines for instant visual recognition
• Uses different label colors for each divergence type so traders can identify setups at a glance
⚙️ HOW IT WORKS
• RSI Calculation — RSI is computed from a chosen price source with adjustable length
• Immediate Pivot Detection — Identifies pivots just one bar after formation for minimal delay
• RSI Delta Filter — Requires a minimum RSI difference to reduce noise and false signals
• Divergence Logic
Regular Bullish: Price lower low • RSI higher low
Regular Bearish: Price higher high • RSI lower high
Hidden Bullish: Price higher low • RSI lower low
Hidden Bearish: Price lower high • RSI higher high
• Visual Output — Connects pivot points with lines and adds labels above/below bars in colors you set
💡 WHY THIS COMBINATION
• Instant feedback — Acts faster than typical divergence tools that wait for multiple bar confirmations
• All-in-one detection — Regular and hidden divergences in the same tool
• Visual clarity — Distinct label colors make type recognition immediate
• Customizable — Adjust RSI length, pivot sensitivity, color scheme, and filtering to your style
🆚 HOW IT DIFFERS FROM COMMON DIVERGENCE INDICATORS
• Displays divergence the moment a pivot forms
• Detects both regular and hidden divergences in real time
• Applies RSI difference filtering for better quality
• Offers full color customization for each divergence type
📖 HOW TO READ IT (CONTEXT, NOT SIGNALS)
• Regular Bullish ↑ — Possible upward reversal or trend continuation after pullback
• Regular Bearish ↓ — Possible downward reversal or continuation after rally
• Hidden Bullish ↑ — Often a trend continuation signal in uptrends
• Hidden Bearish ↓ — Often a trend continuation signal in downtrends
• Always confirm with trend, momentum, or volume tools before trading
🛠 INPUTS
• RSI source and length
• Pivot lookback bars (left/right)
• Minimum RSI difference
• Custom colors for each divergence type
🎨 DESIGN NOTES
• Overlay on price chart for context
• Lines connect relevant pivots for clarity
• Labels placed near pivot highs/lows for easy spotting
• Customizable colors for personal visual preferences
⚠️ LIMITATIONS AND GOOD PRACTICE
• Divergence is not a guaranteed reversal signal
• Strong trends may override divergence setups
• False signals can occur in low volume or choppy markets
• Best used with a complete trading system and risk management
📂 DEFAULTS AND SCOPE
• Works on all OHLCV instruments and timeframes
• No repainting after pivot confirmation
💬 AUTHOR’S NOTE FOR REVIEW
This script is not a repackaging of existing tools. It integrates immediate divergence detection, hidden divergence analysis, and visual type separation into a single, customizable package. All features interact to deliver faster, clearer market context without generating trade signals or making performance claims.
RSI OS/OB Background StripesThe "RSI OS/OB Background Stripes" indicator is a simple tool designed to help traders visualize overbought and oversold market conditions using the Relative Strength Index (RSI). It highlights these conditions by displaying colored background stripes directly on your chart, making it easy to spot potential trading opportunities.
How It Works:RSI Calculation: The indicator calculates the RSI, a popular momentum indicator that measures the speed and change of price movements, using a default period of 14 (customizable).
Overbought/Oversold Levels: It marks areas where the RSI is above a user-defined overbought level (default: 70) with red background stripes, and below an oversold level (default: 30) with green background stripes.
Visual Feedback: The colored stripes appear on the chart when the RSI enters overbought (red) or oversold (green) zones, helping you quickly identify market conditions.
Customization: You can adjust the RSI period, overbought/oversold levels, background colors, and transparency. You can also choose to show the RSI line in a separate panel or display RSI values on the chart for debugging.
Alerts: The indicator includes optional alerts that notify you when the RSI crosses into overbought or oversold territory.
Who It’s For: This indicator is perfect for beginner and intermediate traders who want a clear, visual way to track RSI-based overbought and oversold conditions without cluttering their charts.
Key Features:Easy-to-read background stripes for overbought (red) and oversold (green) conditions.
Fully customizable RSI settings, colors, and transparency.
Optional RSI plot and value display for deeper analysis.
Alerts to keep you informed of key RSI level crossings.
This indicator is a straightforward way to monitor market momentum and make informed trading decisions.

RSI Buy Sell Signals[RanaAlgo]Overview
This Premium RSI with Enhanced Signals builds upon the classic Relative Strength Index by incorporating multiple confirmation filters and visual enhancements to improve signal reliability. The indicator goes beyond basic overbought/oversold levels by adding volume confirmation, trend alignment, and peak detection logic.
Key Features
Enhanced Signal Detection
Peak Strength Filter: Requires RSI movements to meet minimum strength criteria (configurable from 1-5 bars)
Volume Confirmation: Optional volume filter to ensure signals occur with above-average trading activity
Trend Alignment: Optional trend confirmation that checks price position relative to 20-period EMA
Visual Improvements
Dynamic coloring of RSI line (green in oversold, red in overbought)
Customizable reference lines and zones
Clear buy/sell signals with triangle markers
Comprehensive info panel showing current RSI status
Alert Capabilities
Ready-to-use alert conditions for both buy and sell signals
Visual and audible alerts when signals trigger
How It Works
Core RSI Calculation: Uses standard RSI formula with configurable length (default 14)
Signal Generation:
Buy signals require either:
RSI rising from oversold with volume/trend confirmation (when enabled)
Simple crossover above oversold level (when filters disabled)
Sell signals require either:
RSI falling from overbought with volume/trend confirmation
Simple crossunder below overbought level
Additional Filters:
Minimum peak strength prevents weak, insignificant movements from generating signals
Volume filter helps confirm institutional participation
Trend filter aligns signals with broader price direction
Usage Instructions
Apply to any chart timeframe (works best on 1H or higher)
Configure settings in the input panel:
Adjust RSI length if needed
Set overbought/oversold levels (default 70/30)
Enable/disable volume and trend filters
Customize visual elements
Signals appear as triangles below/above the RSI line
Use alerts to get notified of new signals
Differentiation from Standard RSI
This indicator adds several layers of confirmation that aren't present in the basic RSI:
Multi-bar momentum requirement for peaks/troughs
Volume validation option
Trend confirmation option
Smoothed RSI line for cleaner visualization
Comprehensive info panel with current status
The combination of these features helps filter out false signals that commonly occur with traditional RSI implementations.

RSI Crossover Signal Companion - Alerts + Visuals🔷 RSI Crossover Signal Companion — Alerts + Visuals
The Relative Strength Index (RSI) is a momentum oscillator that measures the speed and change of recent price movements. It helps traders identify overbought or oversold conditions, possible trend reversals, and momentum strength.
This utility builds on TradingView’s classic Relative Strength Index (RSI) by adding real-time alerts and triangle markers when the RSI crosses its own moving average — a common technique for early momentum detection.
It is designed as a lightweight, visual companion tool for traders using RSI/MA crossover logic in manual or semi-automated strategies.
🔍 Features
✅ Preserves the full original RSI layout, including:
• Gradient fill and overbought/oversold zones
• Standard RSI input settings (length, source, etc.)
• MA smoothing options with user-defined type and length
🔺 Adds visual triangle markers:
🔼 Up triangle when RSI crosses above its MA
🔽 Down triangle when RSI crosses below its MA
📢 Built-in alerts for RSI/MA crosses:
“RSI Crossed Above MA”
“RSI Crossed Below MA”
📈 How to Use
This script is ideal for:
• Spotting early momentum shifts
• Confirming entries or exits in other systems (price action, trendlines, breakouts)
• Building alert-based automation (webhooks, bots, etc.)
Popular use cases:
• Combine with trend indicators like MA200 or MA12
• Use in confluence with price structure and divergence
• Validate breakout moves with momentum confirmation
⚙️ Customization
RSI length, MA length, MA type, and source are fully adjustable
Triangle marker size, shape, and color can be edited under Style
Alerts are pre-built and ready for use

RSI HeartHere's an introduction you can use for your RSI Heart indicator:
---
### RSI Heart Indicator
The **RSI Heart Indicator** provides a visually engaging way to monitor and track the **Relative Strength Index (RSI)** across multiple timeframes (10m, 15m, 30m, and 1H). It not only shows the RSI value but also uses heart-shaped symbols to reflect the current market condition based on RSI levels, making it easier to understand the strength and momentum of a given asset at a glance.
### Key Features:
- **Multi-Timeframe Support**: The indicator pulls the RSI values from multiple timeframes (10 minutes, 15 minutes, 30 minutes, and 1 hour) so you can analyze market strength at different intervals in one view.
- **Heart Symbols**: RSI values are displayed alongside heart emojis (❤️, 💛, 💚) that provide a visual cue for the market condition:
- **❤️ (Overbought or Oversold)**: When RSI is below 27 or above 73.
- **💛 (Near Oversold/Overbought)**: When RSI is between 27-30 or 70-73.
- **💚 (Neutral)**: When RSI is between 30 and 70.
- **Customizable Visibility**: Toggle visibility for each timeframe's RSI using simple on/off settings, giving you control over which timeframes are displayed in your chart.
### How it Can Help:
- **Quick Market Sentiment Analysis**: The heart symbols and RSI values allow you to quickly assess whether an asset is in an overbought or oversold condition.
- **Multi-Timeframe RSI**: By viewing RSI across multiple timeframes, you can gain a more comprehensive understanding of market momentum and strength.
- **Personalized to Your Preferences**: Adjust the settings to only show the timeframes that matter most to you, creating a customized and clean chart view.
This indicator helps traders make more informed decisions by providing a clear, easy-to-read representation of market conditions across various timeframes, all within one indicator.
---
This introduction explains what the indicator does, its features, and how it can benefit traders in a concise and easy-to-understand way.

RSI VWAP POC [Uncle Sam Trading]Category: Oscillators, Volume, Market Profile
Timeframe: Suitable for all timeframes
Markets: Crypto, Forex, Stocks, Commodities
Overview
The RSI VWAP POC indicator is a powerful and innovative oscillator that combines the Relative Strength Index (RSI), Volume-Weighted Average Price (VWAP), and Point of Control (POC) from market profile analysis. Designed to provide traders with clear, high-probability trading signals, this indicator helps you identify key market levels, spot overbought/oversold conditions, and time your entries and exits with precision. Whether you’re a day trader, swing trader, or scalper, this free tool adds significant value to your trading strategy by offering a unique blend of momentum, volume, and market profile insights.
How It Works
This indicator integrates three core components to deliver actionable insights:
RSI (Relative Strength Index): Measures momentum to identify overbought (above 70) and oversold (below 30) conditions, helping you anticipate potential reversals.
VWAP (Volume-Weighted Average Price): Calculates a volume-weighted price benchmark, which is used to compute a more accurate, volume-sensitive RSI. This ensures the indicator reflects true market dynamics.
POC (Point of Control): Derived from market profile analysis, the POC represents the price level with the highest traded volume in a session, acting as a critical support or resistance level.
The indicator plots a smoothed RSI based on VWAP, overlaid with market profile data on a user-defined higher timeframe (default: 4H). The POC is displayed as a red line, with aqua bars indicating the value area where the majority of trading volume occurred. When the RSI crosses the POC, the indicator generates clear buy and sell signals:
Strong Buy (SBU): RSI crosses above the POC in an oversold zone.
Strong Sell (SBD): RSI crosses below the POC in an overbought zone.
Additional features include:
Background colors to highlight bullish (green) or bearish (red) trends.
Shaded zones for overbought (70/60) and oversold (30/40) levels.
Customizable settings to fit your trading style and timeframe.
How This Indicator Adds Value
The RSI VWAP POC indicator offers several key benefits that enhance your trading performance:
High-Probability Signals: By combining RSI, VWAP, and POC, this indicator identifies trades at key market levels where price is likely to react, increasing your win rate.
Improved Timing: Clear buy and sell signals, such as ‘SBU’ and ‘SBD’, help you enter and exit trades at optimal points, maximizing profitability.
Risk Management: Overbought/oversold zones and trend confirmation via background colors help you avoid false signals, protecting your capital.
Versatility: Suitable for all markets (crypto, forex, stocks) and timeframes, making it a valuable tool for traders of all experience levels.
Time Efficiency: The indicator does the heavy lifting by analyzing momentum, volume, and market profile data, allowing you to focus on executing trades.
Real-World Performance Example: On a 1-hour Bitcoin chart with a 4-hour higher timeframe, this indicator identified a strong sell signal on April 6th at 12:00 ($82,000), leading to a 9% drop to $74,600. A subsequent strong buy signal on April 7th at 04:00 ($76,200) captured a 6% rise to $81,200 – a potential 25% profit with 5x leverage if exited at 5%.
How to Use
Add the Indicator: Search for “RSI VWAP POC ” in TradingView’s indicator library and add it to your chart.
Set Your Timeframe: The indicator works on any timeframe but is optimized for a 1-hour chart with a 4-hour higher timeframe (set in the settings).
Interpret Signals:
Look for ‘SBU’ (strong buy) labels when the RSI crosses above the POC in an oversold zone, indicating a potential buying opportunity.
Look for ‘SBD’ (strong sell) labels when the RSI crosses below the POC in an overbought zone, signaling a potential selling opportunity.
Use the background colors (green for bullish, red for bearish) to confirm the trend.
Combine with Your Strategy: Use the indicator alongside your existing analysis (e.g., support/resistance, candlestick patterns) for best results.
Settings and Customization
The indicator is highly customizable to suit your trading needs:
RSI Length (Default: 14): Adjust the sensitivity of the RSI. Use a shorter length (e.g., 10) for scalping, or a longer length (e.g., 20) for smoother signals.
EMA Smoothing Length (Default: 3): Smooths the RSI line. Increase to 5 or 7 for less choppy signals in volatile markets.
Higher Timeframe (Default: 240 minutes): Set to 240 (4 hours) for a 1-hour chart. Adjust based on your chart’s timeframe (e.g., 60 minutes for a 15-minute chart).
Value Area Percentage (Default: 100%): Defines the size of the value area around the POC. Lower to 70% for a tighter focus on key levels.
Overbought/Oversold Thresholds (Defaults: 70/30): Adjust these levels to match market conditions (e.g., 80/20 for trending markets).
Show POC Line (Default: True): Toggle the red POC line on or off.
Show Buy/Sell Signals: Enable ‘Show Strong Breakup Signals’ and ‘Show Strong Breakdown Signals’ to focus on high-probability trades.
Why Choose This Indicator?
The RSI VWAP POC indicator stands out by offering a unique combination of momentum, volume, and market profile analysis in a single, easy-to-use tool. It’s designed to help traders of all levels make informed decisions, reduce risk, and increase profitability. Whether you’re trading Bitcoin, forex pairs, or stocks, this indicator provides the clarity and precision you need to succeed.

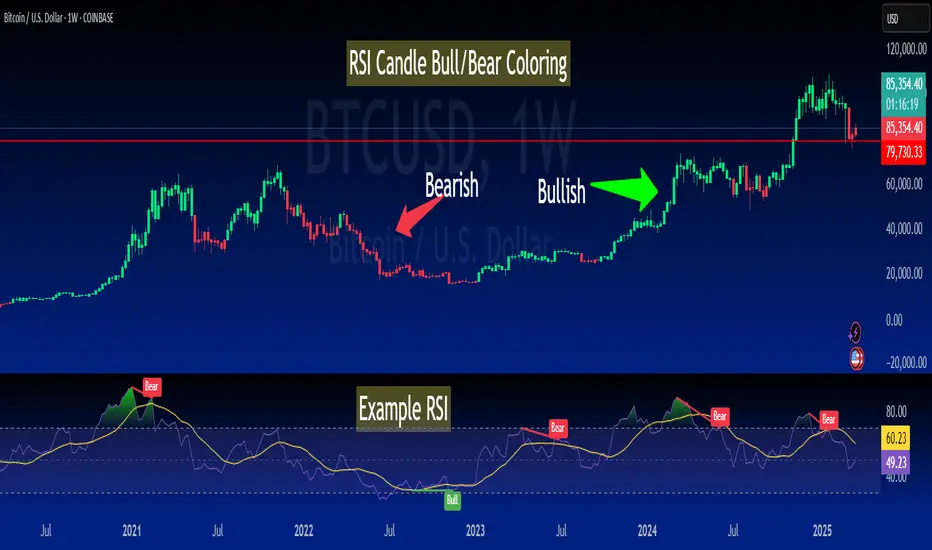
RSI-Colored Price Candles with BackgroundThis Pine Script indicator visually enhances price candles based on **RSI (Relative Strength Index)** behavior, helping traders quickly assess momentum directly on the price chart.
**RSI Calculation:**
The RSI is computed using a traditional 14-period lookback. It uses `ta.rma()` to smooth average gains and losses, and then transforms the result into an RSI value between 0 and 100. This value is used to determine both **candle color** and optional **background shading**.
**Candle Coloring:**
Each price candle is recolored based on the current RSI value:
- If RSI is **greater than or equal to 50**, the candle is **bright green**, indicating bullish momentum.
- If RSI is **less than 50**, the candle is **bright red**, indicating bearish momentum.
The actual OHLC values of the candles remain unchanged. Only their color is modified to reflect RSI strength.
**Optional Background Highlighting:**
A user setting called `Show Overbought/Oversold Background` lets traders toggle background shading on or off. When enabled:
- If RSI is **above 70**, a soft **green** background appears, signaling overbought conditions.
- If RSI is **below 30**, a soft **red** background appears, signaling oversold conditions.
This provides an intuitive visual cue that highlights potential reversal or exhaustion zones based on RSI extremes.
**Custom Settings:**
- The RSI length and source are customizable.
- Background highlighting is turned **off by default**, giving users a clean chart unless they choose to enable it.
**Purpose and Use:**
This script is designed for traders who want to visually integrate RSI momentum directly into their chart candles, reducing the need to look away from price action. It's clean, responsive, and adjustable — perfect for intraday or swing traders who value simplicity backed by momentum data.
RSI & EMA IndicatorMulti-Timeframe EMA & RSI Analysis with Trend Merging Detection
Overview
This script provides traders with a multi-timeframe analysis tool that simplifies trend detection, momentum confirmation, and potential trend shifts. It integrates Exponential Moving Averages (EMAs) and the Relative Strength Index (RSI) across Daily, Weekly, and Monthly timeframes, helping traders assess both long-term and short-term market conditions at a glance.
This script is a simplification and modification of the EMA Cheatsheet by MarketMoves, reducing chart clutter while adding EMA merging detection to highlight potential trend reversals or breakouts.
Originality and Usefulness
Unlike traditional indicators, which focus on a single timeframe, this script combines multiple timeframes in a single view to offer a comprehensive market outlook.
What Makes This Indicator Unique?
This Indicator to Combine RSI and EMA Clouds for Multiple Timeframes
Multi-Timeframe Trend Analysis in One Visual Tool
EMA Merging Detection to Spot Trend Shifts Early
Momentum Validation Using RSI Across Daily, Weekly, and Monthly Timeframes
Reduces Chart Clutter While Providing Actionable Trade Signals
I couldn't find a TradingView indicator that displayed RSI and EMA clouds together across Daily, Weekly, and Monthly timeframes. This tool bridges that gap, allowing traders to see trend strength and momentum shifts across key timeframes without switching charts.
How the Script Works
1. Trend Direction via EMAs
The script tracks Short-term (5 & 12-period), Medium-term (34 & 50-period), and Long-term (72 & 89-period) EMAs across Daily, Weekly, and Monthly timeframes.
Bullish trend: When faster EMAs are above slower EMAs.
Bearish trend: When faster EMAs are below slower EMAs.
A visual table simplifies trend recognition with:
Green cells for bullish alignment.
Red cells for bearish alignment.
This color-coded system allows traders to quickly assess market momentum across different timeframes without excessive manual analysis.
2. Momentum Confirmation with RSI
The RSI(14) values for Daily, Weekly, and Monthly timeframes are displayed alongside the EMAs.
RSI above 70 suggests overbought conditions.
RSI below 30 suggests oversold conditions.
By combining RSI with EMA trends, traders can confirm whether momentum supports the trend direction or if the market is losing strength.
3. Trend Shift Detection (EMA Merging Mechanism)
A unique feature of this script is EMA merging detection, which occurs when:
The short, medium, and long-term EMAs come within 0.5% of the price.
This often signals trend reversals, breakouts, or consolidations.
When this condition is met, a warning signal appears, alerting traders to potential market shifts.
Who This Indicator Is For?
This script is designed for traders who want to track trends across multiple timeframes while keeping a clean and simplified chart.
Swing & Position Traders – Identify strong trends and potential momentum shifts for longer-term trades.
Trend Followers – Stay aligned with major market trends and avoid trading against momentum.
Day Traders – Use the Daily timeframe for entries while referencing higher timeframes for confirmation.
How to Use the Indicator
Add the indicator to any chart.
Check the trend table in the top-right corner:
Green cells indicate a bullish trend.
Red cells indicate a bearish trend.
Look at RSI values to confirm momentum:
RSI above 70 = Overbought.
RSI below 30 = Oversold.
Watch for the "Merge" alert to spot potential reversals or consolidations.
Combine signals from multiple timeframes for stronger trade decisions.
Why This Indicator is Unique on TradingView?
Before this script, no TradingView indicator displayed RSI and EMA clouds together across multiple timeframes (Daily, Weekly, Monthly).
This tool eliminates the need to:
Manually check multiple timeframes for trend alignment.
Add multiple EMA and RSI indicators to the same chart, creating clutter.
Constantly switch between different timeframes to confirm momentum and trend direction.
With this indicator, traders can see trend strength and momentum shifts instantly, improving their decision-making process.
Chart Guidelines
The script is designed for use on a clean chart to maximize clarity.
The trend alignment table is displayed in a non-intrusive manner so traders can focus on price action.
No additional indicators are required, but users may combine this script with volume-based indicators for further confirmation.
The script name and timeframe should always be visible on published charts to help traders understand the analysis.
Final Notes
This script is a simplification and modification of the EMA Cheatsheet by MarketMoves, improving trend detection, momentum confirmation, and EMA merging detection.
It is designed to help traders quickly identify trend direction, confirm momentum, and detect potential trend shifts, reducing the need for excessive manual analysis.
Disclaimer: This indicator is for educational purposes only and does not constitute financial advice. Trading involves risk; always use proper risk management when applying this tool in live markets.

RSI Alerts – Live & ConfirmedThe RSI Alerts – Live & Confirmed indicator enhances the traditional Relative Strength Index (RSI) by providing real-time alerts and confirmed breakout signals when RSI reaches key levels. It also features a dynamic RSI line color change for better visualization.
Key Features:
✅ Live & Confirmed Alerts:
Live Alert Mode: Triggers when RSI touches overbought (70) or oversold (30).
Confirmed Alert Mode: Triggers only when RSI closes above/below these levels, reducing false signals.
✅ Dynamic RSI Line Coloring:
Above 70: RSI turns green, indicating an overbought condition.
Below 30: RSI turns red, indicating an oversold condition.
Between 30 and 70: RSI remains blue, its normal color, ensuring no color leaks into invalid zones.
✅ Customizable RSI Settings:
Adjustable RSI length, overbought/oversold levels, and alert preferences.
Mid-Level (50) line for trend bias reference.
This indicator is perfect for traders who rely on RSI signals and want clear visual cues and real-time alerts for improved decision-making.

RSI+ (Satori)Short Title: RSI+ (Satori)
Overview
The RSI HistoAlert Strategy with Bands is an advanced RSI-based indicator designed to provide a visual representation of RSI movements, highlighting overbought and oversold conditions
Key Features
✅ RSI Histogram Representation – Converts RSI values i
✅ Dynamic Bands – Uses a Fibonacci-based multiplier to generate upper and lower bands, helping traders recognize extreme price movements.
✅ **CustomizableCustomizable Alerts – Traders can set buy and sell alert levels to receive visual cues for potential trade entries.
✅ Adaptive Bar Coloring – T
How It Works
The RSI calculation is modified using a customizable period and scaling factor.
Standard deviation bands are computed using an SMA (Simple Moving Average) to create u
The histogram color changes based on RSI crossing predefined alert levels:
🔴 Red bars indicate bearish conditions.
🟢 Green bars indicate bullish cond
🔵 Neutral bars represent indecision.
The bar color of the main chart also adapts to the RSI signal, helping traders spot potential trend shifts.
Customization Options
RSI Period – Adjust the RSI calculation length.
Band Length – Configure the period use
Deviation Multiplier – Set the sensitivity of the bands with a Fi
Buy & Sell Alert Levels – Define thresholds for oversold and overbought zones.
RSI Histogram Modifier – Adjust the scaling o
Use Cases
📊 Trend Confirmation – Use i
🚀 Reversal Detection – Identify potential reversals when RSI crosses extr
📉 Divergence Analysis – Spot divergence between price act
Final Notes
This indicator is ideal for traders looking for an enhanced RSI visualization tool with custom alerts and adaptive bands. It canscalping, swing trading, and long-term investing.

RSI XTR with selective candle color by Edwin KThis tradingView indicator named "RSI XTR with selective candle color", which modifies the candle colors on the chart based on RSI (Relative Strength Index) conditions. Here's how it works:
- rsiPeriod: Defines the RSI calculation period (default = 5).
- rsiOverbought: RSI level considered overbought (default = 70).
- rsiOversold: RSI level considered oversold (default = 30).
- These values can be modified by the user in the settings.
RSI Calculation
- Computes the RSI value using the ta.rsi() function on the closing price (close).
- The RSI is a momentum indicator that measures the magnitude of recent price changes.
Conditions for Candle Coloring
- when the RSI is above the overbought level.
- when the RSI is below the oversold level.
How It Works in Practice
- When the RSI is above 70 (overbought) → Candles turn red.
- When the RSI is below 30 (oversold) → Candles turn green.
- If the RSI is between 30 and 70, the candle keeps its default color.
This helps traders quickly spot potential reversal zones based on RSI momentum.
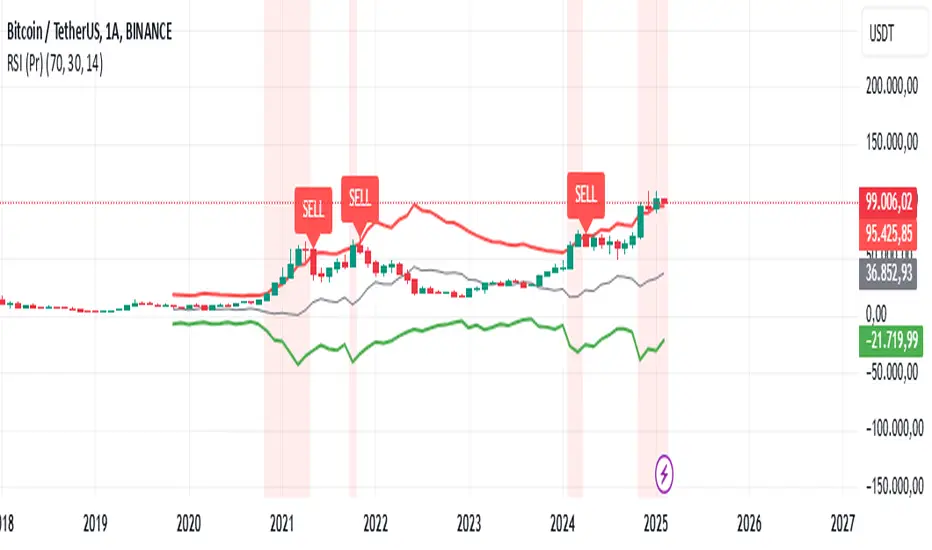
RSI (Pr)The "RSI (Pr)" indicator enhances the traditional Relative Strength Index (RSI) by incorporating dynamic bands and highlighting extreme market conditions directly on the price chart. This approach offers traders a more intuitive visualization of potential overbought and oversold zones, facilitating timely decision-making.
Key Features:
Dynamic RSI Bands: The indicator calculates upper and lower bands based on user-defined overbought and oversold levels. These bands adjust in real-time, providing a responsive measure of market extremes.
Visual Alerts: Background colors change when the price moves outside the RSI bands, offering immediate visual cues of potential market reversals.
Buy/Sell Signals: The script places "BUY" and "SELL" labels on the chart when the price crosses above or below the RSI bands, assisting traders in identifying potential entry and exit points.
How It Works:
RSI Calculation: The script computes the RSI based on the closing price and a user-defined length (default is 14 periods).
Exponential Moving Averages (EMA): It calculates the EMA of the maximum gains and losses to smooth out the data, enhancing the reliability of the RSI bands.
Upper and Lower Bands: Using the smoothed data, the script determines the upper (resistance) and lower (support) bands, which represent dynamic overbought and oversold levels.
Visual Indicators: The script plots the upper and lower bands, as well as a midline, directly on the price chart. Background colors change when the price exceeds these bands, and "BUY" or "SELL" labels appear at crossover points.
Usage:
Overbought Conditions: When the price crosses above the upper band, it may indicate an overbought condition, suggesting a potential selling opportunity.
Oversold Conditions: When the price crosses below the lower band, it may indicate an oversold condition, suggesting a potential buying opportunity.
Customization:
Users can adjust the following parameters to suit their trading preferences:
RSI Overbought Level: Default is 70.
RSI Oversold Level: Default is 30.
RSI Length: Default is 14 periods.
Disclaimer:
This indicator is designed for educational purposes and should not be construed as financial advice. Trading involves significant risk, and it's essential to conduct thorough research and consider your financial situation before making trading decisions. Past performance is not indicative of future results.
By integrating dynamic RSI bands and clear visual signals directly onto the price chart, this indicator aims to provide traders with actionable insights into market conditions, enhancing the traditional RSI analysis.
RSI-Adjusted 9SMAThis indicator integrates the Relative Strength Index (RSI) and a Simple Moving Average (SMA) to create a more robust trading signal by blending momentum and trend analysis. Here's how they work together:
How the RSI and SMA Work in Harmony
RSI (Momentum Indicator):
The RSI measures the speed and change of price movements, oscillating between 0 and 100.
Typically, an RSI value above 50 suggests bullish momentum, while values below 50 indicate bearish momentum.
The script further refines this by applying a 9-period EMA to the RSI. This smoothing process filters out noise, providing a clearer picture of momentum shifts.
SMA (Trend Indicator):
The SMA calculates the average price over a specific period (9 in this case), helping to smooth out price fluctuations and identify the overall trend.
By observing the SMA, traders can determine whether the market is trending upward, downward, or moving sideways.
Combining the Two for Stronger Signals:
The RSI EMA acts as a momentum filter. When it is above 50, it indicates the presence of bullish momentum. Under such conditions, the SMA turning blue provides a stronger confirmation of an uptrend.
Conversely, when the RSI EMA is below 50, it signals weakening momentum. The SMA turning white underlines the caution, suggesting potential bearish conditions or a lack of trend strength.
This combination ensures that traders are not just relying on the SMA's trend-following behavior but also factoring in the market's underlying momentum for more reliable entries and exits.
Why This Approach is Robust
Avoid False Signals:
The SMA alone can generate false signals in choppy or range-bound markets. By incorporating the RSI EMA, the script reduces the likelihood of acting on weak or non-committal trends.
Timing Entries and Exits:
When both the SMA and RSI EMA align (e.g., blue SMA and RSI EMA > 50), it provides a stronger case for entering trades. Similarly, misalignment (e.g., white SMA and RSI EMA ≤ 50) warns against entering during uncertain conditions.
Adapting to Market Conditions:
This dual approach captures both short-term momentum shifts (RSI EMA) and longer-term trend direction (SMA), making it useful across different market phases.
Practical Application
Bullish Setup:
RSI EMA > 50 + Blue SMA → Enter or stay in long positions.
Bearish Setup:
RSI EMA ≤ 50 + White SMA → Exit long positions or consider short opportunities.
This combination of indicators offers traders a balanced strategy that considers both the direction of the trend and the underlying momentum, resulting in more confident and timely decision-making.

RSI from Rolling VWAP [CHE]Introducing the RSI from Rolling VWAP Indicator
Elevate your trading strategy with the RSI from Rolling VWAP —a cutting-edge indicator designed to provide unparalleled insights and enhance your decision-making on TradingView. This advanced tool seamlessly integrates the Relative Strength Index (RSI) with a Rolling Volume-Weighted Average Price (VWAP) to deliver precise and actionable trading signals.
Why Choose RSI from Rolling VWAP ?
- Clear Trend Detection: Our enhanced algorithms ensure accurate identification of bullish and bearish trends, allowing you to capitalize on market movements with confidence.
- Customizable Time Settings: Tailor the time window in days, hours, and minutes to align perfectly with your unique trading strategy and market conditions.
- Flexible Moving Averages: Select from a variety of moving average types—including SMA, EMA, WMA, and more—to smooth the RSI, providing clearer trend analysis and reducing market noise.
- Threshold Alerts: Define upper and lower RSI thresholds to effortlessly spot overbought or oversold conditions, enabling timely and informed trading decisions.
- Visual Enhancements: Enjoy a visually intuitive interface with color-coded RSI lines, moving averages, and background fills that make interpreting market data straightforward and efficient.
- Automatic Signal Labels: Receive immediate bullish and bearish labels directly on your chart, signaling potential trading opportunities without the need for constant monitoring.
Key Features
- Inspired by Proven Tools: Building upon the robust foundation of TradingView's Rolling VWAP, our indicator offers enhanced functionality and greater precision.
- Volume-Weighted Insights: By incorporating volume into the VWAP calculation, gain a deeper understanding of price movements and market strength.
- User-Friendly Configuration: Easily adjust settings to match your trading preferences, whether you're a novice trader or an experienced professional.
- Hypothesis-Driven Analysis: Utilize hypothetical results to backtest strategies, understanding that past performance does not guarantee future outcomes.
How It Works
1. Data Integration: Utilizes the `hlc3` (average of high, low, and close) as the default data source, with customization options available to suit your trading needs.
2. Dynamic Time Window: Automatically calculates the optimal time window based on an auto timeframe or allows for fixed time periods, ensuring flexibility and adaptability.
3. Rolling VWAP Calculation: Accurately computes the Rolling VWAP by balancing price and volume over the specified time window, providing a reliable benchmark for price action.
4. RSI Analysis: Measures momentum through RSI based on Rolling VWAP changes, smoothed with your chosen moving average for enhanced trend clarity.
5. Actionable Signals: Detects and labels bullish and bearish conditions when RSI crosses predefined thresholds, offering clear indicators for potential market entries and exits.
Seamless Integration with Your TradingView Experience
Adding the RSI from Rolling VWAP to your TradingView charts is straightforward:
1. Add to Chart: Simply copy the Pine Script code into TradingView's Pine Editor and apply it to your desired chart.
2. Customize Settings: Adjust the Source Settings, Time Settings, RSI Settings, MA Settings, and Color Settings to align with your trading strategy.
3. Monitor Signals: Watch for RSI crossings above or below your set thresholds, accompanied by clear labels indicating bullish or bearish trends.
4. Optimize Your Trades: Leverage the visual and analytical strengths of the indicator to make informed buy or sell decisions, maximizing your trading potential.
Disclaimer:
The content provided, including all code and materials, is strictly for educational and informational purposes only. It is not intended as, and should not be interpreted as, financial advice, a recommendation to buy or sell any financial instrument, or an offer of any financial product or service. All strategies, tools, and examples discussed are provided for illustrative purposes to demonstrate coding techniques and the functionality of Pine Script within a trading context.
Any results from strategies or tools provided are hypothetical, and past performance is not indicative of future results. Trading and investing involve high risk, including the potential loss of principal, and may not be suitable for all individuals. Before making any trading decisions, please consult with a qualified financial professional to understand the risks involved.
By using this script, you acknowledge and agree that any trading decisions are made solely at your discretion and risk.
Get Started Today
Transform your trading approach with the RSI from Rolling VWAP indicator. Experience the synergy of momentum and volume-based analysis, and unlock the potential for more accurate and profitable trades.
Download now and take the first step towards a more informed and strategic trading journey!
For further inquiries or support, feel free to contact
Best regards
Chervolino
Inspired by the acclaimed Rolling VWAP by TradingView

RSI 30-50-70 moving averageDescription:
The RSI 30-50-70 Moving Average indicator plots three distinct moving averages based on different RSI ranges (30%, 50%, and 70%). Each moving average corresponds to different market conditions and provides potential entry and exit signals. Here's how it works:
• RSI_30 Range (25%-35%): The moving average of closing prices when the RSI is between 25% and 35%, representing potential oversold conditions.
• RSI_50 Range (45%-55%): The moving average of closing prices when the RSI is between 45% and 55%, providing a balanced perspective for trend-following strategies.
• RSI_70 Range (65%-75%): The moving average of closing prices when the RSI is between 65% and 75%, representing potential overbought conditions.
This indicator offers flexibility, as users can adjust key parameters such as RSI ranges, periods, and time frames to fine-tune the signals for their trading strategies.
How it Works:
Like traditional moving averages, the RSI 30-50-70 Moving Averages can highlight dynamic levels of support and resistance. They offer additional insight by focusing on specific RSI ranges, providing early signals for trend reversals or continuation. The default settings can be used across various assets but should be optimized via backtesting.
Default Settings:
• RSI_30: 25% to 35% (Oversold Zone, yellow line)
• RSI_50: 45% to 55% (Neutral/Trend Zone, green line)
• RSI_70: 65% to 75% (Overbought Zone, red line)
• RSI Period: 14
Buy Conditions:
• Use the 5- or 15-minute time frame.
• Wait for the price to move below the RSI_30 line, indicating potential oversold conditions.
• Enter a buy order when the price closes above the RSI_30 line, signaling a recovery from the oversold zone.
• For a more conservative approach, use the RSI_50 line as the buy signal to confirm a trend reversal.
• Important: Before entering, ensure that the RSI_30 moving average has flattened or started to level off, signaling that the oversold momentum has slowed.
Sell Conditions:
• Use the 5- or 15-minute time frame.
• Wait for the price to close above the RSI_70 line, indicating potential overbought conditions.
• Enter a sell order when the price closes below the RSI_70 line, signaling a decline from the overbought zone.
• Important: Similar to buying, wait for the RSI_70 moving average to flatten or level off before selling, indicating the overbought conditions are stalling.
Key Features:
1. Dynamic Range Customization: The indicator allows users to modify the RSI ranges and periods, tailoring the moving averages to fit different market conditions or asset classes.
2. Trend-Following and Reversal Signals: The RSI 30-50-70 moving averages provide both reversal and trend-following signals, making it a versatile tool for short-term traders.
3. Visual Representation of Market Strength: By plotting moving averages based on RSI levels, traders can visually interpret the market’s strength and potential turning points.
4. Risk Management: The built-in flexibility allows traders to choose lower-risk entries by adjusting which RSI level (e.g., RSI_30 vs. RSI_50) they rely on for signals.
Practical Use:
Different assets respond uniquely to RSI-based moving averages, so it's recommended to backtest and adjust ranges for specific instruments. For example, volatile assets may require wider RSI ranges, while more stable assets could benefit from tighter ranges.
Checking for Buy conditions:
1st: Wait for current price to go below the RSI_30 (yellow line)
2nd: Wait and observe for bullish divergence
3rd: RSI_30 has flattened indicating potential gain of momentum after a bullish divergence.
4th: Enter a buy order when the price closed above the RSI_30, preferably when a green candle appeared.
