Cari dalam skrip untuk "rsi"

Noro's VixFix + RSI Strategy v1.0Strategy uses 2 indicators:
1) VixFix
2) RSI (period = 7)
For an entrance signals from both indicators at the same time are necessary.


[Strategy] CoinDog - colored bars, RSI & EMA buy entry - v0.2Proof of Concept for algorithmic trading with Cryptocurrencies.
Could be used manually as swiss knife for trading or as automatic trading system for trade automation.
Main features:
has collored candle bars
draws main MAs - EMA for 10, 20, 60, SMA for 200
draws custom Boilinger Bands
draws RSI undersold, overbought
draws price change more then delta
draws volume change more then delta and xyz BTC


MA, WMA & RSI Strategy Backtest 2Strategy where on decides to go long or short depending on WMA , EMA and RSI indicators. Exit on hitting 15% profit and 5% of loss

EMA, WMA & RSI Strategy BacktestStrategy where on decides to go long or short depending on WMA, EMA and RSI indicators. Exit on hitting 5% profit or reversal of WMA w.r.t EMA

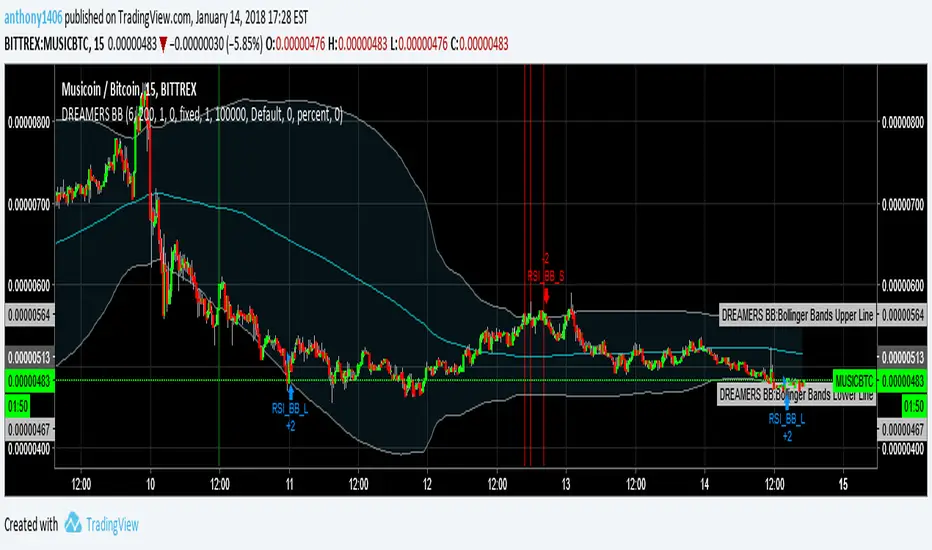
Bollinger + RSI, Double Strategy by DreamertradersESTRATEGIA EN BASE BB RSI
es.tradingview.com
dreamerstraders@gmail.com
BB, MA & RSI StrategyI couldn't find any scripts that mixed the MA BB and RSI's so I made one. :)
Happy to share the code for 0.045 ETH
Eth address: 0xdccF5EBb8759f94DbD09b65CE7f0bDCDf1ec782f
Let me know once you have deposited and ill give you the code ;)
I also have a conversion to alerts as well to get it working in autoview.
Enjoy!

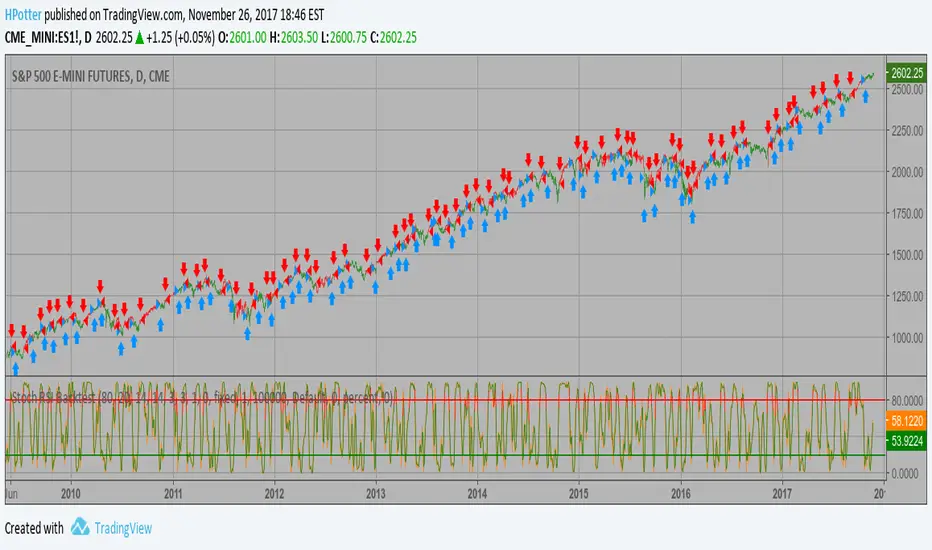
Stochastic RSI Backtest This strategy used to calculate the Stochastic RSI
You can change long to short in the Input Settings
WARNING:
- For purpose educate only
- This script to change bars colors.
TigerBot RSI + Stochastic Skeleton (Faster Backtesting)The logic for this strategy is based on a combination of the Relative Strength Index (RSI) indicator and the Stochastic formula. Customize the input parameters and test on various charts and timeframes for maximum profit potential.
Note: This is a TigerBot Strategy, which means that it is set up and ready for you to use it with our full set of automation and risk management features such as:
Thorough event triggers for automated order execution
Profit/Loss Zones
Profit/Loss Indicators
Take Profit
Normal Stop Loss
Trailing Stop Loss
Advanced Trailing Stop
Profit Locker Stop Loss
Advanced Pyramiding Support
Leverage Support
Much more
Each TigerBot Strategy includes a set of 3 scripts that belong together:
STRATEGY - used for full-featured customization with all our visuals
STUDY - with alert triggers for automation
SKELETON - for faster backtesting without the visuals enabled
This is the SKELETON version of this script. Please also see the other 2 related scripts.
Visit TheTigerBot.com to gain access and take advantage of the full TigerBot features on this strategy, or submit your own script for TigerBot automation!

TigerBot RSI + Stochastic Strategy (Backtesting)The logic for this strategy is based on a combination of the Relative Strength Index (RSI) indicator and the Stochastic formula. Customize the input parameters and test on various charts and timeframes for maximum profit potential.
Note: This is a TigerBot Strategy, which means that it is set up and ready for you to use it with our full set of automation and risk management features such as:
Thorough event triggers for automated order execution
Profit/Loss Zones
Profit/Loss Indicators
Take Profit
Normal Stop Loss
Trailing Stop Loss
Advanced Trailing Stop
Profit Locker Stop Loss
Advanced Pyramiding Support
Leverage Support
Much more
Each TigerBot Strategy includes a set of 3 scripts that belong together:
STRATEGY - used for full-featured customization with all our visuals
STUDY - with alert triggers for automation
SKELETON - for faster backtesting without the visuals enabled
This is the STRATEGY version of this script. Please also see the other 2 related scripts.
Visit TheTigerBot.com to gain access and take advantage of the full TigerBot features on this strategy, or submit your own script for TigerBot automation!

TigerBot RSI + BB Skeleton (Faster Backtesting)The logic for this strategy is based on a combination of the Bollinger Bands (BB) and the Relative Strength Index (RSI) indicators. Customize the input parameters and test on various charts and timeframes for maximum profit potential.
Note: This is a TigerBot Strategy, which means that it is set up and ready for you to use it with our full set of automation and risk management features such as:
Thorough event triggers for automated order execution
Profit/Loss Zones
Profit/Loss Indicators
Take Profit
Normal Stop Loss
Trailing Stop Loss
Advanced Trailing Stop
Profit Locker Stop Loss
Advanced Pyramiding Support
Leverage Support
Much more
Each TigerBot Strategy includes a set of 3 scripts that belong together:
STRATEGY - used for full-featured customization with all our visuals
STUDY - with alert triggers for automation
SKELETON - for faster backtesting without the visuals enabled
This is the SKELETON version of this script. Please also see the other 2 related scripts.
Visit TheTigerBot.com to gain access and take advantage of the full TigerBot features on this strategy, or submit your own script for TigerBot automation!

TigerBot RSI + BB Strategy (Backtesting)The logic for this strategy is based on a combination of the Bollinger Bands (BB) and the Relative Strength Index (RSI) indicators. Customize the input parameters and test on various charts and timeframes for maximum profit potential.
Note: This is a TigerBot Strategy, which means that it is set up and ready for you to use it with our full set of automation and risk management features such as:
Thorough event triggers for automated order execution
Profit/Loss Zones
Profit/Loss Indicators
Take Profit
Normal Stop Loss
Trailing Stop Loss
Advanced Trailing Stop
Profit Locker Stop Loss
Advanced Pyramiding Support
Leverage Support
Much more
Each TigerBot Strategy includes a set of 3 scripts that belong together:
STRATEGY - used for full-featured customization with all our visuals
STUDY - with alert triggers for automation
SKELETON - for faster backtesting without the visuals enabled
This is the STRATEGY version of this script. Please also see the other 2 related scripts.
Visit TheTigerBot.com to gain access and take advantage of the full TigerBot features on this strategy, or submit your own script for TigerBot automation!

Buy/Sell Signal Using Stochastic and RSIThe use of stoch rsi above 55 and below 45 to determine buying and selling pressure.

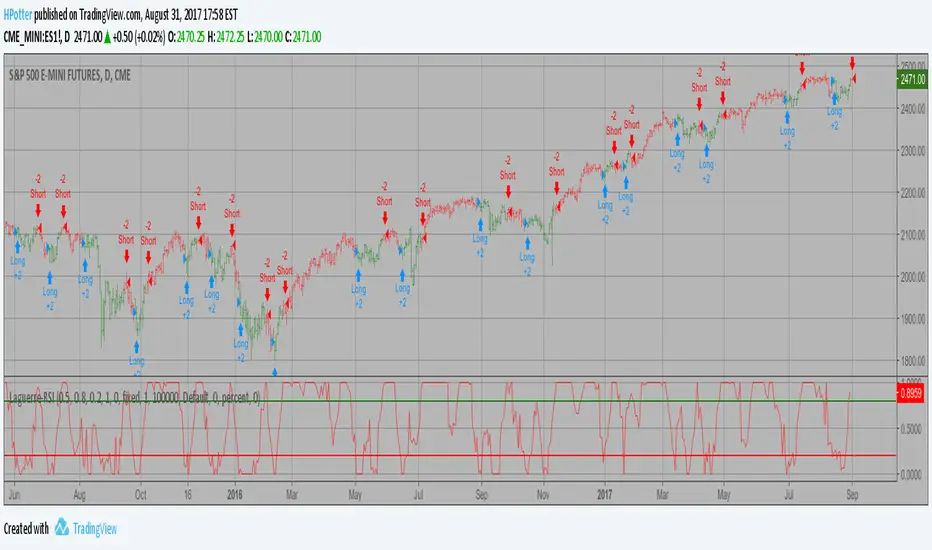
Laguerre-based RSI Backtest This is RSI indicator which is more sesitive to price changes.
It is based upon a modern math tool - Laguerre transform filter.
With help of Laguerre filter one becomes able to create superior
indicators using very short data lengths as well. The use of shorter
data lengths means you can make the indicators more responsive to
changes in the price.
You can change long to short in the Input Settings
WARNING:
- For purpose educate only
- This script to change bars colors.
Double RSI with stochastic Strategy with SL (by Zhipengcfel)Added stop loss level when open positions. Results got better and max drawback reduced.
The current limitations are it will not add positions if having opened positions although meeting the entry conditions.
Next steps are adding positions when meeting entry conditions and set a upper limit quantities for open positions.

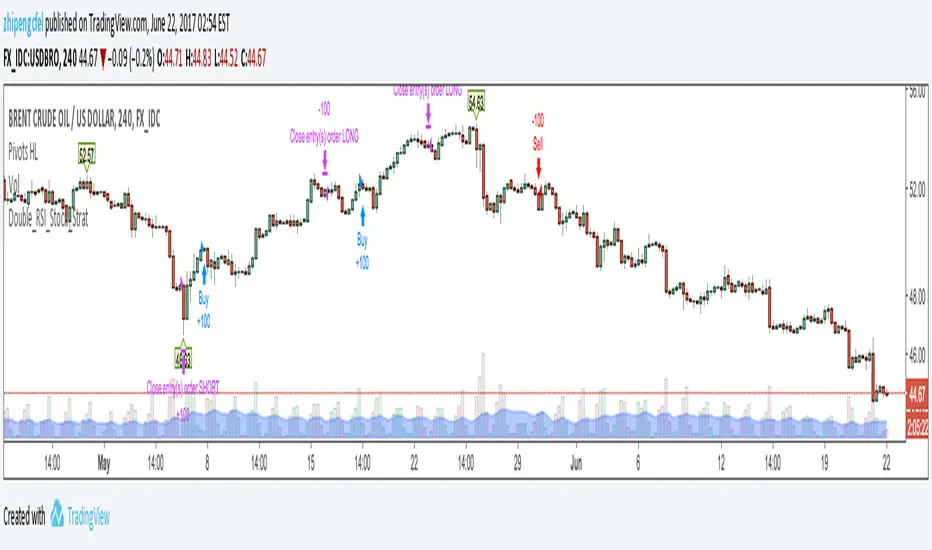
Double RSI with stochastic Strategy on UKOIL (by Zhipengcfel)Adapted the double RSI with stochastic strategy to UKOIL. I optimised the strategy input parameters for UKOIL. It looks promising.
Currently I have not adapted stop loss to the script yet, only enter and exit condition based on trend. Next step I will add stop loss for the strategy and backtest it again.
Due to it is still in development and optimisation, I am sorry that I will not publish it to public currently.
I just use it as a development elog.
Thanks to tradingview for such a good blog system. -:)
My RSI(2) StrategyThis strategy buys when RSI(2)<1
Stop loss is fixed at a 1% loss
Trailing stop activate at 3% gains, with a 1% loss threshold

Stealthy7 Bayes Conditional RSI Trader StrategyWhat does it do?
This script checks whether RSI movement affects future price.
Trades when probability increases or decreases.
Developed for daily(D) bars and Bitcoin. This script is just a toy and for educational use.
Please rent my bots at cryptotrader.org/?r=51

MACD + RSI TSA simple strategy that use EMAs convergence/divergence and RSI peeks to take position. Fractals are really useful to positioning your stop loss.
It works well on commodities and forex markets.

Swing Hull/rsi/EMA StrategyA Swing trading strategy that use a combination of indicators, Hull average to get the trend direction, ema and rsi do the rest, use it are your own risk expecially at the end of any hull trend
Past Performance Does Not Guarantee Future Results

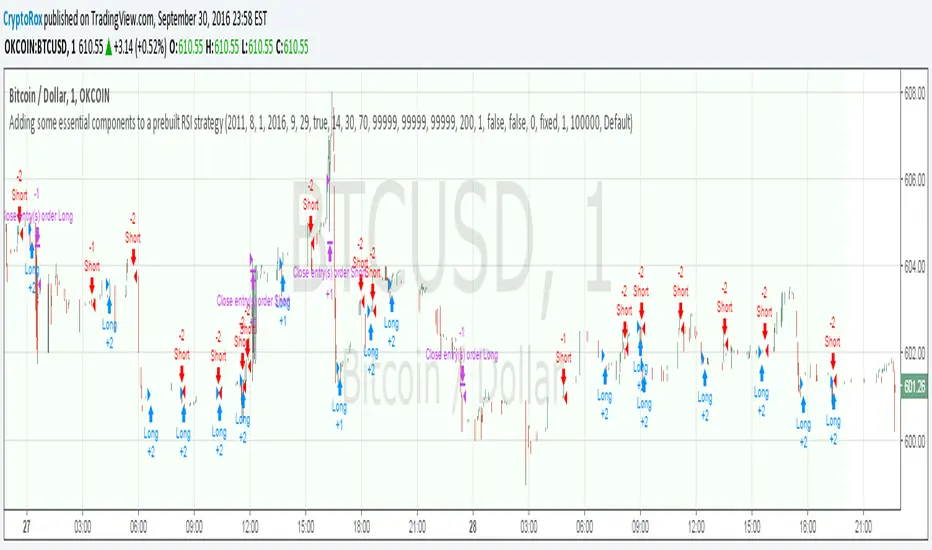
Adding some essential components to a prebuilt RSI strategyThis is more to be used as a blank_slate for any strategy build adding more effective backtesting with a period selector and inputs like TS, TP, SL that can all be used as plots for alerts.
It has the BackTest Component created by Pbergden
It also includes the standard long/short with trailing stop, take profit, stop loss and margin call.
Here is a video using the blank_slate to add in the built-in RSI Strategy.
youtu.be
We hope this brings good results and helps speed things up for everyone.