Cari dalam skrip untuk "rsi"

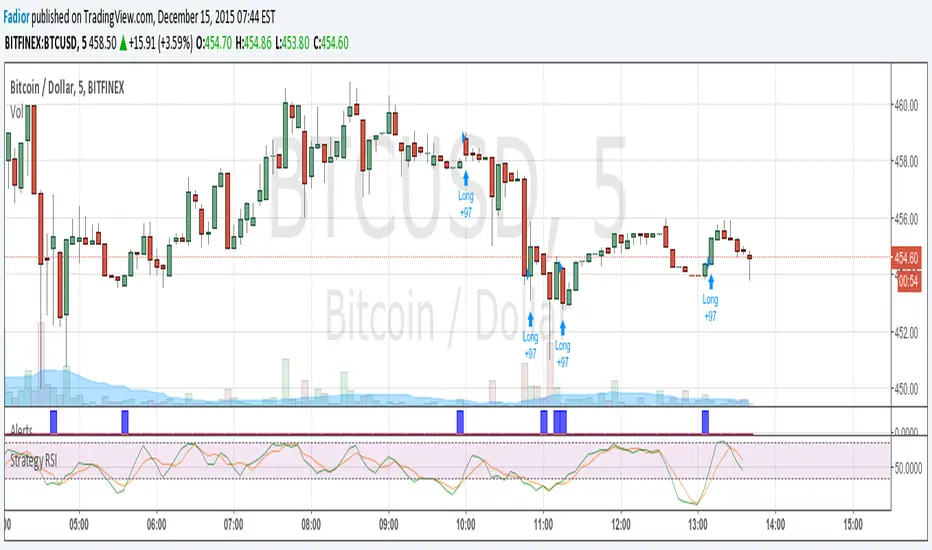
Strategy RSI | FadiorSimple strategy that buy and sell when RSI is under/above a given thresholds. Take profit is set to $3. Beware this strategy doesn't work with other assets.

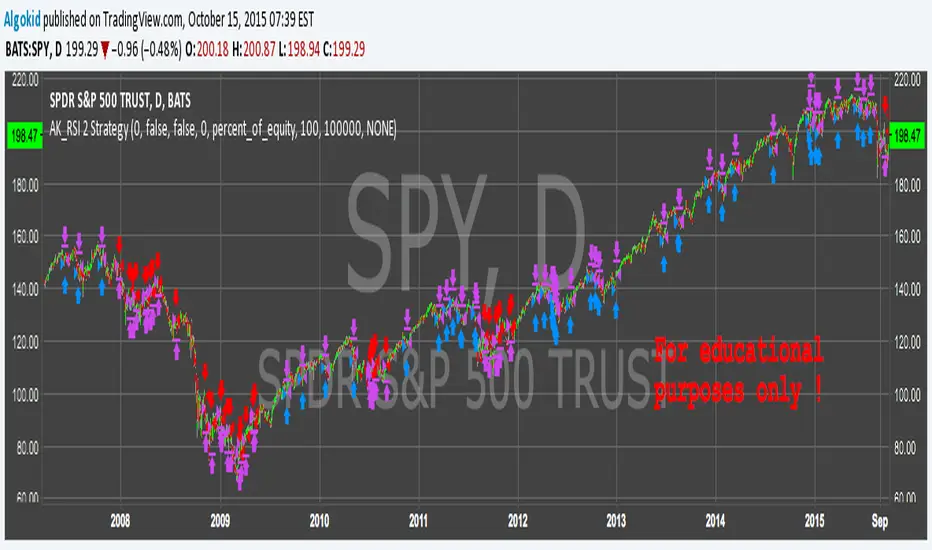
AK_RSI 2 Strategy ( based on Chris Moody RSI(2) indicator )Good Morning,
Republishing this in the script section to make the code visible to everyone. This strategy is based on Chris Moody's RSi(2) indicator. Good success rate on SPY. Again, this is for educational purposes only .
cheers
Algo
rsisma imkind dailyrsi 14
sma 8
time fram : weekly and daily
rsi 14
sma 8
time fram : weekly and daily
rsi 14
sma 8
time fram : weekly and daily
rsi 14
sma 8
time fram : weekly and daily

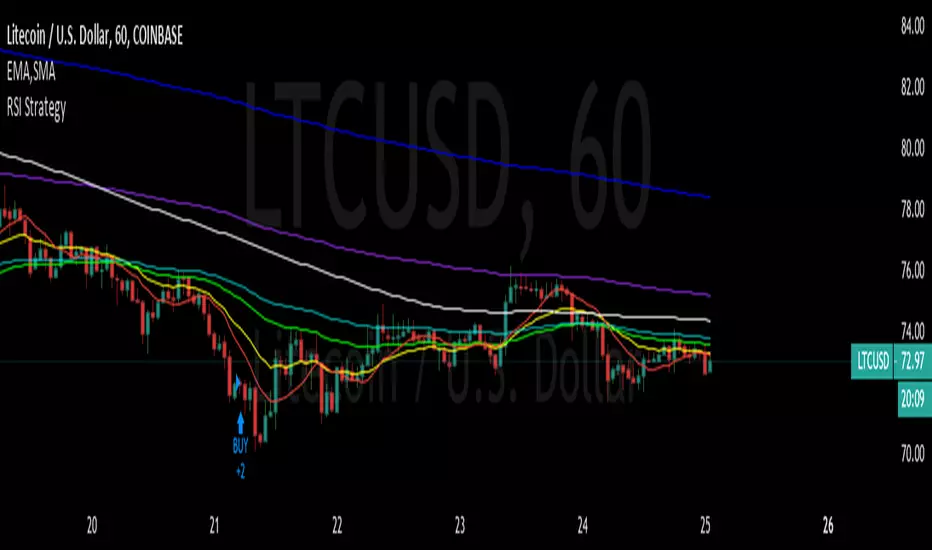
RSI Oversold/Overbought + SMA Crossover Strategymy first strat, to share with my friends, hope you all enjoy


RSI-Adaptive T3 [ChartPrime] — Strategy (Long Only, 1D)This trade has been successfully converted from an individual setup to a full strategy, and the results are truly outstanding. I’m currently testing this for Tesla options trading on the 1-day chart, and it appears to be working extremely well.
A special thanks to ChartPrime for creating such a beautifully designed indicator — it’s performing impressively in these tests.
If anyone would like to try it out, feel free to download and see the results for yourself. Thank you!

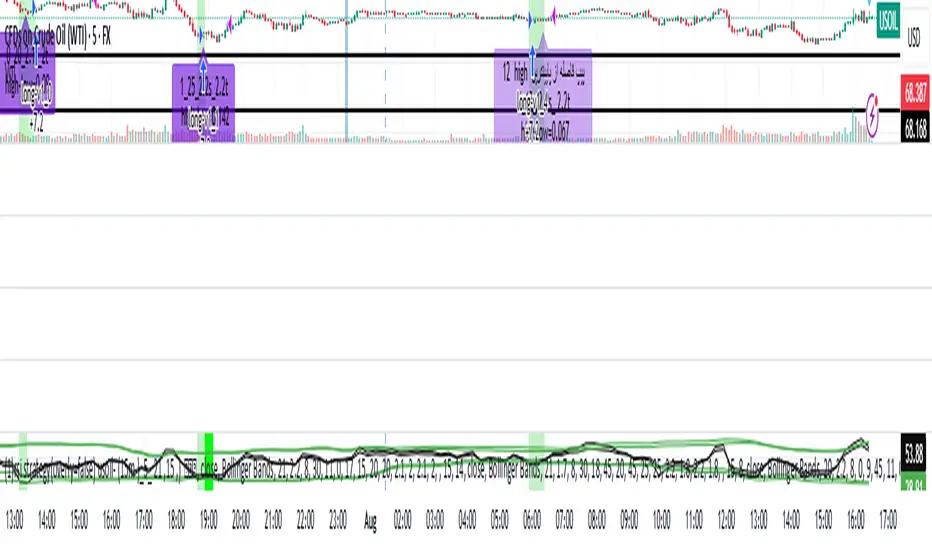
rsi indicator strategyRSIBB Strategy Based on Oversold, Overrbuy Bolinger Band Band. In usoil . Time Indicators is set and the timing is in 5 minutes
An example of Long. When the green marker appears, our entry point is High High If the price fails to reject our High High, our entry will change to the next candlestick. This process will continue until we enter the position.
A marker appears in purple when the green marker appears to us, in which information appears:
The first digit related to the strategist code
The second digit is that we have a few pips to be sure of the candlestick of our entry point
The third digit is our SL that is a coefficient of overall size of yogurt (HIGH - LOW)
Charmin is the digit of our tp that is a coefficient of overall size of yogurt (HIGH - LOW)
In 6 sets
استراتژی RSIBB بر اساس اشباع فروش، اشباع خرید، باند بولینگر. در این روش، اندیکاتورهای زمانی تنظیم شده و زمانبندی ۵ دقیقه است.
مثالی از موقعیت خرید. وقتی نشانگر سبز ظاهر میشود، نقطه ورود ما High است. اگر قیمت نتواند High ما را رد کند، ورود ما به کندل بعدی تغییر میکند. این فرآیند تا زمانی که وارد موقعیت شویم ادامه خواهد داشت.
وقتی نشانگر سبز برای ما ظاهر میشود، یک نشانگر به رنگ بنفش ظاهر میشود که در آن اطلاعات زیر ظاهر میشود:
رقم اول مربوط به کد استراتژیست است.
رقم دوم این است که ما چند پیپ برای اطمینان از کندل نقطه ورود خود داریم.
رقم سوم SL ما است که ضریبی از اندازه کلی ماست (HIGH - LOW) است.
چارمین رقم tp ما است که ضریبی از اندازه کلی ماست (HIGH - LOW) است.
TomSeb StrategyRSI & MACD based. The parameters can be fine tuned to suit the symbol. 0 and 2 are default parameters which work for most symbols.

RSI Strategy Professional ХомячелоХз чим відрізняється. Його лекго використовувати, треба підшаманити пару параметрів і все. Використовую для ринку крипти і норм трейдиться. Індикатор дає сигнал і я зразу залітаю на всю котлєту куди він каже.

Relative Strength Index - MayurRSI backtesting long only portfolio builder.
only for investing at cheap valuations

RSI Strategy with alerts via TradingConnector to ForexSoftware part of algotrading is simpler than you think. TradingView is a great place to do this actually. To present it, I'm publishing each of the default strategies you can find in Pinescript editor's "built-in" list with slight modification - I'm only adding 2 lines of code, which will trigger alerts, ready to be forwarded to your broker via TradingConnector and instantly executed there. Alerts added in this script: 12 and 17.
How it works:
1. TradingView alert fires.
2. TradingConnector catches it and forwards to MetaTrader4/5 you got from your broker.
3. Trade gets executed inside MetaTrader within 1 second of fired alert.
When configuring alert, make sure to select "alert() function calls only" in CreateAlert popup. One alert per ticker is required.
Adding stop-loss, take-profit, trailing-stop, break-even or executing pending orders is also possible. These topics have been covered in other example posts.
This routing works for Forex, indices, stocks, crypto - anything your broker offers via their MetaTrader4 or 5.
Disclaimer: This concept is presented for educational purposes only. Profitable results of trading this strategy are not guaranteed even if the backtest suggests so. By no means this post can be considered a trading advice. You trade at your own risk.
If you are thinking to execute this particular strategy, make sure to find the instrument, settings and timeframe which you like most. You can do this by your own research only.

RSI Divergence + EMA @DaviddTechVery simple strategy that will look for Divergence on the RSI.
My Strategy for this was mixed with the 55 EMA which you can activate in the settings.
WARNING:
- For purpose educate only - My mission is to debunk fake strategies with code to find THE ONE.
- Plots EMAs and other values on chart.
- This script to change bars colors.

RSI Hidden Divergence + Stochastic + 200 EMA @DaviddTechHey Traders,
This is my first strategy of many I hope. Inspired by a strategy I found on YouTube I wanted to see if it would work with a BOT strategy.
The idea is :
## LONG ##
* When the price is above 200 EMA take only LONG positions.
* Look for Bullish hidden divergence.
* Stochastic crossover to find our entry.
## SHORTS ##
* When the price is below 200 EMA take only SHORTpositions.
* Look for Bearish hidden divergence.
* Stochastic crossunder to find our entry.
You can used a fixed percentage, ATR, HH/LL or a FIB level to take profit.
Everything is very visual and can be connected easily to a bot.
I will be doing a video on HOW-TO setup in a couple of days.
## MUTLI LEVEL PROFITS ##
This will show you on backtest is you take profits at 3 levels however I have not tested on a BOT strategy.
NOTE : This is for educational purposes and please test on a paper account, as I said this is my first strategy.
I will be working and back testing new strategies every week.
- Made with ♥ @DaviddTech

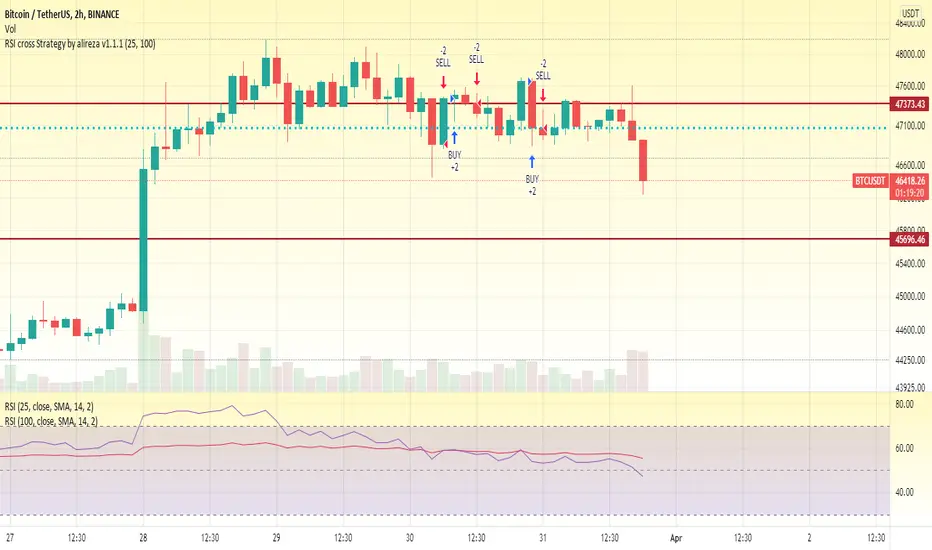
RSI - Oversold BTC StrategyWhen BTC goes through a large swing downward, it often goes into oversold territory and quickly swings back upwards. This strategy is designed to capitalize on the swings without gettings stopped-out with the surrounding volatility. I find that this strategy works best on the 5 minute chart.
You can set the maximum loss (in dollars), trade size (in BTC ), plus your trailing stop and offset (pips).
The blue line on the graph indicates your stop loss point, which trails your buy-in point by your specified maximum loss. Remember, in this strategy, this stop-loss is only used to protect you from unexpected large swings, your trailing stop loss is used to capture profits.

RSI StrategyINTRADAY GO WITH SIGNAL AT THE END OF DAY YOU WILL BE IN PROFITS GURANTEE...............
Just Take Care of one thing only use it for top tarded counters or most volatine scripts...........


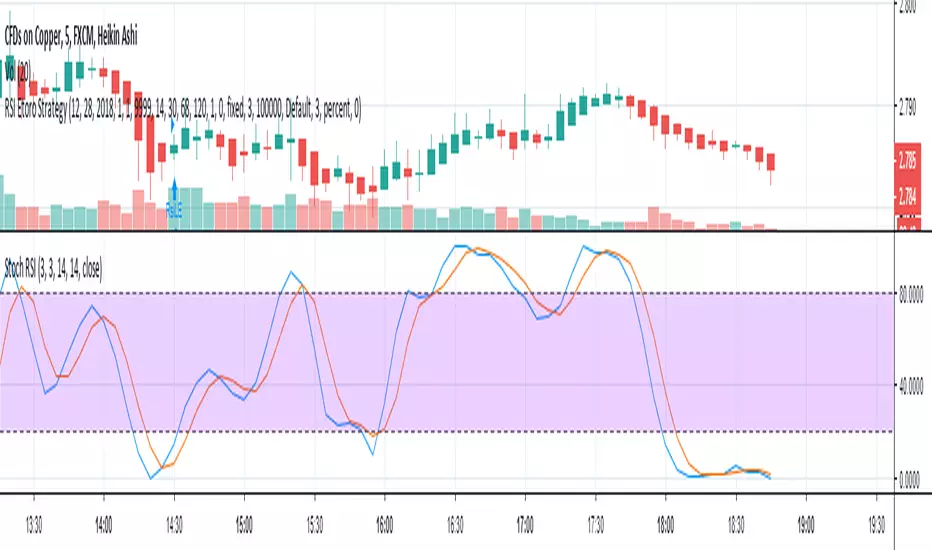
RSI Etoro StrategyTmp (WIP) just for my bro Manu ;)
BTW "Used" on COPPER
Not Good because only one indicator: miss several phenomenon so go to SL stupidly... And fine tuning of parameters is too sensible: it should be adjusted following feedback from other indicators...
Good thing is it takes into account the etoro context (SL at 50%, spread of 3 ticks) and you can back test with any period you want (usefull because parameters depends on "moods")