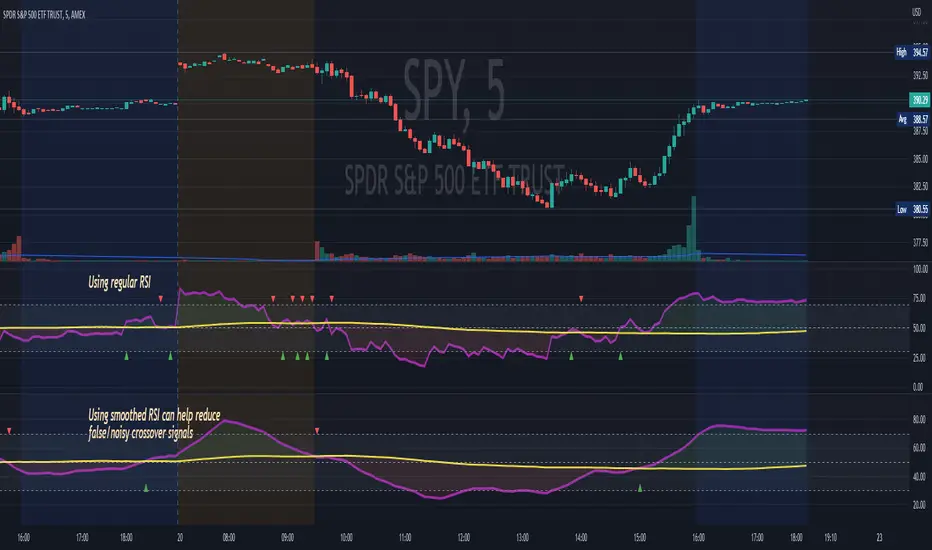
Cari dalam skrip untuk "rsi"
RSI Buy & Sell IndicatorColor coded RSI indicator showing green columns during a BUY opportunity and red columns during a SELL opportunity
RSI based on Kaufman’s Adaptive Moving Average This is RSI based on Kaufman’s Adaptive Moving Average.
Drawing line flatter than normal RSI.
In My sense, it can easier find Divergence than normal RSI.
I use William Delbert Gann's short cycle of "multiples of 7" for the default setting.
Or, you can choose and customize a setting from my preset.
RSI + DivergencesHi Guys,
This indicator gives you the trend changes (Designed with the basics of Vash's RSI advanced and the Fikira divergence indicator)
This indicator will only give you regular divergences.
Please keep in mind that a trading plan is not only built with momentum but also with location and structure.
Good trading,
RSI Bollinger %BIt's an RSI indicator combined with Bollinger %B. This way you just need to check if it is above 1.0 or below 0.0 (Outside Bollinger Bands). You can choose the moving average method used by RSI.
RSI ChannelHello All. For a while this idea (showing RSI levels on the chart as a channel) was in my mind and finally today I developed the script. I hope it will be usefull for all.
Enjoy!
RSI-TEMAJust converted TEMA to RSI type
fast above slow=bullish in lime
slow above fast=bearish in red
fast=blue line
slow=red line
so not so much to write about it but it good as another weapon in arsenal :)
RSI-VWAP INDICATORThis simple indicator provides great results.
It is the popular RSI indicator with VWAP as a source instead of close.
What is the Volume Weighted Average Price (VWAP)?
VWAP is calculated by adding up the dollars traded for every transaction (price multiplied by the number of shares traded) and then dividing by the total shares traded. That is, volume.
On the Backtest, trades are laddered to improve the average entrance price.
RSI PPO DivergenceJust a RSI with 2 Levels and a range (70 to 80) and optical changes to standart RSI.
RSI PivotIt is based on RSI. When RSI crosses (70)up and (30)down bands, it draws a price line.
Cheers :)
RSI with an Opinion (UO)This RSI has a very clear idea about when to buy and sell. It plots buy and sell signals. It is an expert system. Yes, of course, it can make some errors. You should have used stop-loss
RSI Scaling (UO)Plot price scaled by the RSI. Also, plot high and low of the scaled price so that the trend is visible as well as sell-high/buy-low points...
Before the prices change direction, RSI generally makes a double top/bottom... Or a lower high/higher low.
This is more emphasized on the scaled price. You can see the high/low band change direction
RSI Buy and SellThis is sooooooooo simple.
Buy when RSI is above 70 and don't sell til it'sunder 30.
Multi TF - RSIRSI with 5 timeframes, you can change the TF it in the configs.
This one has 1h, 2h, 4h, Daily and Weekly.
RSI + StochasticsSuper basic concept.
Take profit when both rsi and stochastic are overbought and vice versa.
Overbought and oversold are not necessarily indications that a market will reverse contrary to what some people teach. Markets can stay overbought much longer than oversold and therefore I find more value from the oversold signals(red signals).
Occasionally these signals will catch the exact top/ bottom but it would be risky to take a trade based on these signals alone. You can see these signals as take profit signals or even signs of a possible reversal.
Given the nature of these two indicators it will not perform well in a strong trend, so always use with confluence. Personally I would only use the oversold signals but I left it in case anybody finds it useful.
RSI StrategyNothing special in this strategy its just purely and application of RSI in 1hour chart of XAUUSD.
RSI STEP TRENDthis is script based on lazy bear special rsi and alex trend step
so it look like a nice hybrid together:)
signal and alerts inside