Indicators & Conditions Test Framework [DTU]Hello All,
This script is a framework to build strategies by combining indicators and conditions (long, short, exits). You are able to analyze your strategies in realtime by changing the input parameters related to indicators, conditions and their combinations.
OVERVIEW
With this Study/Strategy framework, you will be able to create strategy conditions, display them on the chart, and test them using existing indicators as well as external and custom indicators that you can add.
The main purpose of the Framework is to choose your indicators to be used in the conditions and test your strategy by producing your "Long, short, Exit long, Exit short" combinations.
Although may be, it can be a bit difficult and complicated at first start, but you can understand the logic on its use in a very short time.
Notes:
I removed external links off descriptive images and video to be comply with Trading view violation House Rules
Since I am new in the community and still trying to understand the pine script language I can make errors and violations on my script. Please Inform me on any issue that I made..
HOW TO
STEP 1: SETTINGS ______________________________________________________________________________________________________
SOURCE, TIMEFRAME, SECURITY
Select the Source, timeframe and Secure type that your indicators will use.
Here, the Secure entry consists of 3 parts and the f_security function is used to determine it.
a)Secure
This option is defined as reducing repaint in tradingview calculations as much as possible. The following function is used.
request.security(_symbol, _res, _src , lookahead=barmerge.lookahead_on)
b)Semi Secure
While this option can reduce repaint in tradingview calculations as much as possible, it is less secure. The following function is used.
request.security(_symbol, _res, _src )
c)Repaint
This option turns on the repaint feature. The following function is used.
request.security(_symbol, _res, _src ) : na
Ind Source:
You can the source that indicators will use their own calculations
Ext Source:
You can import external Indicator sources from here . It appears on condition/combination area as "EXT".
To export the External indicator plot it with a title. It will be visible in source dropdown input
PERIOD , ALERTS...
Period:
Determine your strategy testing period by selecting start and end date/time
(!!! According to your tradingview subscription, it takes the last 5000, 10000.. bars.
The extra bar option may cause problems such as not appearing in the calculations or errors).
Plot Alerts:
Plot condition result as alerts arrows on the chart's bottom for "LONG" and the top for "SHORT" entries, exits
Close on opposite:
When selected, a long entry gets closed when a short entry opens and vice versa
Show Profit:
It appears if script is in strategy mode (not in study) this can display current or open profit for better reanalyzing your strategy entry exit points. (Currently under development)
PLOT TYPE OPERATIONS
This option has 4 entries
a) Mult
Sets the multiplier for the selected Plot Type (stochastic, Percentrank, Org Range (-1,1) ) except for "Original" in the range (-1,1).
EXAMPLE: When 1000 is selected, the indicator in the range of (-1,1) will appear in the range of (-1000, 1000) on the screen.
b) Shift
It determines the shift that will appear on the screen for the selected Plot Type (stochastic, Percentrank,Org Range (-1,1) ) in the range (-1,1) other than "Original".
EXAMPLE: When Shift:35000 and mult:1000 are selected, the indicator will appear in the range (34000, 36000) on the screen.
c) Smooth
This option (only for Stochastic & PercentRank) allows to smooth the indicator to be displayed.
Here, tradinview ta.swma function is used.
b) hline
Adjusts the horizontal lines to appear on the screen according to the mult factor for the range (-1,1)
The lines represent the values (-1, -05, 0, 05, 1)
STEP 2: INDICATORS ______________________________________________________________________________________________________
You need to choose indicators that you can use in strategy conditions.
Here, the indicators come from the dturkuler/lib_Indicators_DT open script library defined in the code
In addition, you can add the indicators that you will create in the area defined in the code to this list..
You can also import external indicators and test them with other variables on the system..
You can choose a maximum of 5 indicators that you can use in total. (can be increased in new versions)
Indicators are categorized in 3 main sections
Indicator Selection:
You can select your indicators from this area
a)Moving Averages
These are indicators such as EMA, SMA that you can show on the stock. They come from the library.
These indicators are fed from Settings/source. Only the length value can be used as a parameter.
In addition, line colors can be changed..
As of now, there are 28 indicators in the library in total and 5 indicators are left as future use for this field for now.
b)Other Indicators
These are different indicators from the stock value such as RSI, COG. They come from the library. These indicators are fed from Settings/source.
Only the length value can be used as a parameter. In addition, line colors can be changed.
As of now, there are 24 indicators in the library in total and 5 indicators are left as a future use for this field for now.
c)Custom Indicators
These indicators are the ones you can create by programming yourself in the source code..
The area at the bottom of the settings screen is reserved for the parameters of this type of indicators.
Indicator Length:
You can update your selected indicator length value from here. (Not: it doesn't work for custom indicators since they have their parameter on cust. Ind. input screen )
Indicator Plot Type:
Next to the indicators, there is an input selection field about how they will be displayed on the screen.
a)Original
The indicator is displayed on the screen with its current values. It is an ideal solution for displaying moving average indicators such as (EMA, SMA) over current stock.
Since the values of indicators such as (RSI, COB) are low (-100,100 : -1.1), they appear at the bottom of the screen and make analysis difficult.
For this reason, other options may be more suitable for these.
b)Stochastic
The indicator is displayed on the screen with stochastic calculation in the range of -1.1.
It uses the stochastic(50) calculation method to spread indicators such as (RSI, COB) over the range (-1,1).
Indicators in this selection can be fixed and monitored under stock on the screen with the parameters under the Plot Type section.
You can see the original values of the relevant indicator on the Data Window screen.
(!!! Do not use the values on the chart in your condition calculations. Instead, get the values from Data Window)
c)PercentRank
The indicator is displayed on the screen with stochastic calculation in the range of -1.1. .
Since the values of indicators such as (RSI, COB) are low (-100,100 : -1.1), they appear at the bottom of the screen and make analysis difficult.
Indicators in this selection can be fixed and monitored under stock on the screen with the parameters under the Plot Type section.
You can see the original values of the relevant indicator on the Data Window screen
((!!! Do not use the values on the chart in your condition calculations. Instead, get the values from Data Window)
d)Org Range (-1,1)
If your indicator is in the range of -1.1, your indicator will be displayed on the screen with its original calculation in the range of -1.1.
Indicators in this selection can be fixed and monitored under stock on the screen with the parameters under the Plot Type section.
You can see the original values of the relevant indicator on the Data Window screen.
(!!! Do not use the values on the chart in your fitness calculations. Instead, get the values from Data Window)
STEP 2 NOTES:
STEP 3: CONDITIONS ______________________________________________________________________________________________________
After choosing the indicators you will use in the conditions, you move on to the "CONDITIONS" section.
There are 4 conditions type here.
• LONG ENTRY CONDITION
• SHORT ENTRY CONDITION
• LONG CLOSE CONDITION
• SHORT CLOSE CONDITION
The use of each condition is the same.
There are 3 combinations you can use in each condition. (can be increased in new versions)
a)COMBINATIONS
There are 3 combinations you can use in each condition. (can be increased in new versions)
Each combination are build from 4 parts
1)1st Indicator
If set to "NONE" this combination will not be used on calculations. You can select
IND1-5: from indicators (See above),
EXT: value from externally imported indicator
Stock built-in values: close, open...
2)Operator
Selected Operator compares 1st Indicator with the 2nd one. You can select different operators such as
crossover, crossunder, cross,>,<,=....
3)2nd Indicator
This indicator will be compared with the 1st one via selected Operator. You can select
IND1-5: from indicators (See above),
VALUE: a float value defined in the combinations value parameter
EXT: value from externally imported indicator
Stock builtin values: close,open...
4)Value
When the 2nd indicator field is "VALUE", value area compares the entered value.
ex: 1st indicator="open", op=">", 2nd indicator="VALUE", value=3000.12 means is(close>3000.12)
In other conditions, it compares the previous values of the indicator.
ex: 1st indicator="open", op=">" 2nd indicator is "close" and value is 2 means is(open>close )
EXAMPLES:
indicator 1= "IND1", Operator=">", indicator 2= "IND2" => is(IND1>IND2)
indicator 1= "IND1", Operator=">", indicator 2= "VALUE", "0.1" => is(IND1>0.9)
indicator 1= "IND2", Operator="crossover", indicator 2= "IND1" => is(IND2 crossover IND1) : like a=ta.crossover(IND2, IND1)
indicator 1= "IND1", Operator="<", indicator 2= "close" => is(IND1>close)
indicator 1= "IND1", Operator="<", indicator 2= "EXT" => is(IND1>EXT) , EXT mean external imported indicator that define on settings section
indicator 1= "IND1", Operator="<", indicator 2= "IND1", Value="1" => is (IND1>IND1 )
b)JOIN COMBINATIONS
Each combination in Condition is compared with the next one via JOIN operator
The join operator can be selected as AND or OR.
Examples:
1st combination= is(IND1>0.9) true
2nd combination= is(IND2 crossover IND1) false
1st combination "AND" 2ndcombination" => false (is(IND1>0.9) AND is(IND2 crossover IND1))
1st combination "OR" 2nd combination" => true (is(IND1>0.9) OR is(IND2 crossover IND1))
STEP 3 NOTES:
When the 2nd indicator field is "VALUE", value area compares the entered value. In other conditions, it compares the previous values of the indicator.
In cases where "VALUE" is not selected, integer values must be entered in this field. (float should not be entered. ie 1, 2 should be entered)
!!!If the 1st indicator is "NONE" in the combination, that combination is cancelled.
Each combination returns true/false, allowing the selected value to be compared with another value
Example: EMA(21)>EMA(50) returns true under all conditions or (EMA(21) crossover EMA(50)) returns true when passed.
You can use , Value of 5 indicators (IND1-IND5) or (VALUE) that you have defined in combinations or import indicator (EXT) or stock values (close, open, high...) in your calculations.
combination Compares the 1st indicator with 2nd indicator via the operator.
STEP 4: CUSTOM INDICATORS ______________________________________________________________________________________________________
There is an area in the code for designing Custom Indicators.
Here you can design your own indicators and use them in the framework.
You can also create unlimited parameters for your indicators in the SETTINGS custom indicator field.
For now, only 3 Custom indicators have been defined.
Examples are entered in the code for custom indicators.
STEP 4 NOTES:
Including / updating custom to the code is explained in the source code
• LIMITATIONS:
!!! According to your tradingview subscription, it takes the last 5000, 10000.. bars. More bar options may cause problems such as not appearing in the calculations or errors.
• RAMBLINGS:
• NOTES [ /i]
This Script can be used as an indicator if the last strategy parts in the code are commented out and converted to the initial strategy study.
It was originally prepared for my use with my own strategy framework and has export functions accordingly.
When integrated to my own strategy framework it brings many more features over strategy definition of trades.
• TODO [ /i]
TODO: Add tooltips to the settings screen
TODO: Add double triple, Quatr factor for all indicators (convert any indicator to factor2-4 facotr. ex: EMA to DEMA, TEMA, QEMA...)
TODO: Add factorized Fibo avg range indicator (good for trend definition and entry exit points)
TODO: Add bands to the indicator and conditions
TODO: Add debug window for exporting indicator's parameters
TODO: Add isRising(value) isFalling(value), is...(value) .... to combinations (they can be used as custom indicator also
TODO: Reassess condition entry screen for user friendly GUI
TODO: Increase # conditions from 3 to 4
TODO: Reassess strategy entries, exit and close (should be improved)
TODO: Add Alerts, Condiional alerts for indicator (study) part
TODO: Create export function v3 for Pinecoders Indicator framework
• THANKS:
For Pine script format docs RicardoSantos .
For Pine script coding standards Pinecoders .
For moving average script used on library s RodrigoKazuma .
Cari dalam skrip untuk "rsi"

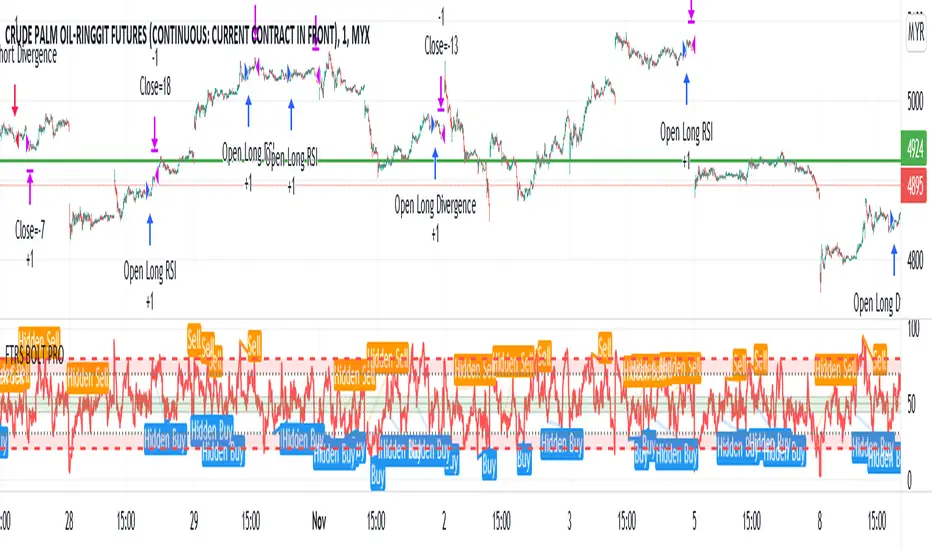
FTRS BOLT PRO
The script uses RSI as major trend identification and supported by RSI divergence for take profit, and also counter trend in certain cases.
Uses EMA 200 for major trend identification to filter false signals, Average Volume as confirmation and faster signal detection to the change of trend.
The indicator detects immediate change of trend and immediately opens position for the major trend.
User can enjoy the RSI with labels of divergence to do manual judgement.
Existing risk to reward ratio based on amount of money instead of ticks count. The currency is depending on the chart's trading currency.
This strategy mainly built for FCPO and its for 1 min settings only. User can toggle the sessions as per users preferences
The default risk to reward ratio is 1:1.5. However, there is a risk management using RSI levels to
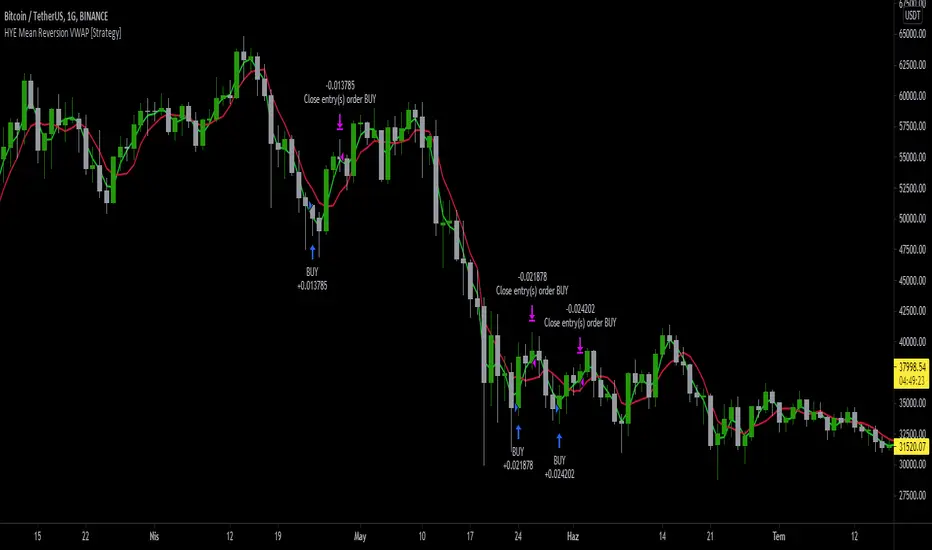
HYE Mean Reversion VWAP [Strategy]An RSI filtered version of PJ Sutherland's Jaws Mean Reversion algorithm using volume weighted average price (VWAP) instead of simple moving average (SMA).
"Long" on the close when;
1-) 2 period VWAP closes 3% or more below the 5 period VWAP ,
2-) 5 period exponential average of the 2 period RSI is below 30.
"Exit Long" on the close when;
1-) 2 period VWAP closes above the 5 period VWAP.
"Short" on the close when;
1-) 2 period VWAP closes 3% or more above the 5 period VWAP ,
2-) 5 period exponential average of the 2 period RSI is above 70.
"Exit Short" on the close when;
1-) 2 period VWAP closes below the 5 period VWAP.
*** You can change the needed percentage for long and short trades, periods of VWAPs and RSI levels.
*** You can select the trend direction: "Long Only" , "Short Only" or "Both". Default is "Long Only".
I used the "VWAP with period" indicator code of @neolao. Special thanks to @neolao.
Indicator Link:
HYE Mean Reversion SMA [Strategy]An RSI filtered version of PJ Sutherland's Jaws Mean Reversion algorithm.
"Long" on the close when;
1-) 2 period simple moving average closes 3% or more below the 5 period simple moving average,
2-) 5 period exponential average of the 2 period RSI is below 30.
"Exit Long" on the close when;
1-) 2 period simple moving average closes above the 5 period moving average.
"Short" on the close when;
1-) 2 period simple moving average closes 3% or more above the 5 period simple moving average,
2-) 5 period exponential average of the 2 period RSI is above 70.
"Exit Short" on the close when;
1-) 2 period simple moving average closes below the 5 period moving average.
*** You can change the needed percentage for long and short trades, periods of simple moving averages and RSI levels.
*** You can select the trend direction: "Long Only" , "Short Only" or "Both". Default is "Long Only".

Scalper Helper System===========================================================================
===========================================================================
Description
===========================================================================
===========================================================================
Scalper Helper System combines a series of trade strategies which have been learned and honed in the Jim of All Trades channel.
Paixy has contributed candlestick combination rules, Jonas has shared his deep understanding of Stochastic.
Jim himself has taught clearly on the merits of RSI.
This system attempts to formulate all the notes and rules I have made over the past months.
The system searches for 10 - 15 rules which are divided into bullets and bombs. Bombs relate to momentum, so these signals may not be pinpoint accurate, but they are more often leading to bigger moves.
This initial version is released mainly only to the JOAT community to help continue the development of the idea and to help find
continued improvements.
Special thanks to FiendishFeather for his strategy work, (check out his work to learn how to apply any trading strategy to his back testing harness), and the date filtering snippet and the tip to show this option at the top.
===========================================================================
===========================================================================
The strategy decisions are based on the following general rules:
===========================================================================
===========================================================================
BULLETs are hint to the idea of firing a small sized position into the market, BOMBs are hints to go all in - however this does not mean proper risk management should be forgotten.
Without risk management this and any strategy will lead to failure.
Without risk management this and any strategy will lead to failure.
Without risk management this and any strategy will lead to failure.
Without risk management this and any strategy will lead to failure.
===========================================================================
Bullet1 uses the value of the stochastic and checks for buy/sell cross over on 5m, 8m and 13m chart.
These values should be calculated on a ratio basis ideally.
Bullet2 measures divergence between the printed Stochastic signals.
Bullet3 has been decommissioned.
Bullet4 is an RSI divergence and value indicator.
Bullet5 has been decommissioned.
Bullet6 uses the history of the stochastic buy and sell signals
Bullet7 uses the Scalper Helper Trends for entries by attempting to see how the overall trend is changing. More refinement is needed here.
Bullet8 uses the Scalper Helper Trends on multiple timeframes for entries.
Bullet9 strict buy/sell signals from Stochastic RSI
Bomb1 relies on the Fast, Medium and Slow MA's being correctly lined up as well as the Stochastic, this hints at a more imminent move and so the strategy suggests a quicker entry.
Bomb2 relies on the Fast, Medium and Slow MA's NOT being correctly lined up as well as the Stochastic, and therefore has the luxury of suggesting Limit orders near the local high/low.
Bomb3 looks for two or more Stochastics signals in the same direction and then performs a divergence calculation.
Bomb4 looks a change in the Stochastics signals direction and then performs a divergence calculation.
===========================================================================
===========================================================================
Configuration settings:
===========================================================================
===========================================================================
Users can chose to show mainly buy and/or sell signals and can select a level of strictness. Enabling strict rules will force a multi timeframe comparison of Stochastic analysis.
Users can try different levels for long and short targets for profit and stop loss. This is important because the market does not behave the same going up as it does going down.
The RSI conditional check makes the strategy more selective. This discernment can be applied to bullets or bombs in order to validate entry and exits.
During the bull run and perhaps even in ranging markets, the RSI overbought levels is usually 70-80, but in the bear market we are seeing in Crypto now, a value of 60 is more useful. Try for yourself to see what works for you and feedback in the comments.
An additional indicator, Scalper Helper Trends is recommended to get a quick view on the trend condition (rally, base, down) by viewing the MACD from multiple time frames. Further research is required to know which larger timeframes work best here.
For the 15min chart, 15m, 30m, 45m, 60m, 120m, 240m, 360m, 960m would work well. Note it is not possible to go higher than 1000 at this time.
Whether you use the Scalper Helper trends or not for your own visual confirmation, it is possible to allow this indicator to attempt to read it for you. More research is required to best model the reading of this. For now, it will simply measure the gradient of the number of up versus down colors.
The system can also find entries off the Scalper Helper Trends - but really this, by design is not the best use of Scalper Helper Trends. Although you may prove me wrong so the option is given for you to find buy/sells with your own testing.
Users can chose to use some engulfing candle arrangements to trigger exits and define the length of the 200MA and decide if this should play a part in the filtering of the signals. Similarly, a check can be made to ensure that the first two candles after a signal are behaving as we would expect with the "Wait for 2 closing in the direction of the signal" option. This has a lot of value on the 1min chart.
When Revenge trade is set to true you may re-enter a trade in the same direction as the last one when the last one was stopped out, otherwise you would only be looking for trades in the other direction. We all should not revenge trade, and indeed I have only seen a few cases when it has increased the profitability, however this option remains for now.
The flip opens a new trade in the reverse direction when a signal is given to close a trade, but does not apply to scenarios where stop losses or take profit closed the trade.

Stock Buy/Sell BotHello everyone, I've been making this strategy for a few weeks now. I finally feel like it's time to release it to the public so I can share what I have been working on.
This strategy only enters a long trades when the MACD crosses over the signal line and the RSI is oversold . The logic behind this is to wait for RSI to enter the oversold territory, and then when the market starts to recovery the MACD will crossover telling us the sell off is over and when are bot to buy.
ADDONS That Affect Strategy:
* Modify RSI oversold and RSI overbought levels.
* Modify MACD Fast and Slow moving average.
Thank you for taking the time to use and try my strategy. I hope you have the best success. I will be making a short strategy, and alerts for this strategy soon so you can automate it. Follow me for updates!

Cyatophilum Strategy BuilderAn indicator to create strategies, backtest and setup alerts.
The user can choose one or multiple TA entry conditions, if more than one the conditions are combined with a logical AND.
The entries will open up a trade, which is then handled by a risk management system including Trailing Stop, Take Profit and up to 100 Safety Orders.
This indicator can be used to backtest 3commas DCA bots who are using TA presets, RSI or ULT.
Its main goal is to create strategies by combining indicators.
Let's dive into the details of what's included:
Entry Condition: MACD
Triggers an entry when macd crosses with the signal line.
Configure the fast, slow length, signal smoothing and timeframe to trigger the condition.
Entry Condition: RSI
Triggers an entry when the RSI is higher or lower than the long/short threshold.
Configure the length, timeframe, long and short threshold to trigger the condition.
Entry Condition: ULT (Ultimate Oscillator)
Triggers an entry when the ULT is higher or lower than the long/short threshold.
Configure the 3 lengths, timeframe, long and short threshold to trigger the condition.
Entry Condition: Bollinger Bands
Triggers an entry when the price is above the upper band for long and below the lower band for short.
Configure the length, standard deviation and timeframe to trigger the condition.
Entry Condition: MFI (Money Flow Index)
Similar to RSI, it triggers an entry when the MFI is higher or lower than the long/short threshold.
Configure the length, timeframe, long and short threshold to trigger the condition.
Entry Condition: CCI (Commodity Channel Index)
Another oscillator that triggers an entry when its value is higher or lower than the long/short threshold.
Configure the length, timeframe, long and short threshold to trigger the condition.
Trend Filters
Use one or two trendlines to filter your trades: go only long/short when the trendline is bullish/bearish.
Choose between the several trendlines: ema, sma, wma, hull ma, kama, alma, rma, swma, vwma, Tilson T3, and the unique Adaptive T3 and Adaptive Hull MA.
If this is not enough, you can use the external trendline feature to plug in any other indicator for your trendline.
The second trendline can be MTF and come from another symbol if needed.
Combining Indicators
Most of the time we will not be using a single indicator at a time, but instead, combine them in order to get stronger entries.
The entry conditions are combined using a AND logical gate, meaning all conditions must be true for the entry to trigger.
Here is an example using a combination of 2 indicators: Bollinger Bands and RSI.
We can see less entries are being triggered on the bottom chart than on the top chart because the bottom chart is combining the 2 indicators while the top chart is only using Bollinger Bands.
You can combine up to all 6 indicators if you want, but keep in mind that combining too many may lead to triggering no entry at all.
Risk Management and Trade system
The indicator will not trigger more than one long or short entry in a row.
To start a new trade, the indicator will wait for either take profit, stop loss or an opposite entry if no SL and TP is set.
Stop Loss and Take Profit
Configure your stop loss and take profit for long and short trades.
You can also make a trailing stoploss and a trailing take profit.
Safety Orders
Just like 3commas bots, you can create a strategy with up to 100 safety orders.
Configure their placement and order size using the price deviation, step scale, take profit type (from base order or total volume), and volume scale settings.
Note: only the 20 first safety order steps or so will be plotted due to graphic limiations. The steps after that still trigger alerts and backtest results.
Creating Alerts
The indicator is using the newest alert system:
1. Write your alert messages in the indicator settings (alert section at the bottom)
2. Click "Create Alert" as usual, but choose "alert() function calls only"
Data Window
Since the indicator is applied on top of the price chart, the oscillator indicators cannot be plotted. You can always add them on another pane but if you want to just see their values, you can use the Data Window to see the value of each oscillator on each bar.
Backtest settings
Used to get the results below:
Initial Capital: 100 000$
Base Order Size: 0.1 contract (BTC)
Safety Order Size: 0.1 contract (BTC)
Commission: 0.1%
Slippage: 100 ticks
pyramiding: 6
The indicator settings are plotted in the main chart panel.

TRSI STRATEGYThis strategy is based on our very first indicator TRSI .
Which is at the same time made of TRIX, RSI and EMA indicators.
Use TRSI to see how the strategy and indicator behaves on your chart.
Make sure to use the same values on strategy and indicator options.
Entry conditions
Buy and sell signals are generated when TRSI's lines cross above and below 60 and 40 line levels.
Buy - TRSI line crosses over its EMA line above 60 horzontal line
Sell - TRSI line crosses under its EMA line below 40 horzontal line
Close position when lines cross in backwards direction
Recommendet timeframe - 60 min.
Default values (for BTC):
TRIX - 14
RSI - 6
EMA -6
Top line - 60
Bottom line - 40
Supplementary indicators
In options menu of the strategy you may switch on two EMA and bollinger bands indicators to
make extra decision while analysign your chart. Useful if you have limitation on indicator quantity on the chart.
Repaint
The strategy doesn't use lookehead and time security functions.
The entries are generated on confirmation of bar close.
------------------------------------------------------------------------------------------------------------------------------------------
Данная стратегия основана на одном из наших первых индикаторов TRSI ,
который в свою очередь был сделан из трех других индикаторов TRIX, RSI, EMA.
Используйте TRSI на графике чтобы визуально понять как индикатор и стратегия ведут себя.
Используйте одинаковые параметры в индикаторе и в стратегии.
Вход в позицию
Сигналы на покупку и продажу генерируются при пересечении линий TRSI над и под уровнями 60 и 40.
Покупка - линия TRSI пересекает сверху вниз свою EMA над уровнем 60.
Продажа - линия TRSI пересекает снизу верх свою EMA под уровнем 40.
Закрытие позиции при обратном пересечении линий.
Рекомендуемый таймфрейм - 60 минут.
Настройки по умолчанию (для BTC):
TRIX - 14
RSI - 6
EMA -6
Top line - 60
Bottom line - 40
Дополнительные индикаторы
В настройках стратегии можно включить две EMA и полосы боллинджера для дополнительного анализа
при принятии решения входа в позицию. Полезно если у вас ограничение на количество одновременных индикаторов на графике.
Репэйнт
В стратегии не использованы lookahead и временные security функции, которые могут привести к репэйнту.
Входы в позицию генерируются по подтверждению закрытия бара.

Bull Call Spread Entry StrategyThis strategy script uses the "Spread Entry Strength" overlay indicator script I designed to show entry timing optimized for an Option Bull
Call Spread.
As for this strategy...
The defaults for the strategy itself are as follows:
Period for strategy: 1/1/18 to 12/1/2021. This can be changed to a different period using the settings.
Condition for entry:
Bull Spread Entry Strength >= "Overlay Signal Strength Level"
Limit entry is used, price must be <= close when signaled
Entry occurs by next day or the order is cancelled
Condition for exit (uses a timed exit):
Bars passed since order entry >= 30 (6 weeks..~42 calendar days)
Thursday (day before "option" expiration date... assuming weekly options exist)
All of the user settings from the overlay are pulled into this for customization purposes. Details of the actual Spread Entry Strength overlay are as follows (copied from my shared indicator):
2 background shadings will occur:
The background will shade blue if the ticker is prime for a Bullish Call spread.
The background will shade purple if the the ticker is prime for a Bearish Put spread.
In theory, if the SE Strength is at one of the extremes of the Bear or Bull side, then a spread is prime for entry.
To calculate this, 8 conditions receive a 1 or zero dependent on whether the condition is true (1) or false (0), and then all of those are summed. The primary gist of the strength comes from Nishant's book, or my interpretation thereof, with some additives that limits what I need to review (such as condition 8 below.)
The 8 Bull Conditions are:
1) Bollinger Bands are outside of the Keltner Channels
2) ADX is trending up
3) RSI is trending up
4) -DI is trending down
5) RSI is under 30
6) Price is below the lower Keltner Channel
7) Price is between the lower Bollinger Band and the Bollinger basis.
8) Price at one point within the last 5 bars was below the lower Bollinger Band
The 8 Bear Conditions are the inverse conditions (except the first):
1) Bollinger Bands are outside of the Keltner Channels
2) ADX is trending down
3) RSI is trending down
4) +DI is trending up
5) RSI is over 70
6) Price is above the upper Keltner Channel
7) Price is between the upper Bollinger Band and the Bollinger basis.
8) Price at one point within the last 5 bars was above the upper Bollinger Band
There is a "market noise" filter that will filter out shading when another market move is considered, i.e. if you don't want to see the potential trade when QQQ moves more than 1% then do the following in the settings:
Check "Market Filter"
Enter QQQ in the "Market Ticker To Use"
Enter 1 in the "Market Too Hot Level"
Press Ok
Obviously, the same holds true for the "Market Too Cool Filter."
Second release notes:
Overlay Signal Strength Level - You can set your own "level" for the overlay in the settings, instead of having to change the script code itself. I have the default set to 6. A lower number shows more overlays, a higher number shows fewer (i.e. more conditions have been met.).
Provide Narrative (Troubleshooting) - Narrative label created with several outputs that will show after the last bar. This narrative needs to be turned on in the settings, as the default is "off" ... unchecked.
Remove Strength Indicator When Squeezed - when checked no overlays will be produced regardless of "scoring." Default is off.
Show Squeezes (Will Override Indicator When Concurrent) - overlays an orange background when the ticker is in a squeeze. I am still working on the accuracy here, but it's usable. This will override the strength indicator as well. This needs to be turned on, if you want it.
Short SMA Period - period used to calculate the short SMA, used in the narrative only, at this point in time.
Medium SMA Period - period used to calculate the medium SMA, used in the narrative only, at this point in time.
Long SMA Period - period used to calculate the medium SMA, used in the narrative only, at this point in time.
Outside of the settings... a few calculation adjustments here and there have occurred and some color shading adjustments to allow for the adjustable level setting.

HFT Divergence Hunter BacktesterDefault Settings are meant to be used in BTC /USDT chart on 5 min time frame on Binance Futures . If you want to use for another asset on another time frame YOU MUST CHANGE THE SETTINGS
This is a divergence finding strategy developed by HFT Research. It is a highly customizable strategy and provides endless opportunities to find profitable trades in the market.
Default Settings are meant to be used in BTC /USDT chart on 5 min time frame on Binance Futures . If you want to use for another asset on another time frame YOU MUST CHANGE THE SETTINGS
This is a divergence finding indicator developed by HFT Research. It is a highly customizable indicator and provides endless opportunities to find profitable trades in the market.
Use Envelope , this is the main decision maker in this strategy. The idea behind is that you choose the length of the moving average and set an offset % to create an upper and lower band. If you click on “display envelope” you will be able to visually see the band you have created. This way, you get to scalp the market as the price is diverging and moving away from the moving average. As the famous saying goes, moving averages act like magnets and prices always visits them back. Using this ideology, we aim to capitilize on the price swings that move away from the chosen moving average by x%.
STARC Bands ;
These are two bands that are applied above and below a simple moving average of an asset’s price. The upper band is created by adding the value of the average true range (ATR) or a multiple of i. The lower band is created by subtracting the value of the ATR from the SMA . The channel can provide traders with ideas on when to buy or sell. During an overall uptrend, buying near the lower band and selling near the top band is favorable. However, from our testing results it does fairly poorly in crypto markets while it does pretty well in traditional markets.
Use RSI ;
One of the most commonly used indicators in the trading world. The idea is simple, buy when its oversold and sell when its overbought. You can use RSI as a secondary confirmation of the dips. It can be turned on and off.
Use MFI
MFI stands for Money Flow Index and it is an oscillator like RSI . However, it does track the price in a different fashion than RSI providing a reliable option. It uses the price and volume data for identifying overbought and oversold signals in an asset.
Use Fisher Transform
Even though, it has a funny name, Fisher is actually a very decent and reliable indicator. It converts the prices into a Gaussian normal distribution channel. Therefore, the indicator detects when the prices have moved to an extreme, based on recent price action.
Use VWAP
VWAP stands for volume weighted average price . It is an extremely useful indicator when trading intra-day. It does reset every trading session which is at 00:00 UTC . Instead of looking at x number of candles and providing an average price, it will take into consideration the volume that’s traded at a certain price and weigh it accordingly. It will NOT give entry signals but act as a filter. If the price is above VWAP will filter out the shorts and other way around for longs.
Use ADX
Average directional index is a powerful indicator when one is assessing the strength of a trend as well as measuring the volatility in the market. Unfortunately, the worst market condition for this strategy is sideways market. ADX becomes a useful tool since it can detect trend. If the volatility is low and there is no real price movement, ADX will pick that up and will not let you get in trades during a sideways market. It will allow you to enter trades only when the market is trending.
Use Super trend Filter
The indicator works well in a trending market but can give false signals when a market is trading in a range.
It uses the ATR ( average true range ) as part of its calculation which takes into account the volatility of the market. The ATR is adjusted using the multiplier setting which determines how sensitive the indicator is.
Use MA Filter
Lookback: It is an option to look back x number of candles to validate the price crossing. If the market is choppy and the price keeps crossing up and down the moving average you have chosen, it will generate a lot of “noisy” signals. This option allows you to confirm the cross by selecting how many candles the price needs to stay above or below the moving average. Setting it 0 will turn it off.
MA Filter Type: There is a selection of moving averages that is available on TradingView currently. You can choose from 14 different moving average types to detect the trend as accurate as possible.
Filter Length: You can select the length of your moving average. Most commonly used length being 50,100 and 200.
Filter Type: This is our propriety smoothing method in order to make the moving averages lag less and influence the way they are calculated slightly. Type 1 being the normal calculation and type 2 being the secret sauce .
Reverse MA Filter: This option allows you to use the moving average in reverse. For example, the strategy will go long when the price is above the moving average. However, if you use the reserve MA Filter, you will go short when the price is above the moving average. This method works best in sideways market where price usually retraces back to the moving average. So, in an anticipation of price reverting back to the moving average, it is a useful piece of option to use during sideway markets.
Use MACD Filter
MACD here will act as a filter rather than an entry signal generator. There are a few different ways to use this MACD filter. You can click on the Use MACD filter and it will use filter out the shorts generated in a bullish territory and longs generated in the bearish territory. It will greatly reduce the number of trades the strategy will trade because MACD is a lagging indicator. By the time MACD turns bullish or bearish , most of the other indicators will have already generated the signals. Therefore, resulting in less trades. You can use MACD filter as MA oscillator meaning that it will only look at the MA lines in MACD to filter out trades. Alternatively, you can use it with the histogram (Signal lines) meaning that it will only look at the histogram whether its below or above the zero line in order to filter out the trades.
TP (%)
Place your desired take profit percentage here. Default is 1.5%
Move SL At Entry x% Profit
This is when the strategy will move your SL to the entry point if the position reaches x% profit. It can also generate a signal which can be automated to adjust the SL on the exchange.
SL (%)
Place your desired stop loss percentage here. Default is 1%
The backtester assumes the following;
- 1000$ capital
- 0.06% commission based on binance
- 1% risk meaning 100% equity on cross leverage
- Backtest results are starting from 2020
If you want to get access to this indicator please DM me or visit our website.

RSPRO StrategyStrategy for RSPRO indicator
Based on resistance/support and bollinger band fluctuations this indicator also has filter with x bars after RSI overbought/oversell zones from settings.
There are two types of entries and signals: early (usually before trend changes) and main (when trend started to reverse)
Fits for BTC and any altcoins. And any assets. Good for both scalping and position trading (depends on timeframe that you use)
Best use it with big timeframes: 45 and 90min, 2 and 4 hours for position trading.
For scalping 5-30min timeframes are good too.
In Script settings you can specify:
1) RSI period, 14 by default.
2) Show early entries (squares), enabled by defaults.
3) Show main entries (triangles), enabled by defaults.
4) Enable/Disable filter to show main entries only after RSI overbought/oversell regions
Disabled by defaults and RSI is 67 for upper zone and 33 for lower zone.
You can also specify how many bars back before current bar this filter must do. It's 10 by default, you can vary it up to 90.
+With customisable start/end date, take profit and stop-loss.
This is invite only script. PM me if you want to test it.
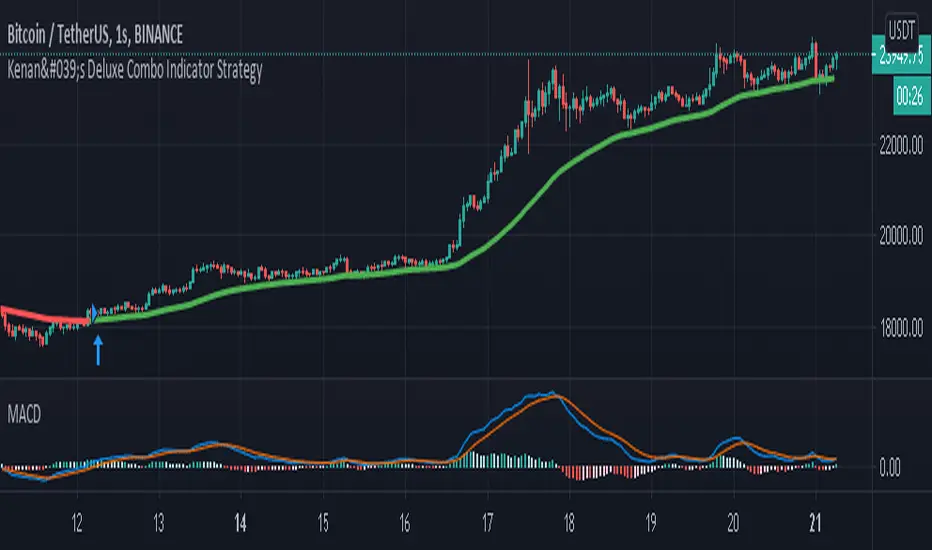
Kenan's Deluxe Combo Indicator Scalper Version StrategyThis is a combo strategy of sorts. I've been able to come up with this strategy after a lot of research.
Under Normal circumstances, when people look at dozens of indicators and they all signal, they open positions. So I decided to save people the trouble and put the major indicators together in a strategy.
All of the classic cross strategies usually give a lot of signal. Some of these signals are unnecessary and incorrect signals. Combining leading indicators. I tried to avoid the faulty signals.
Indicators and oscillators included in this strategy are:
1. Ema 5/13/21
2. Macd
3. Macd Dema
4. Ichimoku
5. Dmi
6. Stochastic
7. Aroon
8. Bollinger Band
9. Rsi
10. Chande Momentum Oscillator
11. Exponential Ease of Movement ( Eom )
12. Klinger Oscillator
13. Stochastic RSI
14. Ultimate Oscillator
15. Woodies CCI
16. Rate Of Change Lenght( Roc ) oscillator
17. WaveTrend Oscillator . It was created by @fskrypt.
18. Ehlers Adaptive CG Indicator . It was created by @LazyBear
19. Insync Index. It was created by @LazyBear
This script works by listening to the indicators and oscillators above. Opens new position after receiving signal verification signal from all
So how does this strategy close your position (optional).
1. You can close the position with the trailing stop option.
2. You can close the position according to the Rsi limits. To give an example. After a long position is opened, you can close the position after the rsi has risen above 70.
3. You can close the position according to the Bollinger Band . After a position is opened, you can close the position after the price moves out of the bollinger Band .
You can also change the values of indicators as desired. If you get better results. I would appreciate it if you could contact me via comment or private message.
I set the commission rate at 0.075 percent. If you want, you can change the settings yourself and make backtest.I changed the default settings for some indicators.

Kenan's Deluxe Combo Indicator StrategyThis is a combo strategy of sorts. I've been able to come up with this strategy after a lot of research.
Under Normal circumstances, when people look at dozens of indicators and they all signal, they open positions. So I decided to save people the trouble and put the major indicators together in a strategy.
All of the classic cross strategies usually give a lot of signal. Some of these signals are unnecessary and incorrect signals. Combining leading indicators. I tried to avoid the faulty signals.
Indicators and oscillators included in this strategy are:
1. Ema 5/13/21
2. Macd
3. Macd Dema
4. Ichimoku
5. Dmi
6. Stochastic
7. Aroon
8. Bollinger Band
9. Rsi
10. Chande Momentum Oscillator
11. Exponential Ease of Movement ( Eom )
12. Klinger Oscillator
13. Stochastic RSI
14. Ultimate Oscillator
15. Woodies CCI
16. Rate Of Change Lenght( Roc ) oscillator
17. WaveTrend Oscillator . It was created by @fskrypt.
18. Ehlers Adaptive CG Indicator . It was created by @LazyBear
19. Insync Index. It was created by @LazyBear
This script works by listening to the indicators and oscillators above. Opens new position after receiving signal verification signal from all
So how does this strategy close your position (optional).
1. You can close the position with the trailing stop option.
2. You can close the position according to the Rsi limits. To give an example. After a long position is opened, you can close the position after the rsi has risen above 70.
3. You can close the position according to the Bollinger Band . After a position is opened, you can close the position after the price moves out of the bollinger Band .
You can also change the values of indicators as desired. If you get better results. I would appreciate it if you could contact me via comment or private message.
I set the commission rate at 0.075 percent. If you want, you can change the settings yourself and make backtest.I changed the default settings for some indicators.
Crypto Trend Following StrategyThis is the strategy script indicator of Crypto Trend Following Strategy which can be used for back testing. With study script indicator, strategy can be easily automated.
To set alerts, see Crypto Trend Following Study indicator.
Script is using several moving averages to keep you on the right side of the trend. Signals are also filtered based on other indicators to prevent buying already overbought or selling already oversold coins and avoid ranging markets.
MAIN GOAL
Main goal of the strategy is long-term stable profit. No strategy has 100% accuracy therefore there always will be some false signals. But patience pays, with Trend Following Strategy, you will get couple of small loses while waiting to get big wins when coin is trending strongly. As you never know the right time you must sustain and be in all trades to make sure that you will not miss the big move.
BACKTEST
This script is for free to play with so you can back test and see for yourself how the strategy performs on any of your favourite coins.
Strategy is optimized and back tested for USDT and BTC pairs on 6h timeframe but it can be used on any pair and any timeframe.
RISK & REWARD
Strategy does not use safety orders as DCAs usually leads to bag holding sooner or later. It does not use take profit either as strategy will tell you when to buy and when to sell based on the actual market condition.
You should always use stop loss to protect your account from drawdown or even being liquidated.
You can change stop loss or take profit as you like or even back test the strategy with your preferred settings to find what suits you best.
STRATEGY SETTINGS
You can use the strategy script for fine tuning and find best settings for yourself.
If you need any help with settings do not hesitate to ask. I would also appreciate any feedback and ideas how to improve the script.
==== Indicators settings ====
RSI Long < and StochRSI Long <
• used to filter out buy signals of already overbought coins - ( stoch ) RSI must be under set value to fire a BUY signal
RSI Short > and StochRSI Short >
• used to filter out sell signals of already oversold coins - ( stoch ) RSI must be over set value to fire a SELL signal
ADX >
• used to filter out buy or sell signals in ranging markets - ADX must be over set value to fire a BUY or SELL signal
MA Fast and Slow Length
• Two moving averages to indicate an actual short-term trend
Baseline Length & Type
• Baseline is a moving average which confirms the longer-term trend. You can set length and type of the moving average
==== Test period settings ====
• You can set the back tested window
==== Strategy settings =====
• Target Take profit and Stop loss in %
• Only LONG trades – tick if you do not want to calculate SHORT trades in the back test
• Plot key levels on chart – if you use stop loss and/or take profit, you can turn on levels of price to reach (yellow – bought price, red – stop loss – green - take profit)
Back test calculates with commission and fixed order size. You can change these settings on Properties Tab

Relative Strength Index - 200 EMA CrossoversThis version of RSI uses (RSI, 200) as the signal and color codes the background as well as the RSI/200 line. For the same results as my post use a Length of 5 on RSI, as well as the "area with breaks" as a representation of RSI.
MACD_RSI strategyUse three indicator to entry a position
EMA (20), MACD (12, 26, 20), RSI (14)
apply ema20 on rsi as signal line
Entry long when
price above EMA20, MACD above signal line and RSI above signal line
Entry short when
price below EMA20, MACD below signal line and RSI below signal line
Study only, use it under your own risk.

Omni Trader Accompanying Backtesting StrategyVersion 1.0
Purpose
This backtesting strategy indicator is a accompanying tool for use with my popular trading and alert indicator: Omni Trader | RMI EMA RSI VOL | Margin Focused Indicator
Reference Indicator Link:
Features
This strategy has been programmed to act exactly how the accompanying indicator would be used with an automated strategy such as Autoview or through manual trading
Has identical coloured signals with correct icons for reference with the indicators standard alert conditions (LONG/SHORT)
The ability to toggle on or off all the logic and UI presets you could previously use to enhance the standard indicator
Fully customisable in the settings regarding trading strategy to match exactly how you have the reference indicator set up with alerts or how you are trading manually with it.
Ability to choose a timeframe, want to ignore the crypto boom at the latter stages of 2017? Sure you can, change the time frames in the settings to see a more recent representation of your trades.
Stop Loss & Take Profit enabled in this back tester for fine tuning of your strategy, especially useful for automated users to refine the most profitable settings for your style.
Access
This indicator is free for existing owners of my Omni Trader | RMI EMA RSI VOL | Margin Focused Indicator linked above as an accompanying tool to improve their strategy and net more profit. If you would like access to any of my indicators or would like to know more please find me on my community discord channel where you can find indicator details/documentation and general help:
Discord Link: discord.gg
Thank you for the immense support everyone, happy trading!
- Falco

PT2 Strategies Run Test Beta這是進行Profit Trailer 2環境的回測測試
Backtesting for PT2 (profit trailer 2) strategy Bate Version
目前支援策略
NORMAL BUY Strategy
HIGHBB,LOWBB,BBWIDTH,LOSE,EMAGAIN,EMASPREAD,EMACROSS,SMAGAIN,SMASPREAD,SMACROSS,MACD,RSI,STOCH,STOCHRSI,OVB
NORMAL SELL Strategy
GAIN,HIGHBB,BBWIDTH,EMAGAIN,EMASPREAD,EMACROSS,SMAGAIN,SMASPREAD,SMACROSS,MACD,RSI,STOCH,STOCHRSI,OVB
DCA BUY Strategy
ANDERSON,HIGHBB,LOWBB,BBWIDTH,LOSE,EMAGAIN,EMASPREAD,EMACROSS,SMAGAIN,SMASPREAD,SMACROSS,MACD,RSI,STOCH,STOCHRSI,OVB
DCA SELL Strategy
GAIN,HIGHBB,BBWIDTH,EMAGAIN,EMASPREAD,EMACROSS,SMAGAIN,SMASPREAD,SMACROSS,MACD,RSI,STOCH,STOCHRSI,OVB
感謝提供香油錢
ETH:
0x1997685628d149d1b679d20a21dcd06589c956f8
BTC:
12vuunzF3P9hcmEgNWgh1iF5SXXTpQVPaA
LTC:
LbVtnbRuGUw6YuE6UkoWshSQruWStUCMg8

Noro's Stochastic Strategy v1.3in 1.3:
+ profit became more
+ RSI Period
+ SMI+RSI Mode
+ Color filter
+ background
Uses:
1) Stochastic Momentum Index ("Use SMI-Strategy")
2) Fast RSI , period 2 ("Use RSI-Strategy")
3) SMA Body filter ("Use Body-filter")
4) Color filter ("Use Color-filter")

Fibonacci Vision ProFibonacci Precision Signals Pro | Smart Buy & Sell Alerts
━━━━━━━━━━━━━━━━━━━━━━━━━━━━━━━━━━━━━━━━━━━━━━━━━━━━
OVERVIEW
This indicator combines Fibonacci mathematics with advanced signal filtering to deliver precise buy and sell signals. It automatically detects swing structure, calculates the key 0.618 retracement level, and generates signals only when multiple confirmation factors align.
Clean. Accurate. Professional.
━━━━━━━━━━━━━━━━━━━━━━━━━━━━━━━━━━━━━━━━━━━━━━━━━━━━
HOW IT WORKS
The script identifies swing highs and lows, then calculates Fibonacci retracement levels automatically. When price interacts with the 0.618 zone and all filters confirm, a signal appears:
▲ buy — Long entry opportunity
▼ sell — Short entry opportunity
━━━━━━━━━━━━━━━━━━━━━━━━━━━━━━━━━━━━━━━━━━━━━━━━━━━━
6-LAYER CONFIRMATION SYSTEM
Every signal must pass through:
Trend Direction Analysis
Fibonacci Level Interaction
EMA Trend Filter (50-period default)
RSI Momentum Validation (14-period default)
Volume Spike Detection
Candlestick Pattern Recognition (Pin bars, Engulfing, Momentum candles)
This multi-layer approach significantly reduces false signals.
━━━━━━━━━━━━━━━━━━━━━━━━━━━━━━━━━━━━━━━━━━━━━━━━━━━━
BUILT-IN RISK MANAGEMENT
Every trade includes automatic stop loss and take profit levels:
Stop Loss: 100 pips
Take Profit: 200 pips
Risk-Reward Ratio: 1:2
Adjust these values in settings to match your trading style.
━━━━━━━━━━━━━━━━━━━━━━━━━━━━━━━━━━━━━━━━━━━━━━━━━━━━
KEY FEATURES
✅ Automatic Fibonacci calculation — no manual drawing
✅ Multi-timeframe compatibility — M15 to Daily
✅ Universal market support — Forex, Crypto, Stocks, Indices
✅ Clean minimalist signals — white triangles with text
✅ Customizable filters — adjust sensitivity to your preference
✅ Built-in alerts — never miss a signal
✅ No repainting — signals remain fixed once confirmed
━━━━━━━━━━━━━━━━━━━━━━━━━━━━━━━━━━━━━━━━━━━━━━━━━━━━
Swing Detection:
Swing Length — Controls sensitivity to market structure (default: 10)
Confirmation Bars — Bars required to confirm signal (default: 1)
Signal Filters:
EMA Trend Filter — Toggle trend confirmation on/off
EMA Length — Adjust trend filter period (default: 50)
RSI Filter — Toggle momentum confirmation on/off
RSI Length — Adjust momentum period (default: 14)
Volume Filter — Toggle volume confirmation on/off
Volume Multiplier — Set volume threshold (default: 1.2x average)
Risk Management:
Stop Loss Pips — Set your stop loss distance (default: 100)
Take Profit Pips — Set your profit target (default: 200)
Pip Value — Adjust for your instrument (0.0001 for most Forex, 0.01 for JPY pairs)
Visuals:
Show Signals — Toggle signal visibility
Show Cloud — Toggle Fibonacci zone visibility
━━━━━━━━━━━━━━━━━━━━━━━━━━━━━━━━━━━━━━━━━━━━━━━━━━━━
BEST PRACTICES
Use on H1 or H4 timeframes for optimal results
Trade in direction of the higher timeframe trend
Avoid trading during major news events
Combine with proper position sizing
Always use the built-in stop loss
Be patient — quality signals over quantity
━━━━━━━━━━━━━━━━━━━━━━━━━━━━━━━━━━━━━━━━━━━━━━━━━━━━
MARKETS SUPPORTED
Forex — All major, minor, and exotic pairs
Crypto — BTC, ETH, and altcoins
Stocks — Any equity on TradingView
Indices — S&P500, NASDAQ, DAX, FTSE, etc.
Commodities — Gold, Silver, Oil, etc.
━━━━━━━━━━━━━━━━━━━━━━━━━━━━━━━━━━━━━━━━━━━━━━━━━━━━
WHY FIBONACCI?
The 0.618 ratio (Golden Ratio) is observed by traders worldwide. When price retraces to this level, it often:
Reverses direction
Finds support or resistance
Creates high-probability entry opportunities
This script automates the detection of these key moments.
━━━━━━━━━━━━━━━━━━━━━━━━━━━━━━━━━━━━━━━━━━━━━━━━━━━━
ALERTS INCLUDED
Set up notifications to receive signals on:
Mobile push notifications
Desktop popups
Email alerts
Webhook integrations
Never miss a trading opportunity again.
━━━━━━━━━━━━━━━━━━━━━━━━━━━━━━━━━━━━━━━━━━━━━━━━━━━━
WHAT MAKES THIS DIFFERENT
Most indicators give too many signals. This one focuses on quality.
Most indicators clutter your chart. This one keeps it clean.
Most indicators ignore risk management. This one includes it.
Most indicators work on one market. This one works on all.
━━━━━━━━━━━━━━━━━━━━━━━━━━━━━━━━━━━━━━━━━━━━━━━━━━━━
DISCLAIMER
This indicator is a trading tool, not financial advice. Trading involves substantial risk of loss. Past performance does not guarantee future results. Always use proper risk management and never trade with money you cannot afford to lose. Test on a demo account before trading live.

VWolf - Raptor ClawOVERVIEW
The 'VWolf - Raptor Claw' is a straightforward scalping strategy designed for high-frequency trades based on the Stochastic RSI indicator. It focuses exclusively on identifying potential trend reversals through stochastic cross signals in extreme zones, without the need for additional confirmations. This makes it highly responsive to market movements, capturing rapid price shifts while maintaining simplicity.
This strategy is best suited for highly liquid and volatile markets like forex, indices, and major cryptocurrencies, where quick momentum shifts are common. It is ideal for experienced scalpers who prioritize fast entries and exits, but it can also be adapted for swing trading in lower timeframes.
Entry Conditions:
Long Entry:Stochastic RSI crosses above the oversold threshold (typically 20), indicating a potential bullish reversal.
Short Entry:Stochastic RSI crosses below the overbought threshold (typically 80), indicating a potential bearish reversal.
Exit Conditions:
Stop Loss: Set at the minimum (for longs) or maximum (for shorts) within a configurable lookback window to reduce risk.
Take Profit: Defined by a risk-reward ratio (RRR) input to optimize potential gains relative to risk.
CONCLUSION
The 'VWolf - Raptor Claw' strategy is perfect for traders seeking a simple yet aggressive approach to the markets. It capitalizes on sharp momentum shifts in extreme zones, relying on precise stop loss and take profit settings to capture rapid profits while minimizing risk. This approach is highly effective in high-volatility environments where quick decision-making is essential.
FOR MORE INFORMATION VISIT vwolftrading.com

Profitable Pair Correlation Divergence Scanner v6This strategy identifies divergence opportunities between two correlated assets using a combination of Z-Score spread analysis, trend confirmation, RSI & MACD momentum checks, correlation filters, and ATR-based stop-loss/take-profit management. It’s optimized for positive P&L and realistic trade execution.
Key Features:
Pair Divergence Detection:
Measures deviation between returns of two assets and identifies overbought/oversold spread conditions using Z-Score.
Trend Alignment:
Trades only in the direction of the primary asset’s trend using a fast EMA vs slow EMA filter.
Momentum Confirmation:
Confirms trades with RSI and MACD to reduce false signals.
Correlation Filter:
Ensures the pair is strongly correlated before taking trades, avoiding noisy signals.
Risk Management:
Dynamic ATR-based stop-loss and take-profit ensures proper reward-to-risk ratio.
Exit Conditions:
Automatically closes positions when Z-Score normalizes, or ATR-based exits are hit.
How It Works:
Calculate Returns:
Computes returns for both assets over the selected timeframe.
Z-Score Spread:
Calculates the spread between returns and normalizes it using moving average and standard deviation.
Trend Filter:
Only takes long trades if the fast EMA is above the slow EMA, and short trades if the fast EMA is below the slow EMA.
Momentum Confirmation:
Confirms trade direction with RSI (>50 for longs, <50 for shorts) and MACD alignment.
Correlation Check:
Ensures the pair’s recent correlation is strong enough to validate divergence signals.
Trade Execution:
Opens positions when Z-Score crosses thresholds and all conditions align. Positions close when Z-Score normalizes or ATR-based SL/TP is hit.
Plot Explanation:
Z-Score: Blue line shows divergence magnitude.
Entry Levels: Red/Green lines mark long/short thresholds.
Exit Zone: Gray lines show normalization zone.
EMA Trend Lines: Purple (fast), Orange (slow) for trend alignment.
Correlation: Teal overlay shows current correlation strength.
Usage Tips:
Use highly correlated pairs for best results (e.g., EURUSD/GBPUSD).
Run on higher timeframe charts (1h or 4h) to reduce noise.
Adjust ATR multiplier based on volatility to avoid premature stops.
Combine with alerts for automated notifications or webhook execution.
Conclusion:
The Profitable Pair Correlation Divergence Scanner v6 is designed for traders who want systematic, low-risk, positive P&L trading opportunities with minimal manual monitoring. By combining trend alignment, momentum confirmation, correlation filters, and dynamic exits, it reduces false signals and improves execution reliability.
Run it on TradingView and watch how it captures divergence opportunities while maintaining positive P&L across trades.

The Flody SniperA trend-following sniper strategy that uses two EMAs (21/55) and RSI to confirm momentum.
It enters long when price crosses above the fast EMA during an uptrend and RSI shows strength.
It enters short when price crosses below the fast EMA during a downtrend and RSI shows weakness.
Pyramiding is enabled so the strategy can add more positions as the trend continues.
Positions close when momentum weakens or price breaks back through the fast EMA.
