RSI MFI with alertsModified from the various scripts I've found on TradingView. This scripts adds alerts for oversold overbought conditions. It also has the ability to add in another RSI at a different time interval.
I've also added an MFI with bollinger bands to the chart to preceed the RSI. This can sometimes tell you the direction the RSI is moving. usually when it is out of the bollinger bands on the MFI the price/RSI tends to slow.
Cari dalam skrip untuk "rsi"

Doble RSI Suavizado con MARSI suavizado de 14 sesiones, con aplicación de una media móvil sobre RSI de 52 sesiones. Ayuda a marcar os cambios de tendencia al momento que el RSI cruza la MA.
RSI & Stochastic RSIRSI and Stochastic RSI Same Chart
Turn on StochRSI crossover signals
Customizable values

RSI and Stoch RSI Midline Crossover ArrowsPuts arrows on chart when RSI crosses over 52 and also when Stoch RSI crosses up 52 based on Warsnop strategy.


RSI CaveGives the same info as a conventional RSI oscillator except it's shown as a scary cave that price is trying to avoid touching. An indicator for the more visual traders out there. With thanks to LazyBear for the RSI band code.
I've included an RSI in the chart above for demonstration purposes.

RSI Candles (with wicks)The script adds wicks to the RSI candle indicator.
It is based on the RSI candle indicator by cI8DH.
Note that the definition of these wicks is not unique.
The implementation uses an RSI calculated from the highs and lows for the wicks.

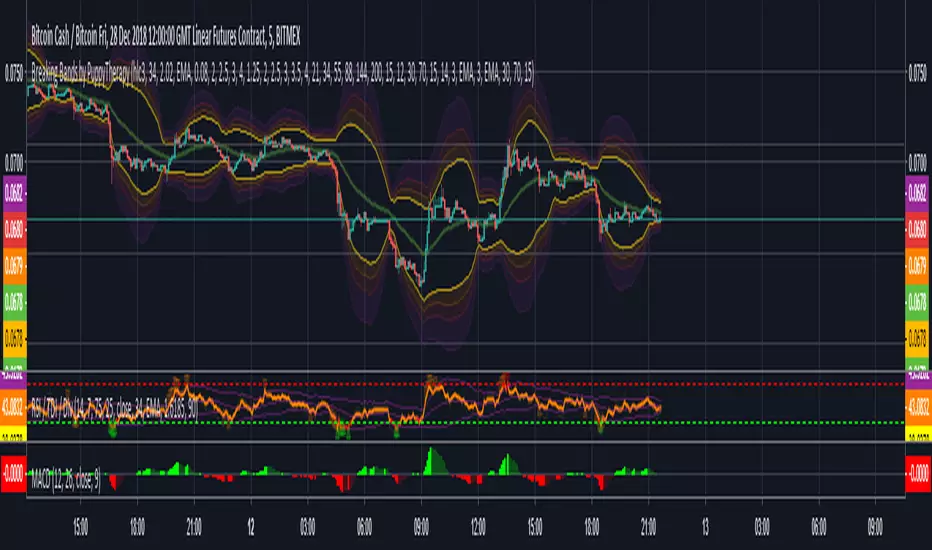
RSI - Div - TDIBasic RSI with BBs length 34
Ability to show divergences inspired by
Added Sharkfins - when rsi moves sharply out of BBs and below / above 75 / 25 RSI
RSI Divergences - Candle Edition - LibertusHello all,
This is just upgrade upon my already released RSI divergences script. Divergences detection is exactly same, no difference.
I'm releasing this version because I got few requests for divergences indicator above price bars, so it doesn't take additional screen space.
New in this version is:
ability to remove pivots
ability to display smaller/shorter labels
predefined look back period for different time frames
Happy trading and good luck!
As always, I appreciate comments and likes!
If you find this useful and want to reward me:
BTC TIP JAR: 1i7nojAjxFuyFwvnZx6hbXBTLkWaUjZ8C
RSI Divergences with RSI in separate window:

RSI Divergence AlertRSI Divergence Alert
Input: range
Bullish RSI Divergence
yellow
Bearish RSI Divergence
red

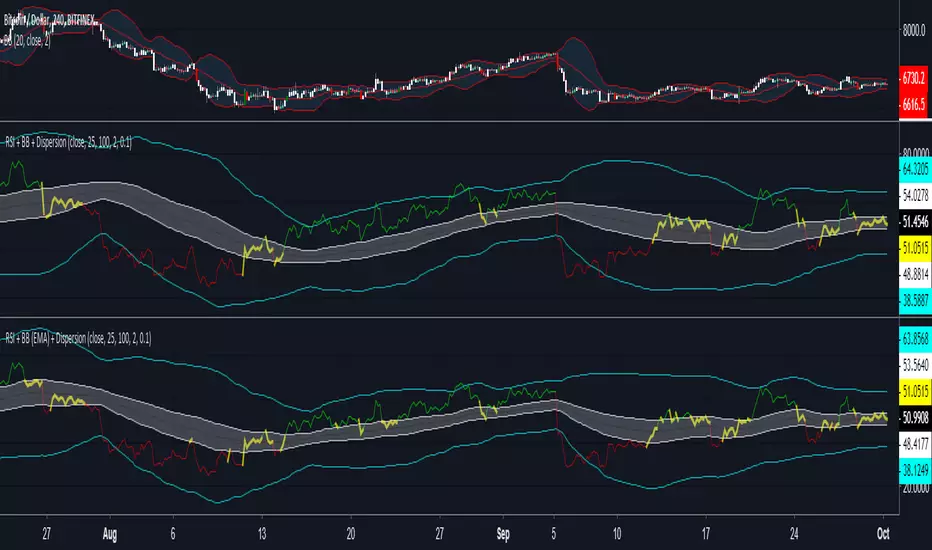
RSI + BB (EMA) + DispersionInitial data:
1) RSI
2) Bollinger Bands (Basis - EMA)
3) Dispersion (around basis)
Signal for purchase: RSI crosses the dispersion zone upwards
Signal for sale: RSI crosses the dispersion zone downwards
Buffer zone: white area, it is not recommended to make transactions.

RSI/Stoch/SRSI MTF COMBOThis combo-indicator is based on @ChrisMoody 's RSI and Stoch MTF original scripts.
It gives traders the possibility to overlay RSI, Stochastic and SRSI as well as to see how each element is behaving on a higher/lower TF.
RSI, Stoch and SRSI can be individually configured as well as turned on/off by the user.
Overbought/Oversold and Middle lines are available but only the formers can be configured by the user - Middle Line is fixed at 50.
This indicator is open source and free to use. Feel free to change it around to suit your needs.
***If you copy & paste the script, please remember to credit Chris Moody for his amazing work.***
Happy trading!

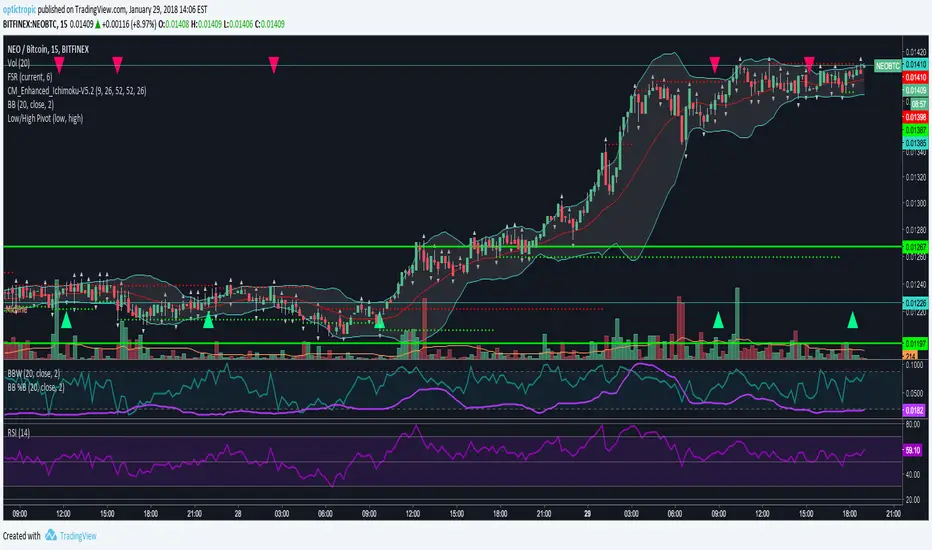
RSI or MFI %BPlots where RSI or MFI is inside its Bollinger Bands. Various strategies: good to see the trend (above/below average), overbought/oversold conditions (you could work a strategy around RSI getting out of overbought/oversold conditions as shown in the screenshot), divergences, etc...
I will also publish a Bollinger Bands width of RSI to identify areas of squeeze in volatility
Enjoy!

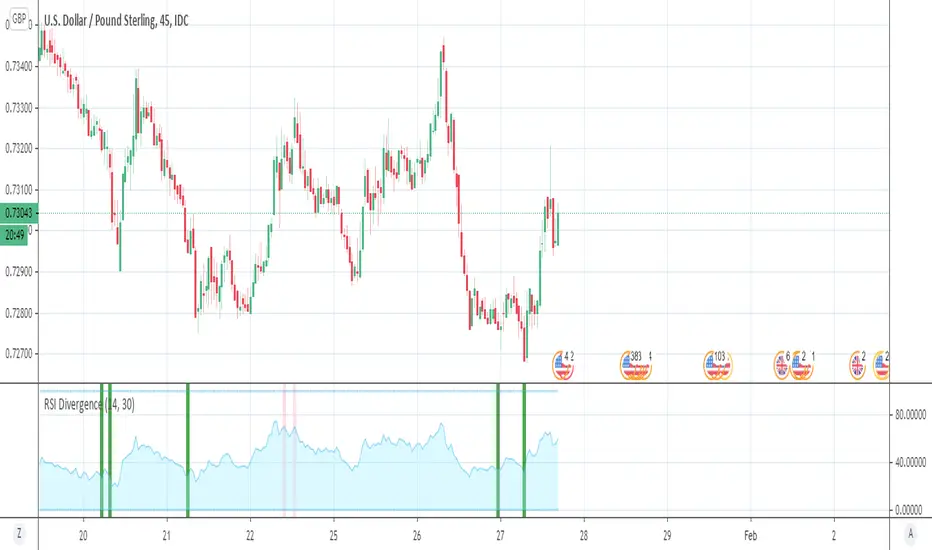
RSI DivergenceSimple RSI Divergence with adjustable lookback period.
Highlights bars with higher price but lower RSI (bearish) or lower price but higher RSI (bullish) than the highest/lowest points in the lookback period.

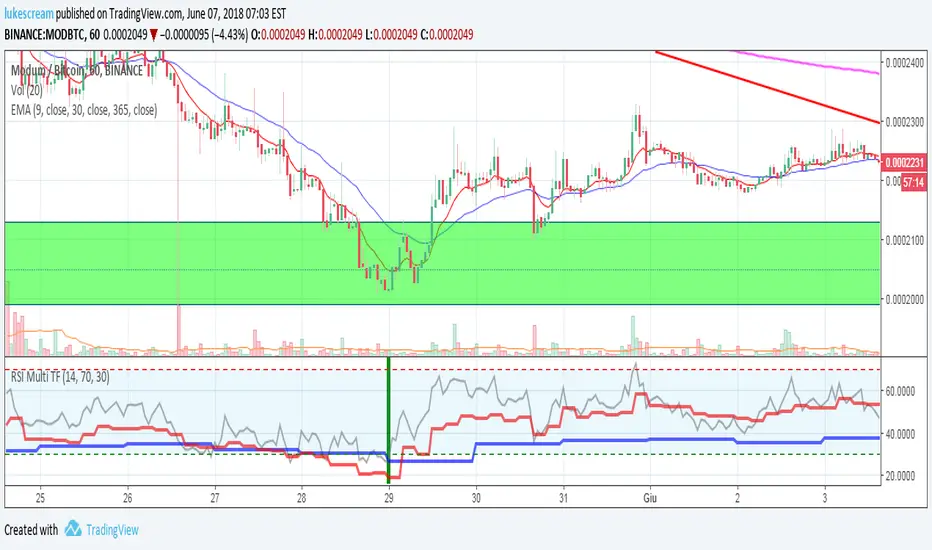
RSI Multi Time Frame - Spot Panic Sell Moments and profit!Union of three RSI indicators: 1h, 4h and daily. In order to show 1h RSI, you have to set it as active time frame on the chart.
Purpose: spot "triple oversold" moments, where all the three RSI are under the threshold, which is 30 by default but editable.
Target Market: Cryptocurrencies. Didn't try it on other ones, may work as well. Fits Crypto well as, by experience, I can tell it usually doesn't stay oversold for long.
When the market panics and triple oversold occurs, the spot is highlighted by a green vertical bar on the indicator.
The indicator highlights triple overbought conditions as well (usually indicating strong FOMO), but I usually don't use it as a signal.
I suggest to edit the oversold threshold in order to make it fit the coin you're studying, minimizing false positives.
Special thanks to Heavy91, a Discord user, for inspiring me in this indicator.
Any editing proposal is welcome!
I reposted this script, as the first time I wrote it in Italian. Sorry for that.
RSI-MTF-Histo-EntryThis indicator gives a histogram of RSI in relation to an ema of the RSI.
The histogram is then smoothed to reduce false signals.
The actualiteit RSI line with overbought/overvols signals can be added or omitted as preferred.
The background can be color coded if the RSI is above or below 50.
Version 2. Added support for MTF. Longer timesframes (1h-3h) tend to give better entry results.
As an example the indicator was added two times, one for the current timeframe and one for a longer timeframe.

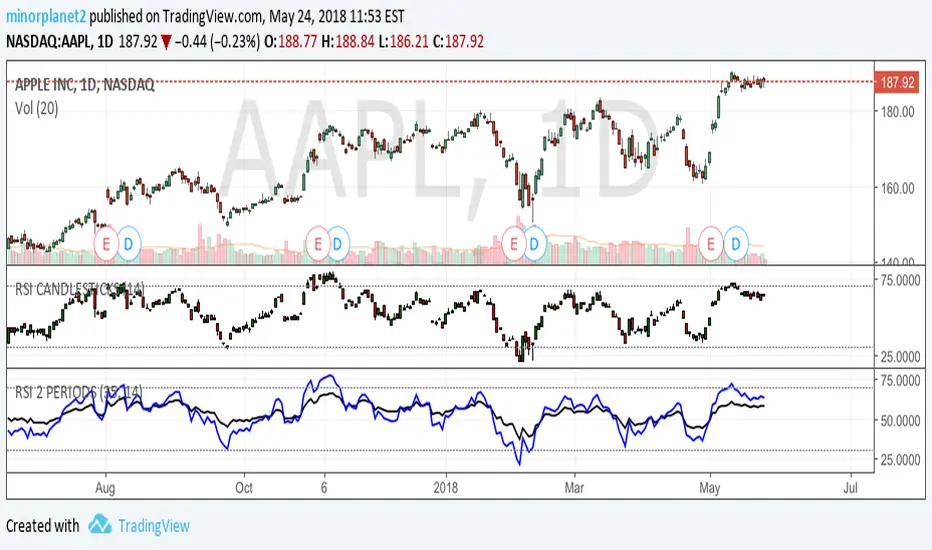
RSI 2 PERIODSPlots RSI of 2 different periods. Crossover of faster RSI with slower RSI suggests bullish outlook. Crossunders imply bearish outlook. Let me know what you think.
RSI Plus (RSI+)Same RSI you love, but with a candle highlighter, control over Overbought & Oversold Line placement, and Alert Conditions for Overbought & Oversold, built right in.
Set the Overbought/Oversold Lines anywhere you want... use them to create RSI+ Alerts.

RSI / Stoch / Stoch RSI (SRSI) Overlay [SigmaDraconis]Combines RSI, Stochastic and Stochastic RSI (SRSI) in only one indicator.
Most useful to better pick tops and bottoms on oversold and overbought levels.
I decided to write it since I felt the need to look at how all 3 behaved at once, relative to each.
If you like it, here are my tip jars:
BTC: 1CfBVcxmrx7Uxw3SYJWVGKZsEK698fwXP9
LTC: LXXt76wWTksLcM5qbbiAxfP1o8SoxwzDH2
BTS: sigma-draconis

RSI with midlineHere's a standard RSI with a few horizontal lines included for convenience. (Above chart unrelated.)
I was inspired to make this script after watching CryptoCred's wonderful resource on the RSI, here (youtube) .
A few preset alert-templates are included, namely when the RSI touches a level of import (midline, overbought/sold, and even more overbought/sold, because crypto gonna crypto).