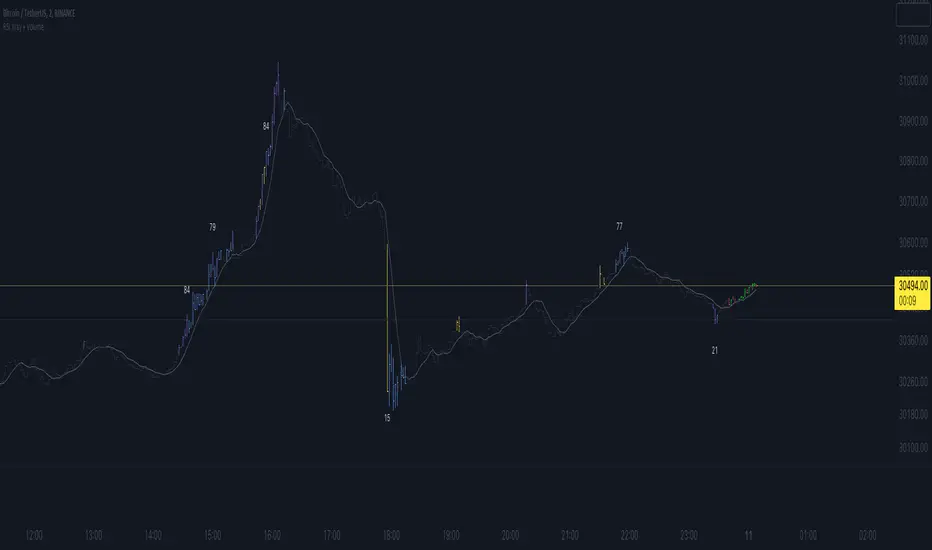
RSI Trend Detector PSAR BasedRSI Trend Detector is based on the Direction of PSAR. This indicator helps the easy detection of Trend Direction and Sideways Movement of Price. It was difficult to determine the RSI Trend Direction in a basic RSI indicator. one cannot decide the exact entry point where to enter.
RSI Trend Detector helps with the direction of trend using PSAR direction which is almost instant direction changing indicator with Zero Lag. The color of the RSI changes immediately based on PSAR direction. One can determine the trend whether its in UP / Down or Sideways.
One can easily detect Pullback and entry points using this indicator.
The basic working can be interpreted with a normal default RSI, The only additional feature is the direction of trend using a SAR signal.
Oversold Zone is below 30
Overbought Zone is above 70
how ever RSI above 50 is treated a UP trend and Below 50 as Down Trend.
when RSI is between 40 and 60 price must be considered as Sideways. One can easily interpret the TREND.
Yellow Line = RSI Moving Average
RED and Green Line= RSI
Grey Zone = Sideways
Horizontal line = RSI level 50
Settings can be changed as required.
RSI Line:
RSI Above 50 up trend and Entry when color is green
RSI Below 50 down trend and Entry when color is Red
RSI in Grey Zone is sideways, wait for a breakout
RSI above 50 and color is red then its a pullback in uptrend
RSI below 50 and color is green then its a pullback in downtrend
ALERTS:
Up signal and Down Signal are provided when ever RSI crosses RSIMA
Up Signal: RSI crosses RSI Moving Average upwards
Down Signal: RSI crosses RSI Moving Average Downwards
Hope the Tradingview community likes this.
Cari dalam skrip untuk "rsi"

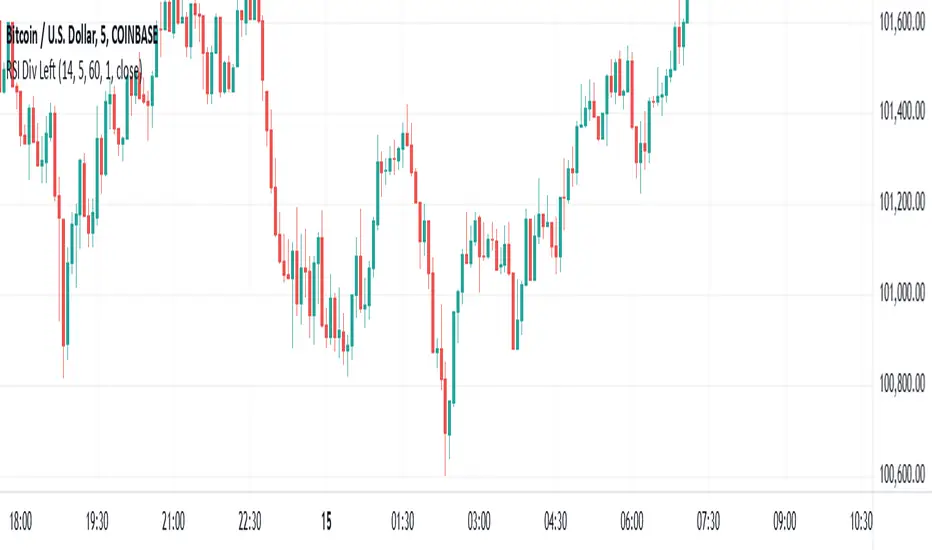
RSI Xray + VolumeRSI Analysis:
The indicator calculates the Relative Strength Index (RSI) using a user-defined length (default: 14).
It colors the bars based on RSI levels to identify potential overbought and oversold conditions.
Bars exceeding the overbought level (default: 70) are colored, while bars below the oversold level (default: 30) are colored too.
This helps traders identify potential trend reversals or market exhaustion points.
Midpoint Analysis:
The indicator calculates the midpoint of each bar, which is the average of the high and low prices.
It colors the bars based on their relation to the midpoint.
Bars above the midpoint are colored, indicating potential bullish momentum.
Bars below the midpoint are colored, suggesting potential bearish momentum.
Volume Analysis:
The indicator offers the ability to analyze volume changes and identify high volume bars.
It colors the bars when the volume exceeds a user-defined threshold.
This feature helps traders identify potential areas of market interest and increased participation.
Moving Average (SMA):
The indicator plots a Simple Moving Average (SMA) line of the closing price over a user-defined period (default: 9).
This moving average line helps traders identify potential trends and spot areas of support or resistance.
RSI Extreme Conditions:
The indicator identifies extreme RSI conditions by comparing the current RSI value with the highest and lowest RSI values calculated from a user-defined number of previous bars (default: 10).
When the RSI exceeds the overbought level but is lower than the highest RSI value within the specified range, the bar color changes to a customizable color (default: blue).
Conversely, when the RSI falls below the oversold level but is higher than the lowest RSI value within the specified range, the bar color changes to the same customizable color.
This feature helps traders identify potential RSI-based trading opportunities and market turning points.
Customization:
The indicator offers customizable settings for colors, RSI levels, SMA length, volume thresholds, RSI extreme levels, and RSI label color.
Traders can modify these settings based on their preferences and trading strategies.
Overall, the 'RSI Xray + Volume' indicator provides a comprehensive view of RSI levels, market momentum, volume changes, and RSI extreme conditions. Traders can use this information to identify potential trade setups, validate market trends, and make more informed trading decisions. It can be applied to various timeframes and instruments, making it a valuable tool for both short-term and long-term traders.
KINSKI Multi RSI DivergenceThis extremely useful indicator combines several RSI variants (can be displayed simultaneously or alone) with many setting options. The RSI variants can also be displayed as an extra histogram, which provides additional valuable information. Furthermore, it is possible to set smoothing types, volume and stochastic based calculations for each variant.
Relative Strength Index (RSI)
The Relative Strength Index ( RSI ) is a momentum indicator that measures the extent of recent price changes to analyse overbought or oversold conditions. RSI values range from 0 to 100. In general, RSI divergence means that the RSI indicator is moving in the opposite direction compared to the price. So while the price is moving, the RSI is telling us in advance that we can expect a change in direction.
RSX Indicator
The RSX is the noise-free version of the more familiar RSI oscillator. Normally, any indicator can be smoothed by applying a moving average. However, a major disadvantage of such a method is that there is a time lag between the indicator and the price. The RSX indicator tries to do this without signal delay.
Money Flow Indicator (MFI)
The MFI is essentially the RSI with the added aspect of volume . Because of its close similarity to the RSI , the MFI can be used in very similar ways.
RSI Laguerre
The RSI Laguerre works in the same way as the classic RSI , but is more sensitive to recent prices. When it crosses the signal line at the value of 0.15 from the bottom to the top, a buy signal is created, while overbought markets have values of 0.75 or higher
Detection of divergences
The detection of divergences in the RSI is one of the most important functions of this indicator. The reason is that an divergence is a more reliable signal than the overbought and oversold indicators themselves. You get overbought and oversold signals all the time. However, the divergence is a rare event.
In general, divergence means that the RSI indicator is moving in the opposite direction compared to the price. So while the price is moving, the RSI is telling us in advance that we can expect a change in direction.
Positive divergence
A positive divergence is when the price trend has lower lows and lower highs, while the indicator does the opposite - higher highs and higher lows. The price continues to fall while the RSI indicator begins to rise.
Negative divergence
Negative divergence is the opposite of positive divergence. It applies to uptrends where the price reaches higher highs and higher lows. However, the RSI shows lower highs and lower lows - the price goes up but the RSI goes down. The price closes with higher highs and higher lows, while the indicator shows the opposite - lower lows and lower highs, confirming a negative divergence. As a result, there is a sharp decline in the price.
Have fun using and trying out this flexible indicator!

RSI SFP + flexi TP/SL + WT JSON bot RSI SFP + Smart TP/SL + Auto-Trading JSON for WunderTrading
Precision reversal detection for fully automated long/short execution
RSI SFP is a next-generation reversal detection engine combining market structure (Swing Failure Pattern) with RSI divergence confirmation.
It is designed for professional users who require fast, non-repainting, and broker-integrated signals that can be used for automation.
This Invite-Only script offers:
🔷 Core Features
✔ Real-time SFP detection (no candle close required)
The algorithm triggers as soon as price touches previous swing high/low and RSI forms a confirmed divergence.
Ideal for users who want the earliest, most reactive entries.
✔ RSI Divergence Engine
Bullish RSI divergence at prior lows
Bearish RSI divergence at prior highs
Adjustable divergence threshold (RSI difference)
Ultra-low latency decision logic
✔ Smart TP/SL Automation
TP = ±1% fixed profit from entry (configurable)
SL based on swing structure or user-defined %
TP/SL displayed visually on the chart
No repainting once triggered
✔ Full Backtesting Module
Tracks wins/losses across last N trades
Displays monthly statistics (last 4 months)
Tracks estimated P&L using user leverage model
Built-in visual tags for every TP / SL hit
✔ Integrated Auto-Trading for WunderTrading
When enabled, the indicator automatically sends structured JSON signals through TradingView alerts.
Supported actions:
Enter Long
Enter Short
Exit All
Each entry includes:
Market order
Position size based on capital & leverage
Exchange-level TP & SL placement
Your bot on WunderTrading can mirror the exact chart signals in real time.
🔷 Use Cases
Full automation using TradingView → Webhook → WunderTrading
Intraday reversal trading
Swing trading
Multi-exchange automated bot execution
Reversal scalping with tight stops
🔷 Important Notes
This indicator does not repaint after signal confirmation.
Real-time signals may flash while the candle is forming (normal for non-close divergence detection).
Only Invite-Only users can access the script.
No source code is shared.
If you want access, please message me directly on TradingView.
A full setup guide, alerts template, and WT bot configuration are included for subscribers.
🇨🇳 中文版(专业销售版)
RSI SFP + 智能 TP/SL + WunderTrading 自动交易 JSON 引擎
专为自动化反转交易打造的实时 SFP + RSI 背离策略
RSI SFP 指标将 Swing Failure Pattern(SFP 假突破结构)与 RSI 背离进行整合,
用于捕捉极早期的反转机会。
本脚本专为需要 实时、无重绘、可自动化执行 的专业交易者设计。
这是一个 Invite-Only(仅邀请)脚本,专供订阅用户授权使用。
🔷 核心功能
✔ 实时信号(不需要 K 线收盘)
只要价格触及前高/前低 + RSI 背离确认,
立即给出 Long / Short 反转信号,属于极短延迟结构逻辑。
✔ 高级 RSI 背离系统
价格 vs RSI 顶背离
价格 vs RSI 底背离
最小 RSI 差值可调
精准且稳定,不重绘
✔ 智能 TP / SL 自动管理
固定 TP = ±1%(可调)
SL 支持 swing 结构或固定百分比
图表上自动绘制 TP/SL 虚线
信号一旦触发后不重绘
✔ 强大回测统计系统
可追踪最近 N 笔交易
最近 4 个月的月度统计
盈亏汇总表(含杠杆模型)
每次 TP/SL 都自动标注在图表上
✔ 内置 WunderTrading 自动化 JSON
启用后,指标会自动通过 TradingView Alerts → Webhook
向 WT 机器人发送标准化 JSON:
开多(Enter Long)
开空(Enter Short)
全部平仓(Exit All)
并自动包含:
市价下单
杠杆
手数
TP/SL 自动挂单
完全同步图表上的信号。
🔷 适用人群
想要全自动交易(TV → WT → 交易所)
反转交易 / SFP 策略
日内 / 轻量级高频反转
Swing 反转捕捉
需要稳定 TP/SL 的量化用户
🔷 注意事项
信号不会在收盘后重绘,但在 K 线形成中可能闪烁(实时逻辑正常现象)
脚本为 Invite-Only 私密指标,源码不会公开
订阅用户可随时获得使用授权
提供详细 WT 机器人设置教程
如需访问权限,请通过 TradingView 私信联系我。
订阅用户将获得完整的使用指南与设置模板。

RSI Divergence Pro | Instant & Confirmed RSI Divergence Pro 是一个专为实盘交易打造的专业级背离系统,它的设计目标很明确:更快、更准、更稳定。在长期交易美股、A 股与加密货币的过程中,我发现市面上大多数背离指标都有明显缺陷:传统背离确认太慢,动不动延迟 3~8 根 K;快速背离虽然及时,但基本都重绘,复盘好看、实盘没法用;复杂的背离工具则逻辑混乱,视觉杂乱,很难在实盘中形成稳定的执行体系。因此,我希望创建一个真正能反映市场动能变化、适用于实盘、且结构清晰的背离系统。最终形成了 RSI Divergence Pro:即时背离(预测模型)与确认背离(零重绘)双引擎架构。
这个指标由两个核心引擎构成。第一个是即时背离,它基于 RSI 的二阶动能变化来捕捉拐点,无需等待枢轴成型,因此信号非常提前。它能在 K 线创新低但 RSI 不再同步时提醒你,也能在市场动能逐渐衰竭的早期阶段发出信号。即时背离以虚线呈现,可能重绘,但这种“重绘本质上是预判”,可以让你比传统背离提前 1~5 根 K 观察到趋势反转的可能性。第二个是确认背离,它采用“左宽右窄”的不对称枢轴结构:左端保持足够的结构宽度,确保信号含金量;右端使用极窄宽度,让确认信号比传统枢轴快很多。同时确认背离完全不重绘,非常适合实盘与策略回测,所有信号都以实线表现,稳定可靠。
除了核心结构,RSI Divergence Pro 提供了清晰直观的视觉呈现:背离连线、可选文字标签、右端短尾增强设计,使得信号的方向性更明确。它支持所有周期,从 1 分钟到周线都可以使用,同时包含四种提醒触发(即时多、即时空、确认多、确认空),适合自动化或半自动化交易体系。它的逻辑充分考虑了实际交易中“反应速度”与“信号可靠性”的平衡,因此尤其适用于短线交易者、波段交易者、结构分析者以及基于 RSI 建模的量化策略用户。
它带来的价值并不仅仅是“画背离线”,而是在帮助交易者理解市场深层的动能变化。无论是避免追高杀跌、确认趋势衰竭、识别顶部底部结构,还是减少情绪化操作——背离在交易系统中扮演的是风险过滤器和反转预警器的角色。即时背离让你看到别人看不到的早期信号,而确认背离为执行提供可靠依据,从而形成一个可复制、可执行的交易框架。
需要强调的是,即时背离属于预测模型,会因为动能变化而重绘,这是正常的;确认背离则完全不重绘,可以放心用于实盘与回测。背离是信号,不是指令,需结合趋势与结构判断使用。
总结来说,RSI Divergence Pro 的核心价值在于“快、稳、清晰、专业”。它不是为了炫技,而是为了让你在市场结构变化的关键位置更早、更准地获得信息。如果你长期依赖 RSI 或动能分析,它会成为一个真正值得加入工具库的专业级指标。
RSI Divergence Pro is a professional-grade divergence system designed specifically for real trading. Its purpose is simple: to be faster, more accurate, and more stable than traditional divergence tools. After years of trading equities and crypto, I realized that most divergence indicators share the same major weaknesses: classic divergence signals come far too late, often 3–8 bars after the structure forms; fast divergence tools repaint heavily, making them unsuitable for live trading; and more complex indicators are visually cluttered and difficult to execute in real time. I wanted a tool that reveals momentum shifts clearly, works in live markets, and helps traders build a consistent execution framework. That led to the creation of RSI Divergence Pro, a dual-engine system that combines predictive divergence with fully confirmed, non-repainting divergence.
The first engine is Instant Divergence. It is built on RSI momentum inflection rather than pivot structures, allowing signals to appear far earlier. It detects moments when price makes a new low but RSI no longer follows, or when momentum begins to weaken before it becomes visually obvious. Instant signals are drawn with dashed lines and may repaint, because they are predictive by design. This enables early detection 1–5 bars ahead of traditional divergence tools, giving traders an informational edge in momentum reversal scenarios.
The second engine is Confirmed Divergence. It uses an asymmetric pivot model with a wider left side and a narrow right side. The left width preserves structural integrity, while the small right width accelerates signal confirmation, making it significantly faster than standard pivot divergence. All confirmed divergences are fully non-repainting and displayed with solid lines, making them ideal for both live trading and backtesting.
Beyond the core logic, RSI Divergence Pro includes clean and intuitive visual elements: divergence lines, optional labels, and mini stub extensions to highlight direction and momentum. It supports all timeframes—from 1-minute scalping to weekly swing analysis—and provides four types of alert conditions (instant bull, instant bear, confirmed bull, confirmed bear). It is especially suitable for scalpers, swing traders, structural traders, and quantitative traders who rely on RSI-based momentum modeling.
The true value of this tool is not simply drawing divergence lines. It helps traders understand deeper momentum shifts within market structure. It prevents chasing tops and bottoms, identifies trend exhaustion, provides context for reversals, and reduces emotional trading. Instant divergence shows what most traders cannot see, while confirmed divergence provides stable validation, forming a consistent and repeatable execution framework.
It is important to clarify that instant divergence repaints by design—this is part of its predictive nature. Confirmed divergence does not repaint at all and is safe for strategy testing. Divergence is a signal, not a command, and should be interpreted alongside market structure and trend context.
In summary, RSI Divergence Pro focuses on what matters: speed, stability, clarity, and professional-level reliability. It is not built to be flashy but to help traders receive actionable information at the exact moments when momentum and structure begin to shift. For traders who rely on RSI or momentum analysis, this indicator is a powerful addition to any serious trading toolkit.

RSI Divergence (Nikko)RSI Divergence by Nikko
🧠 RSI Divergence Detector — Nikko Edition This script is an enhanced RSI Divergence detector built with Pine Script v6, modified for better visuals and practical usability. It uses linear regression to detect bullish and bearish divergences between the RSI and price action — one of the most reliable early signals in technical analysis.
✅ Improvements from the Original:
- Clean divergence lines using regression fitting.
- Optional label display to reduce clutter (Display Labels toggle).
- Adjustable line thickness (Display Line Width).
- A subtle heatmap background to highlight RSI overbought/oversold zones.
- Uses max accuracy with high calc_bars_count and custom extrapolation window.
🔍 How It Works: The script applies linear regression (least squares method) on both RSI data, and Price (close) data.
It then compares the direction of RSI vs. direction of Price over a set length. If price is making higher highs while RSI makes lower highs, it's a bearish divergence. If price is making lower lows while RSI makes higher lows, it's a bullish divergence. Additional filters (e.g., momentum and slope thresholds) are used to validate only strong divergences.
🔧 Input Parameters: RSI Length: The RSI period (default: 14). RSI Divergence Length: The lookback period for regression (default: 25). Source: Which price data to calculate RSI from (default: close). Display Labels: Show/hide “Bullish” or “Bearish” labels on the chart. Display Line Width: Adjusts how thick the plotted divergence lines appear.
📣 Alerts: Alerts are built-in for both RSI Buy (bullish divergence) and RSI Sell (bearish divergence) so you can use it in automation or notifications.
🚀 Personal Note: I’ve been using this script daily in my own trading, which is why I took time to improve both the logic and visual clarity. If you want a divergence tool that doesn't clutter your chart but gives strong signals, this might be what you're looking for.

RSI Divergence - Left Candles Onlyrsi
The **RSI Divergence** indicator in this script is designed to highlight **divergence** between the **Relative Strength Index (RSI)** and **price action** on a chart. Divergence can be a key signal for potential trend reversals or continuation in technical analysis.
### **Key Components of the Indicator:**
1. **RSI Calculation:**
- The **Relative Strength Index (RSI)** is calculated using a typical 14-period length, but the user can customize this input.
- RSI is a momentum oscillator that measures the speed and change of price movements, oscillating between 0 and 100. Values above 70 indicate overbought conditions, and values below 30 indicate oversold conditions.
2. **Divergence Logic:**
- **Bullish Divergence:** Occurs when the price forms a **lower low**, but the RSI forms a **higher low**. This suggests that despite price continuing to drop, momentum (RSI) is strengthening, which may indicate a potential price reversal to the upside.
- **Bearish Divergence:** Occurs when the price forms a **higher high**, but the RSI forms a **lower high**. This indicates that even though price is rising, the momentum (RSI) is weakening, which could signal a price reversal to the downside.
3. **Pivot Identification:**
- The script identifies **pivot points** (local highs and lows) on both price and RSI.
- **Bullish Divergence:** A lower price low with a higher RSI low.
- **Bearish Divergence:** A higher price high with a lower RSI high.
4. **Lookback Periods:**
- **Lookback Left (lookbackLeft):** Defines the number of bars to look back for pivot confirmation. This allows for adjusting the sensitivity of the divergence.
- The **divergence range** is constrained by two parameters:
- **Minimum range (rangeLower):** The minimum number of bars for divergence to be considered.
- **Maximum range (rangeUpper):** The maximum number of bars for divergence to be considered.
5. **Signal Generation and Plotting:**
- When a **bullish divergence** is detected, a **green label** is plotted below the bar where the divergence occurs.
- When a **bearish divergence** is detected, a **red label** is plotted above the bar.
- The script uses **`plotshape()`** to plot these labels on the chart.
6. **Alerts:**
- Alerts are configured for both **bullish** and **bearish divergences** so that you can be notified when a divergence signal occurs.
---
### **How the Indicator Works:**
- The RSI and price action are compared using **pivots**: The script checks whether the price and RSI are forming new highs or lows within the specified **lookback period**.
- If the conditions for divergence (higher/lower RSI pivot vs price pivot) are met, a signal is plotted on the chart.
- The script helps to visually identify potential reversal points and allows users to set alerts for these divergence signals.
---
### **Use Case:**
- This script is useful for traders looking to trade potential trend reversals based on **divergence** between price and RSI.
- **Bullish divergence** can indicate a **buy** opportunity, while **bearish divergence** can suggest a **sell** opportunity.
- The indicator works best in **volatile markets** and when combined with other technical analysis tools for confirmatio
RSI Confirm Trend with Williams (W%R)RSI Confirm Trend with Williams (W%R)
This is the "RSI Confirm Trend with Williams (W%R)" indicator
This is a modification of the "RSI Trends" indicator by zzzcrypto123.
What Is the Relative Strength Index (RSI)?
The relative strength index (RSI) is a momentum indicator used in technical analysis. RSI measures the speed and magnitude of a security's recent price changes to evaluate overvalued or undervalued conditions in the price of that security.
What is Williams %R?
Williams %R, also known as the Williams Percent Range, is a type of momentum indicator that moves between 0 and -100 and measures overbought and oversold levels. The Williams %R may be used to find entry and exit points in the market. The indicator is very similar to the Stochastic oscillator and is used in the same way. It was developed by Larry Williams and it compares a stock’s closing price to the high-low range over a specific period, typically 14 days or periods.
How Does "RSI Confirm Trend with Williams (W%R)" work?
This indicator combines the momentum of both RSI and Williams %R by adding upper and lower thresholds. When the thresholds are broken, this indicator changes color from gray to either green or red.
What Are The Thresholds?
The default RSI thresholds are 55 and 45. These values are configurable.
The default Williams %R thresholds are 80 and 20. These values are configurable and made positive so it can be plotted against the RSI line.
How To Use?
When the RSI exceeded the upper/lower thresholds, the RSI line color will change from gray to lighter green/red color.
When the Williams %R exceeded the upper/lower thresholds, the RSI color will change to darker green/red color signifying a strong momentum in that direction.
When the RSI color is gray, this means the RSI and Williams %R thresholds are not broken which can also signify as no trend or consolidation.
The Williams %R line is not displayed by default but can be enabled using the checkbox provided in the Style tab.
This "RSI Confirm Trend with Williams (W%R)" indicator can be combined with other technical indicators to verify the idea behind this theory.
-----------------
Disclaimer
The information contained in this indicator does not constitute any financial advice or a solicitation to buy or sell any securities of any type.
My scripts/indicators/ideas are for educational purposes only!

Bollinger RSI BandsIndicator Description:
The "Bollinger RSI Bands" is an advanced technical analysis tool designed to empower traders with comprehensive insights into market trends, reversals, and overbought/oversold conditions. This multifaceted indicator combines the unique features of candle coloration and Bollinger Bands with the Relative Strength Index (RSI), making it an indispensable tool for traders seeking to optimize their trading strategies.
Purpose:
The primary purpose of the "Bollinger RSI Bands" indicator is to provide traders with a holistic view of market dynamics by offering the following key functionalities:
Candle Coloration: The indicator's signature candle colors - green for bullish and red for bearish - serve as a visual representation of the prevailing market trend, enabling traders to quickly identify and confirm market direction.
RSI-Based Moving Average: A smoothed RSI-based moving average is plotted, facilitating the detection of trend changes and potential reversal points with greater clarity.
RSI Bands: Upper and lower RSI bands, set at 70 and 30, respectively, help traders pinpoint overbought and oversold conditions, aiding in timely entry and exit decisions.
Bollinger Bands: In addition to RSI bands, Bollinger Bands are overlaid on the RSI-based moving average, offering insights into price volatility and highlighting potential breakout opportunities.
How to Use:
To maximize the utility of the "Bollinger RSI Bands" indicator, traders can follow these essential steps:
Candle Color Confirmation: Assess the color of the candles. Green candles signify a bullish trend, while red candles indicate a bearish trend, providing a clear and intuitive visual confirmation of market direction.
Overbought and Oversold Identification: Monitor price levels relative to the upper RSI band (70) for potential overbought signals and below the lower RSI band (30) for potential oversold signals, allowing for timely adjustments to trading positions.
Trend Reversal Recognition: Observe changes in the direction of the RSI-based moving average. A transition from bearish to bullish, or vice versa, can serve as a valuable signal for potential trend reversals.
Volatility and Breakout Opportunities: Keep a watchful eye on the Bollinger Bands. Expanding bands signify increased price volatility, often signaling forthcoming breakout opportunities.
Why Use It:
The "Bollinger RSI Bands" indicator offers traders several compelling reasons to incorporate it into their trading strategies:
Clear Trend Confirmation: The indicator's distinct candle colors provide traders with immediate confirmation of the current trend direction, simplifying trend-following strategies.
Precise Entry and Exit Points: By identifying overbought and oversold conditions, traders can make more precise entries and exits, optimizing their risk-reward ratios.
Timely Trend Reversal Signals: Recognizing shifts in the RSI-based moving average direction allows traders to anticipate potential trend reversals and adapt their strategies accordingly.
Volatility Insights: Bollinger Bands offer valuable insights into price volatility, aiding in the identification of potential breakout opportunities.
User-Friendly and Versatile: Despite its advanced features, the indicator remains user-friendly and versatile, catering to traders of all experience levels.
In summary, the "Bollinger RSI Bands" indicator is an indispensable tool for traders seeking a comprehensive view of market dynamics. With its unique combination of candle coloration and Bollinger Bands, it empowers traders to make more informed and strategic trading decisions, ultimately enhancing their trading outcomes.
Note: Always utilize this indicator in conjunction with other technical and fundamental analysis tools and exercise prudence in your trading decisions. Past performance is not indicative of future results.

RSI Bands [APIDEVs]RSI BANDS:
It is an exclusive product of ApiDevs, this indicator selectively integrates a series of highly advanced algorithms that aim to provide the trader with an effective and profitable trading system, based on a series of conditions that project the price direction with a reasonable probability.
This indicator bears the name of “RSI Bands”, this is because we have based this trading system on the “Relative Strength Index ( RSI )”, the strength of this indicator is centennial and we at APIDEVs have decided to focus our efforts on the development of powerful tools based on the favorite indicators of the afternoon.
WHAT IT HAS INCORPORATED:
1. Exponential Moving Average (EMAs): The RSI Bands has, by default, a band composed of two moving averages of 10 and 55 exponential periods, which can be modified in the indicator menu.
• Possibility of changing the value of the EMAs.
• Function was enabled to change the color and transparency of the bands.
• Visual alerts SHORT (L) and LONG (L) were added when there is the crossing of the EMAS.
• Hull Moving Average ( HMA ) of 100 periods was also incorporated, also modifiable for those who wish to strengthen their visual analysis. (Disabled by default)
• We also add an Exponential Moving Average ( EMA ) of 200 periods to mark the trend. (Disabled by default).
2. ATR ( Average True Range ): This indicator has two main functions in the RSI Bands, the first is to mark the trend of the asset and the second is to establish a margin of safety in price volatility , that is, a maximum estimate of the setbacks without this representing a change in the direction of the price.
3. RSI ( Relative Strength Index ): It was visually incorporated into the RSI Bands, the graph is obtained on the right side and its purpose is to visually indicate where the price is with respect to the RSI PRO+ indicator, offering the following improvements :
• ALERT SYSTEM: THE RSI PRO+ has the ADX incorporated into its algorithm, which allows establishing a filter that will provide reliable inputs, represented by the LONG (L) and SHORT (S) signals.
• FILTER AGAINST TREND: The signals described above will be activated according to the crossing of the RSI above the 50 point, provided that the ADX agrees with the market direction.
• Possibility of deactivating this graphical representation.
4. ADX ( Average Directional Index ): The ADX in this indicator is intended to estimate the strength of the movement, it is present in each part of the code, either to indicate the strength of the market or to serve as a filter against trend. In the same way, we apply certain exclusive improvements for this indicator:
• It was established as default values of the ADX that the Level Range was 10 and the Level Trend 25. This significantly changes the behavior of this indicator, almost completely eliminating the zone of disinterest that was usually considered.
• A function was activated to paint the sails the color of the ADX .
5. ADX Ocillator: Yes, we developed a Wave oscillator type ADX and incorporated it into this strategy. From this indicator, which we recommend using in conjunction with the RSI Bands, we extracted the LONG (L) and SHORT (S) signals. The ADX Oscillator is the improved version of the traditional ADX as it offers the following improvements:
• Its interpretation is much simpler.
• Allows you to set entry and exit signals during the trend change and during the price path.
• It has an integrated alert system.
STRATEGY PANEL:
This panel is an exclusive creation of APIDEVs, and its purpose is to parameterize five conditionals based on the indicators that make up our RSI strategy, giving the trader an immediate vision of the status of the asset analyzed considering this strategy. That is, we decided to transfer our experience of using this indicator on a panel that will project the price trajectory visually. It has the following characteristics:
• It can be placed anywhere on the screen through the main menu of the indicator, it can even be deactivated.
• It can be resized, we designed this to adapt to all types of screens, including those of mobile phones.
• It has an upper panel called "Project" which will calculate the percentage probability that the price has to take a direction based on all the indicators incorporated into the strategy. Their values range from (+ 100%) to (-100%).
STRATEGY PANEL PARAMETERS:
1. EMAs: This panel has 2 variables:
• LONG: If the fast EMA is above the slow EMA .
• SHORT: If the fast EMA is below the slow EMA .
2. RSI: This panel has 3 variables:
• LONG: The RSI should be bullish (green) and above the 50 point.
• SHORT: The RSI should be bearish (red) and be below the 50 point.
• RANK: (Range)this condition is activated when there is no concordance with the RSI condition and its crossing.
3. ATR: This panel has 2 variables:
• LONG: When the price is above the ATR.
• SHORT: When the price is below the ATR.
4. ADX: This panel has 3 variables:
• LONG: The ADX is green. That is, the DI + is above the DI-.
• SHORT: The ADX is red. That is, the DI- is above the DI +.
• RANK: ADX is below point 10.
It also has a numerical value that indicates the value of the ADX and two texts indicating the strength of the trend:
• Trend ( bullish or bearish ).
• Strong trend ( bullish or bearish ).
5. OSC: This panel has 3 variables:
• LONG: The oscillator slopes upward and the built-in ADX is green.
• SHORT: The oscillator slopes downward and the built-in ADX is red.
• RANK: The oscillator slopes downward and the built-in ADX is green and the opposite. In short, there is no coherence in the movement of the oscillator and the projection of the ADX .

RSI with Bull/Bear Resistant -SupportRSI with Bull/Bear Resistant -Support
RSI 14 , Overbought = 70 , Oversold = 30 as original signal use.
RSI line change to be Red when higher 70 and change to be Aqua when lower 30
Bullish or Uptrend use Lime color area.
RSI 80-90 is Bullish Resistant Area.
When RSI hit this area, price are hardly to move up more
RSI 40-50 is Bullish Support Area.
When RSI down from Overbought area to this area, to be alert.
If Price flip up and RSI still in Bullish Support Area, Price have enough momentum to return high.
If Price fall down and RSI break down lower Bullish Support Area, Price change to be down trend.
Bearish or Downtrend use Pink color area.
RSI 15-25 is Bearish Support Area.
When RSI hit this area, price are hardly to move down more.
RSI 55-65 is Bearish Resistant Area.
When RSI go up from Oversold are to this area, to be alert.
If Price flip down and RSI still in Bearish Resistant Area, Price have enough momentum to go more low.
If Price go up and RSI break up higher Bearish Resistant Area, Price change to be uptrend.
..
#WaveRiders

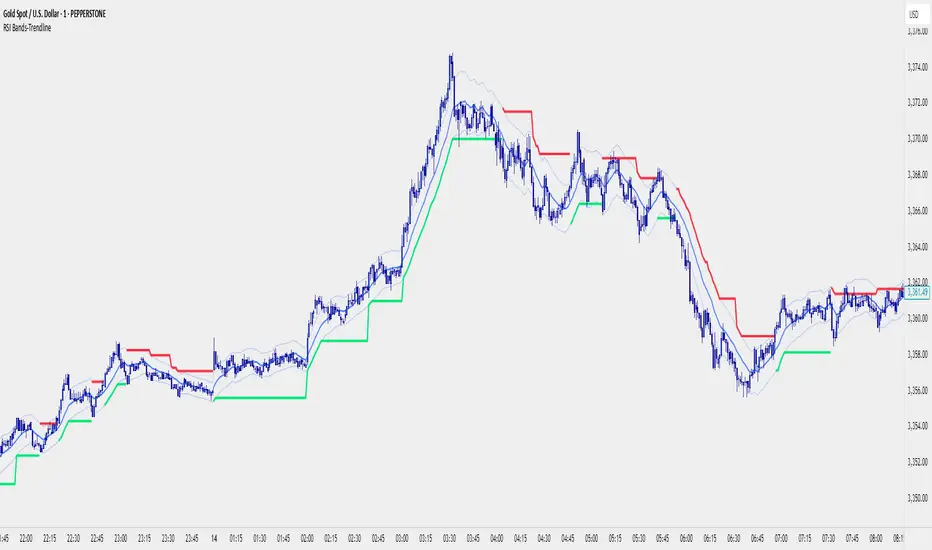
RSI Bands With RSI - ATR Trend LineRSI Bands With RSI - ATR Trend Line (Smoothed Baseline)
Overview
A trend-following tool that fuses RSI-based regime detection with a smoothed baseline and ATR bands. Trend line aims to stay with the RSI move, cut random noise, and flip cleanly. The line draws green in bulls and red in bears; signals fire only on candle close confirmed flips.
Key Features
✅ Dynamic Trend Detection
RSI (>50 / <50) sets bullish/bearish regime
Smoothed baseline adapts to price while damping whipsaw
ATR-based bands expand/contract with volatility
✅ Precise Signal Generation
Buy when trend flips to bullish (close confirms above the upper band)
Sell when trend flips to bearish (close confirms below the lower band)
Flips require a real band break → fewer false transitions
✅ Visual Clarity
Green line = bullish trend, Red line = bearish trend
✅ Customizable Settings
RSI Length (default 14)
Baseline Smoothing (default 26)
ATR Length (default 14)
ATR Multiplier (default 1.4)
Toggles for Signals and Labels
✅ TradingView Alerts
Built-in Buy & Sell alerts (recommend Once per bar close)
How It Works
Algorithm Logic
RSI Regime: RSI above/below 50 sets bull/bear. At exactly 50, the prior target is carried forward.
Target & Smoothing: A per-bar target is built from the bar’s range and RSI, then smoothed with an EMA-style filter (Baseline Smoothing) to form the baseline.
ATR Bands: Upper/Lower = baseline ± (ATR × Multiplier).
Flip Rule (Supertrend-like):
Close above upper band → bullish flip; trend line tracks the lower band (green).
Close below lower band → bearish flip; trend line tracks the upper band (red).
Between bands → prior trend line persists.
Signals/Alerts: A flip event generates a Buy/Sell signal and alert.
Best Use Cases
Trending Markets – Built to ride sustained moves in either direction.
Multiple Timeframes – Works from intraday to higher TFs; higher TFs usually produce cleaner flips.
Various Asset Classes – Forex, Indices, Stocks, Crypto, Commodities; ATR adapts to volatility.
Recommended Settings
Conservative (Lower Frequency)
RSI 14–20 • Baseline 34 • ATR 14–21 • Multiplier 1.8–2.2
Use for swing/position trading; calmer signal stream.
Balanced (Default)
RSI 14 • Baseline 26 • ATR 14 • Multiplier 1.4
Good general-purpose setup for swing or active intraday.
Aggressive (Higher Frequency)
RSI 10–14 • Baseline 13–21 • ATR 10–14 • Multiplier 1.1–1.3
For scalping/day trading; earlier but noisier flips.
🎨 Visual Elements
RSI Smooth baseline (soft blue)
Upper/Lower ATR Bands (faint blue)
Trend Line (Bull/Bear) drawn only in the active regime (green/red)
Optional Buy/Sell arrows and labels
⚠️ Important Notes
Signals on Close
Flips confirm on bar close. Intrabar crosses can revert; wait for confirmation.
Risk Management
Size positions appropriately; many traders trail beyond the opposite band/line.
Factor in spread, slippage, sessions, and news.
Confirmation & Testing
Combine with structure/volume/HTF bias if desired.
Backtest and forward-test per instrument and timeframe.
For research/education only; not financial advice.
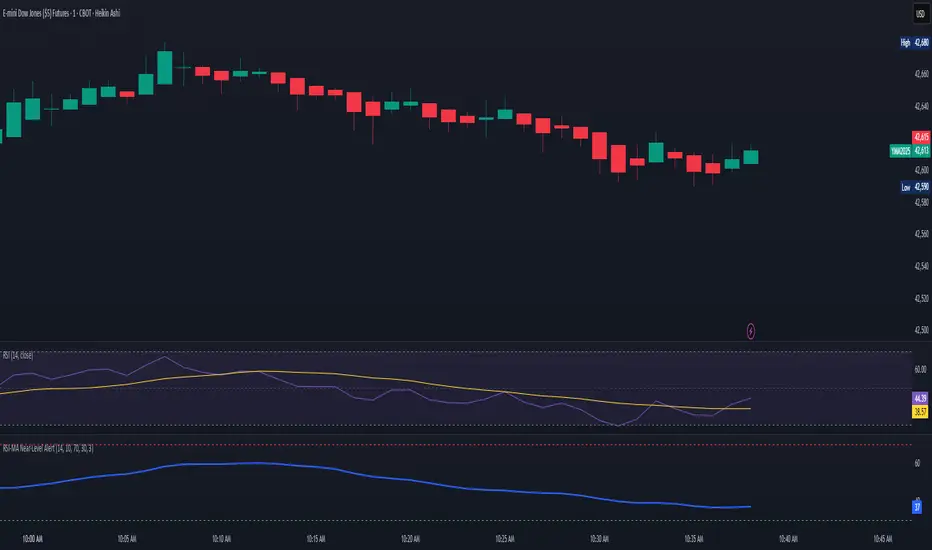
RSI‑MA Near‑Level AlertRSI‑MA Near‑Level Alert — Publication Description
Overview
RSI‑MA Near‑Level Alert plots a smoothed Relative Strength Index (RSI) line and sends automatic alerts whenever that line comes within a user‑defined distance of two key thresholds (default = 70 for overbought, 30 for oversold). It is designed for traders who want an early warning—before a classic 70/30 cross—so they can tighten stops, scale out, or prepare reversal setups.
How It Works
RSI Calculation – Uses the standard RSI (default length 14).
Smoothing – Applies a moving‑average (default Simple 10) to reduce noise.
Proximity Logic – On every bar, the script measures the absolute distance between the smoothed RSI line and each threshold.
If the distance ≤ the Proximity setting (default 1 point), the condition flips to true.
Built‑in Alert Triggers – Two alertcondition() calls are embedded:
“RSI MA near UPPER level”
“RSI MA near LOWER level”
Select either one (or both) from the TradingView alert dialog and choose your delivery method (popup, e‑mail, SMS, webhook).
Inputs
Input Default Purpose
RSI Length 14 Core momentum look‑back.
Smoothing MA Length 10 Length of the MA applied to RSI.
Upper Level 70 Overbought line.
Lower Level 30 Oversold line.
Alert Proximity (points) 1.0 How close (in RSI points) the MA must get to trigger.
All inputs are fully editable after you add the script to a chart.
Typical Use‑Cases
Pre‑emptive Exits – Get notified when momentum is stalling near 70 or 30 so you can lock in gains before a reversal.
Reversal Hunting – Combine the alert with price‑action patterns (pin bars, engulfing candles) for higher‑probability fades.
Breakout Confirmation – Increase Upper Level to 80 / Lower Level to 20 and lower Proximity to 0.5 for more aggressive trend‑following alerts.
Step‑by‑Step Alert Setup
Add the script to your chart.
Click the alarm‑clock‑plus icon (or press Alt + A).
In “Condition,” select RSI‑MA Near‑Level Alert.
Choose either RSI MA near UPPER level or RSI MA near LOWER level.
Pick Once Per Bar Close for confirmed signals or Once Per Bar for real‑time.
Select your preferred notification methods and click Create.
(Repeat for the opposite threshold.)
Customization Tips
Change Smoothing Type – Replace ta.sma() with ta.ema(), ta.rma(), etc., directly in the code if you prefer another MA.
Track Multiple Assets – Apply the indicator to each symbol in a multi‑chart layout and set independent alerts.
Narrow Range Play – Set Upper = 60, Lower = 40 and Proximity = 0.5 to monitor a quiet‑momentum band.
Disclaimer
This script is provided for educational purposes only. It does not constitute financial advice, and past performance is not indicative of future results. Always back‑test and validate on demo data before risking live capital. The author assumes no liability for trading losses or platform malfunctions.
RSI Multi-TF TabRSI Multi-Timeframe Table 📊
A tool for multi-timeframe RSI analysis with visual overbought/oversold level highlighting.
Description
This indicator calculates the Relative Strength Index (RSI) for the current chart and displays RSI values across five additional timeframes (15m, 1h, 4h, 1d, 1w) in a dynamic table. The color-coded system simplifies identifying overbought (>70), oversold (<30), and neutral zones. Visual signals on the chart enhance analysis for the current timeframe.
Key Features
✅ Multi-Timeframe Analysis :
Track RSI across 15m, 1h, 4h, 1d, and 1w in a compact table.
Color-coded alerts:
🔴 Red — Overbought (potential pullback),
🔵 Blue — Oversold (potential rebound),
🟡 Yellow — Neutral zone.
✅ Visual Signals :
Background shading for oversold/overbought zones on the main chart.
Horizontal lines at 30 and 70 levels for reference.
✅ Customizable Settings :
Adjust RSI length (default: 14), source (close, open, high, etc.), and threshold levels.
How to Use
Table Analysis :
Compare RSI values across timeframes to spot divergences (e.g., overbought on 15m vs. oversold on D).
Use colors for quick decisions.
Chart Signals :
Blue background suggests bullish potential (oversold), red hints at bearish pressure (overbought).
Always confirm with other tools (volume, trends, or candlestick patterns).
Examples :
RSI(1h) > 70 while RSI(4h) < 30 → Possible reversal upward.
Sustained RSI(1d) above 50 may indicate a bullish trend.
Settings
RSI Length : Period for RSI calculation (default: 14).
RSI Source : Data source (close, open, high, low, hl2, hlc3, ohlc4).
Overbought/Oversold Levels : Thresholds for alerts (default: 70/30).
Important Notes
No direct trading signals : Use this as an analytical tool, not a standalone strategy.
Test strategies historically and consider market context before trading.

RSI Horizontal resistance levelsRSI Horizontal Resistance Levels
Purpose
This study automatically draws horizontal price rays every time the Relative Strength Index (RSI) trades inside a user‑defined band (default = 50 ± 1). The idea is to spotlight price levels that historically coincided with a specific RSI state—levels that often evolve into short‑term support or resistance as sentiment repeats.
How it works
Raw RSI – The script computes an un‑smoothed RSI of the closing price (rsiLength, default = 3).
Trigger zone – Whenever RSI falls within level ± tolerance (e.g., 49 – 51) the close price of that bar becomes a reference.
Horizontal ray – A ray (extend.right) is drawn from that close and continues indefinitely to the right, creating a live price level.
History management – Only the most recent N rays are kept (maxRays, default = 5); the oldest line is deleted automatically to avoid chart clutter.
Inputs
Name Default Description
RSI Length 3 Look‑back of the RSI calculation.
RSI Level 50 Center of the trigger zone. Common alternatives: 30, 70, custom mid‑lines.
Tolerance 1 Width of the RSI band on each side of RSI Level (set 0 for an exact hit).
Max Rays 5 Maximum number of active horizontal levels kept on screen.
Ray Color Yellow Visual color of the rays.
Ray Width 2 Thickness of the rays.
How to use it
Spot recurring reaction zones – Markets often hesitate near prices where momentum has flipped before. The rays reveal those spots automatically.
Combine with candlestick or volume cues – A level marked by this script plus a rejection wick, volume spike, or divergence can strengthen conviction.
Adapt the band –
50 ± tolerance → momentum balance line (trend pullbacks)
70 ± tolerance → overbought fade levels
30 ± tolerance → oversold bounce levels
Works on any asset or timeframe; shorter RSI periods highlight intraday rotations, longer periods capture swing pivots.
Tips & cautions
A drawn line is not a guarantee of future reversal—always validate with price action and risk management.
For high‑frequency strategies, consider lowering tolerance or increasing rsiLength to reduce noise.
You can add custom alerts on RSI crossing the band to receive push or email notifications.
Happy trading!

RSI with HMA & Momentum ZonesRSI with HMA & Momentum Zones — Indicator Description
This indicator combines Relative Strength Index (RSI) analysis with Hull Moving Averages (HMA) and Momentum Zone detection to provide a multi-layered view of market strength, trend shifts, and divergence signals.
It includes:
Main Features:
RSI Core:
Standard RSI calculated from a customizable source (close, open, etc.) with adjustable length.
A dynamic RSI Signal Line is plotted with selectable smoothing types (SMA, EMA, SMMA, WMA, VWMA) to enhance trend-following signals.
RSI crossovers of its signal line change color (green for bullish crossovers, red for bearish crossunders).
Hull Moving Averages (HMA):
Two HMA lines are plotted based on the RSI:
Short HMA (fast) and Long HMA (slow).
Color shifts indicate crossovers between RSI and Short HMA (short-term trend change) and Short HMA vs Long HMA (longer-term trend shifts).
Momentum Zones:
When the gap between the RSI and the Long HMA exceeds a user-defined threshold:
A green background highlights strong bullish momentum.
A red background highlights strong bearish momentum.
Helps visualize when momentum becomes extended.
Divergence Detection (Optional):
Regular and hidden bullish and bearish divergences are automatically detected between price and RSI.
Divergences are plotted on the RSI pane with labels ("Bull", "H Bull", "Bear", "H Bear").
Adjustable lookback settings for fine-tuning sensitivity.
Alerts are available for all divergence events.
Visual Enhancements:
A shaded cloud fills between RSI and its signal line, green for bullish bias and red for bearish bias.
Horizontal bands at 70, 50, and 30 levels to mark traditional RSI zones (overbought, neutral, oversold).
Customization Options:
All major components — RSI settings, Signal Line type, HMA lengths, Momentum Zone threshold, and Divergence controls — are fully adjustable.

RSI Disparity SignalRSI Disparity Signal Indicator
Overview:
This TradingView indicator detects when the RSI is significantly lower than its RSI-based moving average (RSI MA). Whenever the RSI is 20 points or more below the RSI MA, a signal (red dot) appears above the corresponding candlestick.
How It Works:
Calculates RSI using the default 14-period setting.
Calculates the RSI-based Moving Average (RSI MA) using a 14-period simple moving average (SMA).
Measures the disparity between the RSI and its MA.
Generates a signal when the RSI is 20 points or more below the RSI MA.
Plots a red circle above the candlestick whenever this condition is met.
Customization:
You can modify the RSI length and MA period to fit your trading strategy.
Change the plotshape() style to use different symbols like triangles or arrows.
Adjust the disparity threshold (currently set at 20) to make the signal more or less sensitive.
Use Case:
This indicator can help identify potentially oversold conditions where RSI is significantly below its average, signaling possible price reversals.

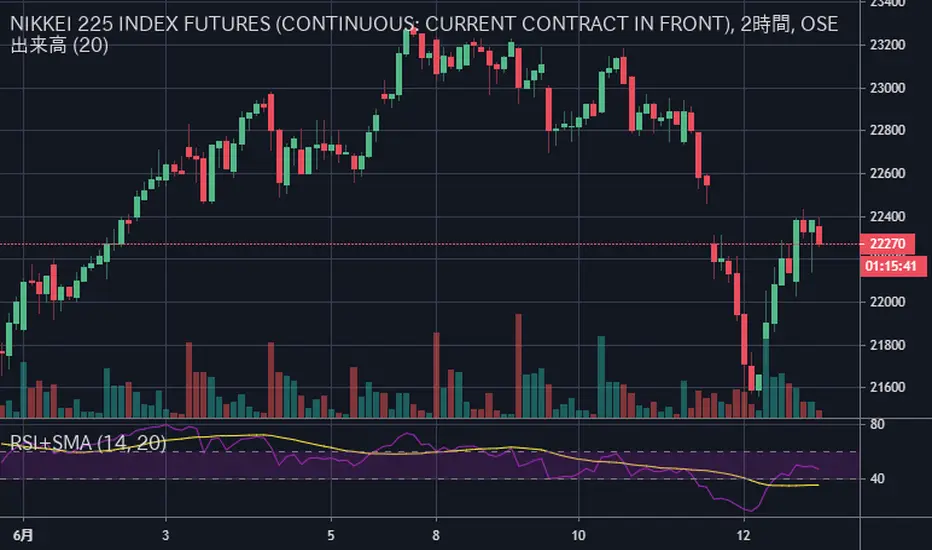
RSI+SMARSIにSMAを加えただけのシンプルなインジケータです
SMAはRSIの計算結果を元に出しています
考え方の例 :
買いの例)
1 RSIがSMAを上抜いた
2 RSIがSMAを上抜き、かつ、60以上である
売りの例)
1 RSIがSMAを下抜いた
2 RSIがSMAを下抜き、かつ、40以下である
This simple indicator is plot SMA, in RSI indicator.
SMA is calculated based on the calculated RSI value
Example of way of thinking :
buy ex)
1 RSI break out SMA
2 RSI break out SMA and RSI over 60
sell ex)
1 RSI break down SMA
2 RSI break down SMA and RSI under 40
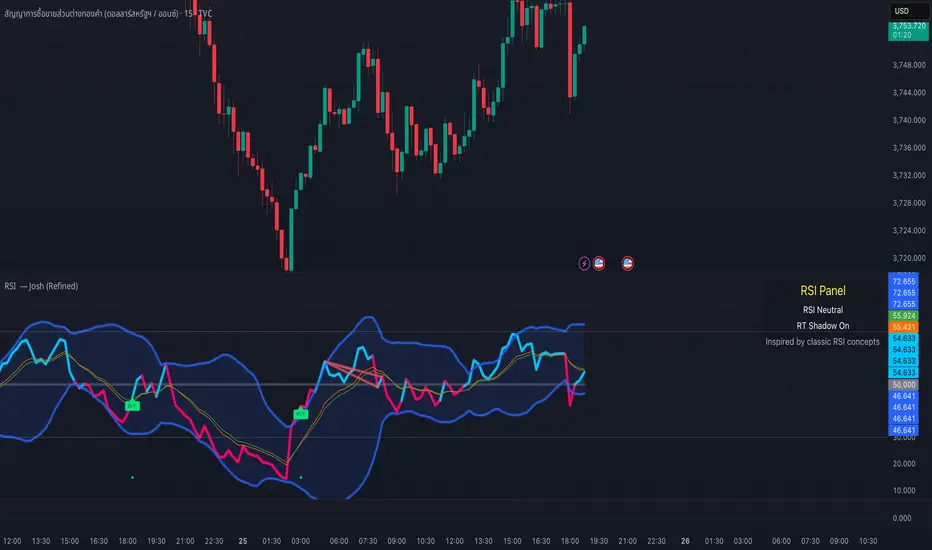
RSI — Josh (Refined)RSI Buy/Sell Pro — Josh (Refined)
Overview
This study enhances the classic RSI (Relative Strength Index) by adding multiple visualization layers and research tools. It helps users see overbought/oversold conditions, divergence patterns, and momentum shifts more clearly — in a way that is visually intuitive.
⚠️ Disclaimer: This script is for educational and research purposes only. It does not provide financial advice or trading recommendations. Past signals are not indicative of future results. Users remain fully responsible for their own decisions and risk management.
Key Features
Custom RSI Signals
Flexible signal modes (Strict 30/70, Loose, Aggressive 50-cross)
Optional “BUY/SELL” visual text or compact labels
Adjustable cooldown between signals
RSI Divergence Detection
Classic bullish/bearish divergence with pivot confirmation
Real-time “Shadow Divergence” preview (may repaint, by design)
Visual waterline and shaded shadow effects
MA Cross on RSI
Overlay fast/slow moving averages directly on the RSI scale
Crossovers highlighted with markers and alerts
Bollinger Aura (Glow Effect)
Bollinger Bands applied to RSI with customizable color modes
Single color, Upper/Lower, or Zone-driven bull/bear tint
Optional soft fill between bands for clarity
Guidance Panel
On-chart panel summarizing RSI state (OB/OS/Neutral), real-time shadow status, and credits
Alerts Included
RSI BUY / SELL cross conditions
RSI MA cross up / down
Divergence signals (classic & real-time)
Usage Notes
Designed to visualize RSI dynamics and assist in technical research
The “BUY/SELL” markers are visual study tags only — not trade calls
For best practice, combine with higher timeframe context, support/resistance, or volume analysis
Always validate ideas in a demo environment before applying to live trading
Compliance & Credits
Built in Pine Script® v5 on TradingView
Indicator name and labels are for visualization only — not investment advice
Credits: Inspired by classic RSI concepts, refined with additional visualization methods
✅ This description keeps your script compliant:
No performance guarantees
No marketing language like “make profit fast”
Clear disclaimer & educational framing
Cardwell RSI by TQ📌 Cardwell RSI – Enhanced Relative Strength Index
This indicator is based on Andrew Cardwell’s RSI methodology , extending the classic RSI with tools to better identify bullish/bearish ranges and trend dynamics.
In uptrends, RSI tends to hold between 40–80 (Cardwell bullish range).
In downtrends, RSI tends to stay between 20–60 (Cardwell bearish range).
Key Features :
Standard RSI with configurable length & source
Fast (9) & Slow (45) RSI Moving Averages (toggleable)
Cardwell Core Levels (80 / 60 / 40 / 20) – enabled by default
Base Bands (70 / 50 / 30) in dotted style
Optional custom levels (up to 3)
Alerts for MA crosses and level crosses
Data Window metrics: RSI vs Fast/Slow MA differences
How to Use :
Monitor RSI behavior inside Cardwell’s bullish (40–80) and bearish (20–60) ranges
Watch RSI crossovers with Fast (9) and Slow (45) MAs to confirm momentum or trend shifts
Use levels and alerts as confluence with your trading strategy
Default Settings :
RSI Length: 14
MA Type: WMA
Fast MA: 9 (hidden by default)
Slow MA: 45 (hidden by default)
Cardwell Levels (80/60/40/20): ON
Base Bands (70/50/30): ON

RSI Divergence + MTF PanelRSI Divergence + MTF Panel
📊 Short Description
A powerful indicator for detecting RSI divergences with a multi-timeframe panel that helps traders find high-quality trading opportunities across different time intervals.
✨ Key Features
🎯 Automatic Divergence Detection
- **Bullish Divergence**: Price makes lower lows while RSI makes higher lows
- **Bearish Divergence**: Price makes higher highs while RSI makes lower highs
- Visual divergence marking with lines on the chart
- Customizable colors and line styles
📈 Multi-Timeframe Panel (MTF)
- Displays RSI from 4 fixed timeframes simultaneously (5m, 15m, 1H, 4H)
- Color-coded RSI levels:
- 🔴 Red: RSI > 70 (overbought)
- 🟢 Green: RSI < 30 (oversold)
- ⚪ White: RSI between 30-70 (neutral zone)
⚙️ Flexible Settings
- RSI period (default 14)
- Divergence detection threshold
- Data source selection (close, hl2, hlc3, ohlc4)
- Color and transparency customization
- Enable/disable indicator components
📋 How to Use
1. **Add the indicator to your chart** - it will automatically start scanning for divergences
2. **Adjust parameters** to match your trading style
3. **Monitor the MTF panel** for overall market condition overview
4. **Look for divergences** combined with other signals for confirmation
🎯 Perfect for:
- Swing trading
- Intraday trading
- Finding reversal points
- Confirming trading signals
- Multi-timeframe analysis
⚡ Advantages
- **Automation**: No need to manually search for divergences
- **Multi-functionality**: RSI analysis + MTF overview in one indicator
- **Visual clarity**: Clear signals and color coding
- **Performance**: Optimized code for fast operation
- **Flexibility**: Wide customization options
📊 Technical Details
- Uses standard RSI with customizable period
- Divergence detection algorithm based on peaks and valleys
- MTF panel updates in real-time
- Supports all asset types (stocks, forex, crypto, commodities)
🔧 Usage Recommendations
- Combine with other indicators for signal confirmation
- Consider overall market trend
- Use risk management rules
- Test settings on historical data
👥 Suitable for:
- Beginners (easy to use)
- Experienced traders (flexible settings)
- All trading styles and timeframes
---
*This indicator is designed to enhance trading efficiency and help make informed trading decisions. Always follow risk management rules and don't rely on just one indicator.*

RSI Z‑Score + TableRSI Z-Score + Table
This script calculates the Z-Score of the RSI (Relative Strength Index), which standardizes RSI based on its own recent history.
What It Shows:
RSI Z-Score = (Current RSI - Mean RSI) / Standard Deviation
This tells you how extreme the current RSI is compared to its historical values.
A table displays:
Current RSI
Rolling Mean
RSI Z-Score
How to Use:
Z-Score > +2 = Statistically overbought
Z-Score < -2 = Statistically oversold
Use it to time reversals or overextension in RSI behavior.
🔒 Based on rolling lookback window — fully customizable.
Author:
Tags: #RSI #ZScore #Momentum #StatisticalEdge #MeanReversion #Crypto
