RSI LevelsRSI Levels
- The relative strength index ( RSI ) is a technical indicator used in the analysis of financial markets.
It is intended to chart the current and historical strength or weakness of a stock or market based on the closing prices of a recent trading period.
- This indicator allows us to visualize the levels of rsi in the chart, so that we can calculate take profit and stop points in a simple way,
knowing what position the price is currently in relation to these levels and how much space we have.
- We can also visualize the slope of the three levels of rsi , overbought, oversold and level 50, something that is not possible in the oscillator version.
- It allows you to display 2 rsi values at the same time.
- Allows to change the color of candlesticks based on rsi.
Cari dalam skrip untuk "rsi"

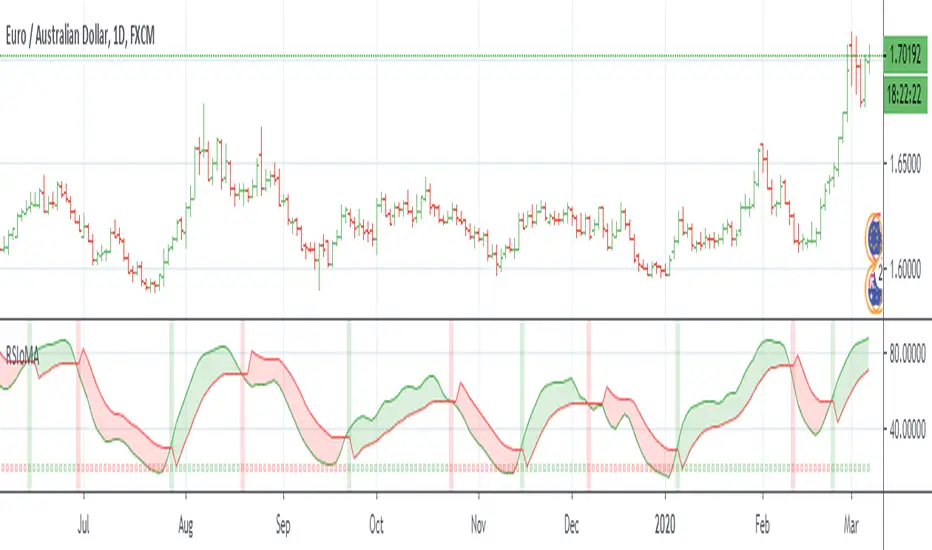
RSI of MAsRSI of MAs is designed to calculate the moving average for a specific period, and then take the RSI of that value. This script allows the user to select which moving average they would like to utilize for the calculation, as well as customizing how the Signal Line is calculated. There are many combinations available and you will need to tune the indicator to fit your trading style. The Signal Line is designed to indicate when there is a potential change in price action. If the Signal Line is below RSIoMA, price is bullish. If the Signal Line is above RSIoMA, price is bearish.
MA Period is the length/period the moving average is calculated with
RSI Period is the length/period the RSI is calculated with
RSI MA Mode determines which moving average is applied to the MA period
Signal Line determines which moving average or QQE is used to calculate the signal line
Signal Line Period is the length/period the Signal Line is calculated with
As always, trade at your own risk.
Multiple MA Options Credits to @Fractured
Signal Line Options Credits to @lejmer
Bits and Pieces from @AlexGrover, @Montyjus, and @Jiehonglim
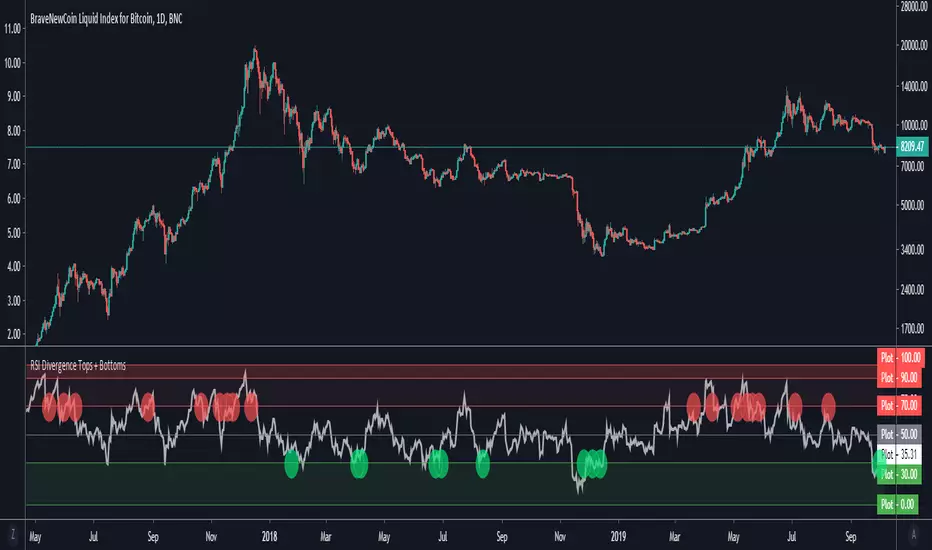
RSI Divergence Tops + BottomsRSI Indicator which plots local peaks and troughs in divergence.
Divergence is specified as:
- A higher price, with reduced RSI --> Potential Sell Point
- A lower price, with higher RSI --> Potential Buy Point
RSI Divergence should be used in combination with other indicators. This indicator identifies local tops and bottoms, with potential for macro trend shifts.
Read more about trading RSI Divergence on Investopedia here: www.investopedia.com
RSI + Stoch RSI + CCI [PrimeTrading]RSI + Stoch RSI + CCI alerts overlay (3 in one)
Blue alert = CCI crossover bullish
Red Alert = CCI crossover Bearish
-----
How to use it?
You can compare the alerts with RSI and Stoch RSI conditions to see if its reliable, check my vertical lines on the chart
Feel free to contact me anytime, good luck!
PrimeTrading

RSI DivergenceRSI DIVERGENCE is a difference between a fast and a slow RSI. Default values are 5 for the fast one and 14 for the slow one.
You can use this indicator in 2 different ways:
normal RSI : check double or triple top/bottom on a chart meanwhile RSI is descending/ascending (check the example on chart)
signal line : when RSI Divergence cross zero line from bottom to top you get a buy signal (the line become green), vice versa when the RSI Divergence cross zero line in the opposite way you get a sell signal (the line become red)

RSI Divergence wpr Engine by MadScientistRSI Divergence Engine by MadScientist - Advanced Momentum Analysis
A powerful divergence detection system that automatically identifies and visualizes bullish and bearish divergences between price action and oscillator momentum.
🎯 Key Features:
4 Divergence Types: Regular & Hidden Bullish/Bearish divergences
Dual Oscillator Support: Toggle between RSI and Williams %R
Automatic Detection: Smart pivot-based algorithm finds divergences in real-time
Visual Clarity: Divergence lines drawn directly on oscillator with color-coded labels
Customizable Settings: Adjust pivot lookback, divergence strength, and visual preferences
Full Alert System: 7 alert conditions for all divergence combinations
📊 Divergence Types:
Regular Bullish 🐂: Price makes lower low, oscillator makes higher low (reversal signal)
Hidden Bullish 🐂: Price makes higher low, oscillator makes lower low (trend continuation)
Regular Bearish 🐻: Price makes higher high, oscillator makes lower high (reversal signal)
Hidden Bearish 🐻: Price makes lower high, oscillator makes higher high (trend continuation)
⚙️ Configurable Parameters:
Oscillator type (RSI or Williams %R)
RSI/WPR length and overbought/oversold levels
Pivot lookback period (1-50 bars)
Maximum lookback range (10-200 bars)
Minimum divergence strength filter
Individual show/hide toggles for each divergence type
Customizable colors and zones
Perfect for traders seeking:
Early reversal signals
Trend continuation confirmations
Momentum analysis
Multi-timeframe divergence screening
Usage Tips: Works best on higher timeframes (4H+) for swing trading, or lower timeframes (5M-15M) for day trading. Combine with support/resistance levels for highest probability setups.

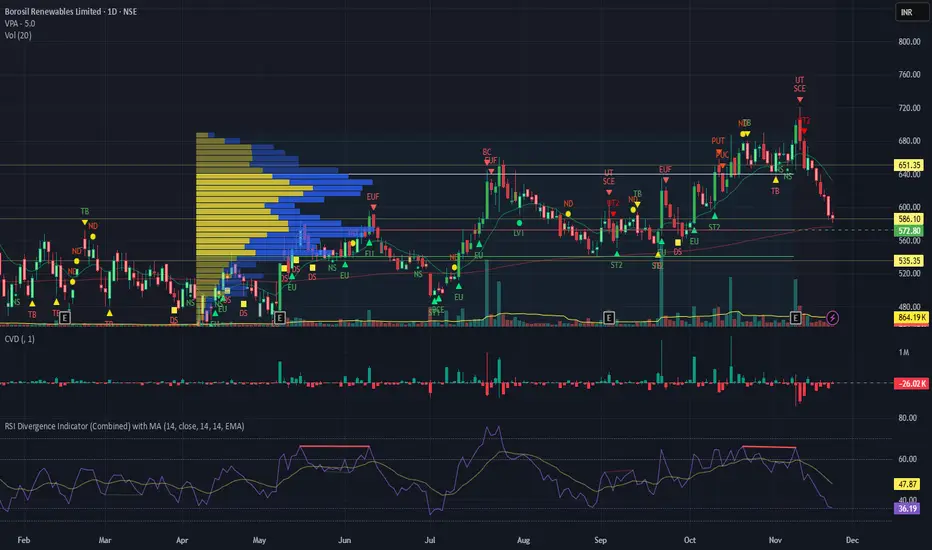
RSI Divergence Indicator with closingRSI Divergence Indicator with Closing Line is an advanced momentum-analysis tool that combines Regular Divergence, Hidden Divergence, Multi-RSI comparison, Moving Averages, and a dynamic RSI Closing Line into one powerful oscillator panel.
This script is designed for traders who want deeper insight into momentum strength, trend exhaustion, and reversal zones by analyzing both price action and RSI structure.
Multi-Timeframe Stochastic RSI ArrowsMulti-Timeframe Stochastic RSI Arrows Indicator by The Venetian
Dear Moderators before you torch me alive theres nothing groundbreaking just very handy indicator for some users.
This indicator provides traders with a jet fighter-style heads-up display for market momentum across multiple timeframes. By displaying Stochastic RSI directional arrows for 12 different timeframes simultaneously, it offers a comprehensive view of market conditions without requiring multiple chart windows.
How It Works
The indicator calculates the Stochastic RSI for each of 12 common timeframes (1m to 3M) and represents directional movements with intuitive arrows:
- ▲ Green up arrow = Rising momentum
- ▼ Red down arrow = Falling momentum
- ◄► Yellow horizontal arrows = Flat/sideways momentum
- ► Gray right arrow = Just peaked (crossed above overbought)
- ◄ Gray left arrow = Just bottomed (crossed below oversold)
Each timeframe's status appears with its label (e.g., "1m ▲") in a clean, vertically-stacked display using ATR-based spacing to maintain consistent visual appearance regardless of price scale.
Key Features
- ATR-Based Spacing : Uses Average True Range to maintain consistent distances between labels even as chart scale changes
- Multi-Timeframe Analysis: Easily spot divergences and confluences across timeframes (1m, 3m, 5m, 15m, 30m, 1h, 2h, 4h, 1D, 1W, 1M, 3M)
- Sensitivity Control: Adjust flat detection sensitivity to filter out noise
- Customisable Appearance: Modify arrow size, vertical spacing, and show/hide timeframe labels
- Overbought/Oversold Detection: Highlights when momentum has peaked or bottomed at extreme levels
- Trading Applications
- Trend Alignment: Quickly identify when multiple timeframes align in the same direction
- Divergence Detection: Spot when shorter timeframes begin to shift against longer ones
- Entry/Exit Timing: Use crossovers of significant timeframes as potential signals
- Market Context: Maintain awareness of the bigger picture while trading shorter timeframes
This indicator doesn't break new ground technically but excels in presenting complex multi-timeframe information in a clean, actionable format — much like a pilot's heads-up display provides critical information at a glance. The ATR-based positioning ensures consistent visibility across different instruments and market conditions.
Great effort has been made for this script to adhere to TradingView's Pine Script house rules and focuses on trader usability rather than introducing novel technical concepts.

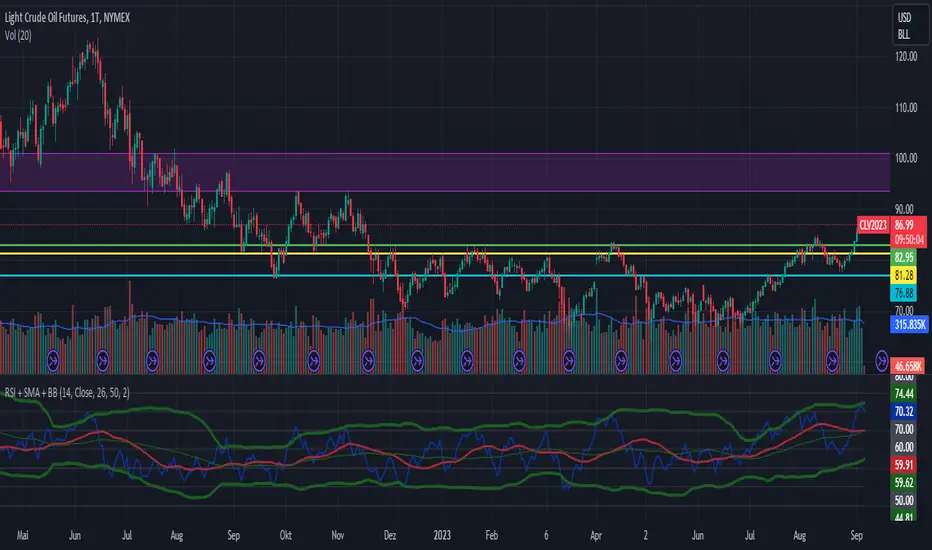
RSI with SMA and Bollinger BandsRSI with SMA and Bollinger Bands
The SMA and BB use the RSI as a source. The source of the RSI is selectable.
With the right settings, you can effectively determine the trend phase and trend strength.
I personally use the following settings:
RSI with a 14-period applied to Price Close.
The SMA has a 26-period, and the Bollinger Bands have a period of 50 with a deviation of 2.
Volume RSIThis is an indicator that shows the inflow and outflow of volume into a financial instrument. Volume is likely one of the most underrated source of data in trading unfortunately so there seems to be a lack of studies on it. The size of the candle is related to the strength of the move. The calculations for this are: cumulative sum of +volume if open < close OR -volume if open > close. This has been now transformed into an rsi style indicator to give a distinct advantage (or atleast thats the idea). The idea is that we take rsi of candles so we might as well take the rsi of volume candles. As far as I can tell it is faster/its own thing compared to regular rsi. I ave also added a smoothing option. Dont forget you can change the settings and you wont die. Thank you for your interest in this release I hope you find great piles of money with it.
link to the script I used to make this

RSI-Adaptive, GKYZ-Filtered DEMA [Loxx]RSI-Adaptive, GKYZ-Filtered DEMA is a Garman-Klass-Yang-Zhang Historical Volatility Filtered, RSI-Adaptive Double Exponential Moving Average. This is an experimental indicator. The way this is calculated is by turning RSI into an alpha value that is then injected into a DEMA function to output price. Price is then filtered using GKYZ Historical volatility. This process of creating an alpha out of RSI is only relevant to EMA-based moving averages that use an alpha value for it's calculation.
What is Garman-Klass-Yang-Zhang Historical Volatility?
Yang and Zhang derived an extension to the Garman Klass historical volatility estimator that allows for opening jumps. It assumes Brownian motion with zero drift. This is currently the preferred version of open-high-low-close volatility estimator for zero drift and has an efficiency of 8 times the classic close-to-close estimator. Note that when the drift is nonzero, but instead relative large to the volatility , this estimator will tend to overestimate the volatility . The Garman-Klass-Yang-Zhang Historical Volatility calculation is as follows:
GKYZHV = sqrt((Z/n) * sum((log(open(k)/close( k-1 )))^2 + (0.5*(log(high(k)/low(k)))^2) - (2*log(2) - 1)*(log(close(k)/open(2:end)))^2))
Included
Alerts
Signals
Loxx's Expanded Source Types
Bar coloring

RSI with Bollinger Bands Binary system by Hashtag_binaryRSI with Bollinger Bands is binary options high/low trading system based on the volatility.
- Time frame 30min - 1H
- Expiry time 2 candles
- Markets: Forex currency pairs majors: EUR/USD, USD/CHF, GBP/USD, AUD/USD, NZD/USD, EUR/JPY, USD/JPY, AUD/JPY
Rules for RSI with Bollinger Bands Binary system
- Do not start before the economic news
- We wait for the price to eitherhit the lower bollinger band or the upper bollinger band and the moment this happens we take the trade immediatly.
Buy Put:
If the price touches the lower Bollinger band we and RSI is below the 30 we take a put.
Buy Call:
If the price touches the upper Bollinger band we and RSI is above the 70 we take a call.

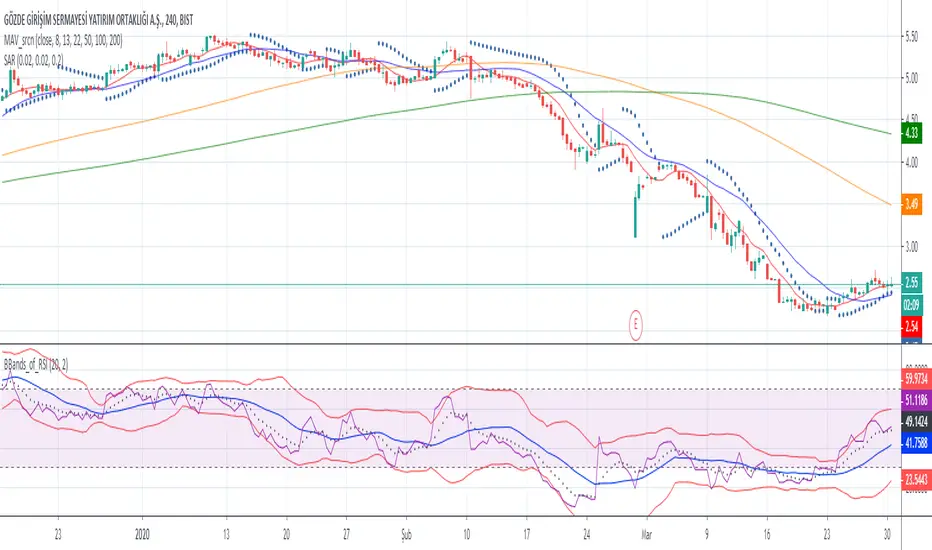
Bollinger Bands of RSIwith this script you can follow ema8 of RSI and also SMA20 of RSI with ∓ 2 standart deviation

RSI Reader DARK THEMERSI reader is an ADD-ON -184.95% of the indicator Market-Reader (available in TV too)
It will detect:
- bullish and bearish divergence
- bullish and bearish cycle on RSI
-When RSI is ready for an acceleration meaning that a significant bull or bear move can occur soon
It is also a RSI with less noise offering a more accurate analysis of the market without adding lag.
This Add-on -184.95% is Free for all user of the indicator Market-Reader.
This script will be continuously update
Access requires subscription (contact by MP 1.50% )

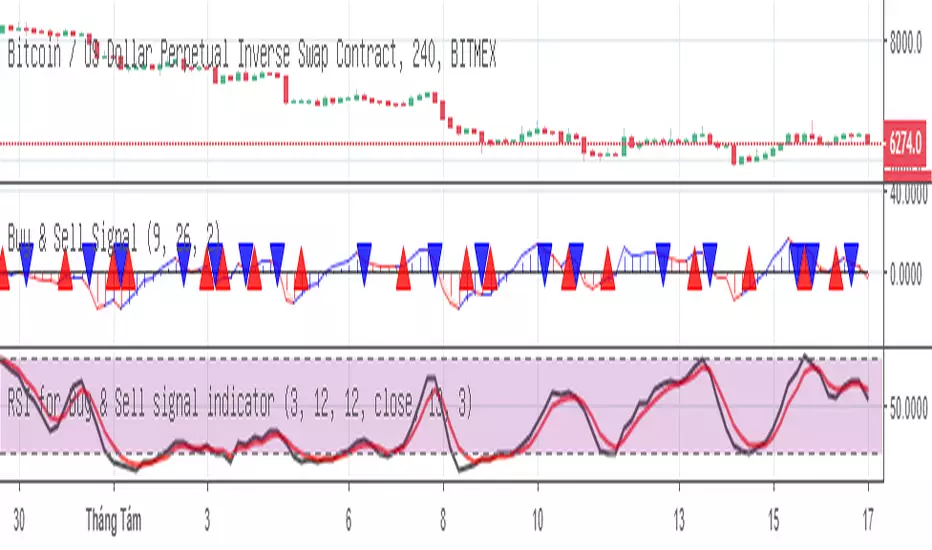
RSI for Buy & Sell signal indicatorRSI for Buy & Sell signal indicator
This indicator support for Buy & Sell signal indicator. Give advice for trader before make decision buy or sell. It was coded base on RSI source code + lengthStoch
Include 3 indicators in 1 set
1- Buy & Sell signal indicator
2- RSI for Buy & Sell signal indicator
3- MACD for Buy & Sell signal indicator
Feel free to inbox me for 3 days trial.
***************************************************************************************************************************************************
Gửi anh chị trader
Đây là chỉ báo điều kiện trong bộ chỉ báo gồm 3 chỉ báo tin hiệu mua và bán. Bộ chỉ báo này cung cấp những điều kiện cần và đủ trước khi vào lệnh về cơ bản chỉ là RSI nhưng được code riêng chỉ dành cho chỉ báo Buy & Sell signal indicator
Anh chị có nhu cầu vui lòng inbox test thử 3 ngày. Xin cảm ơn
RSI EMA TRENDRSI overbought and oversold are visible with red and green lines at the tip
Crossing of RSI and EMI is used to enter the trade for a quick scalp
Trend colours are used to see if the current market is bullish or bearish for a particular coin
look for the candle to close below EMA 5 (offset 2) on 15min chart, RSI below EMA (use trend color for confirmation)
look for the candle to close above EMA 5 (offset 2) on 15min chart, RSI above EMA (use trend color for confirmation)

RSI + EMA Dynamic Zones + Volume + Divergence (with RSI 50 line)RSI + EMA Dynamic Zones + Volume + Divergence (with RSI 50 line)

RSI Divergence on 4-Hour with 1hr & 15min CorrectionRSI Divergence on 4-hr chart viewed on the hourly chart, watch hourly and 15min rsi levels interact with correction of the 4 hr rsi divergence.

RSI Divergence on Daily with 4hr & 1hr CorrectionRSI Divergence on Daily chart viewed in 4 hr timeframe to identifty 4 hr/1hr rsi corrections inside of the identified, Daily RSI level (source high)

RSI SMA ColorRSI 14 with SMA 21 Color. A momentum oscillator that measures the speed and change of price movements. It ranges from 0 to 100 and is typically used to identify overbought or oversold conditions in a market. An RSI above 70 may indicate that an asset is overbought, while an RSI below 30 may suggest it is oversold.

RSI with Divergence and Custom Bullish/Bearish RangesRSI indicator with bullish and bearish shaded ranges accounting for:
- tendency of RSI to peak lower than usual and drop lower than usual in bearish trends
- tendency of RSI to peak higher than usual and bottom out higher than usual in bullish trends

Averaged Stochastic RSI by TenozenSimplicity beats everything! Averaged Stochastic RSi is calculated using the 2 points of stochastic of the RSI, where the difference is by 2 (larger), and averaged out the stochastic's values. In result it is less noisy and more responsive towards the market's momentum.
I hope you guys find this indicator useful! So far this is the best indicator I ever had! And I also learned that simplicity is better than complex blurry/abstract problems. Ciao!
