Scalp PRO Visual momentum through the candlestick pattern. Gradients to show acceleration and deceleration to assist with entry and exits. Different color settings and optimizations. Enjoy!
Cari dalam skrip untuk "scalp"

MOMENTUM FLIPPERScalp tops and bottom of big volatility moves.
Detects when momentum is shifting.
Look for clusters of dim arrows followed by a solid arrow or two.
Best on 2-3 minute chart.
Do not use when choppy.

Scalp Pin + Engulf (Ramesh)How to apply as indicator
In TradingView, open Pine Editor.
Select New → Blank indicator (or clear the editor).
Paste the entire script above.
Click Save, then Add to chart.
You should see:
Green triangles under bars = bullish pin bar at support with trend
Red triangles above bars = bearish pin at resistance with trend
“ENG” labels = engulfing confirmation after pin
From here we can re-add the “fast single-bar reversal” piece once this base version is confirmed working on your chart.


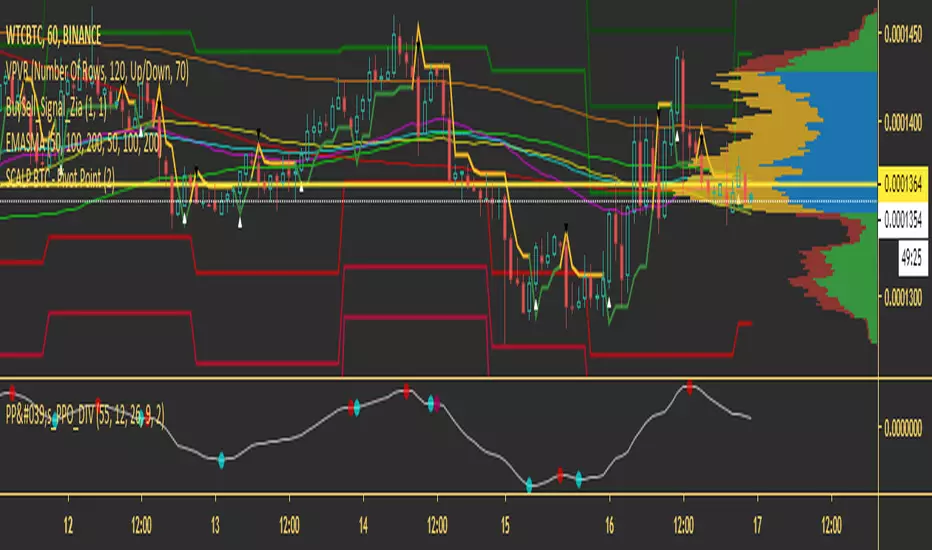
SCALP BTC - PPO DivergenceO indicador Oscilador de Preços (PPO) é uma ferramenta de análise técnica, usada para medir o momento que é muito semelhante ao MACD. O MACD emprega duas Médias Móveis de vários comprimentos (que são indicadores de atraso) para identificar a direção e a duração da tendência. Então, o MACD leva a diferença de valores entre essas duas Médias Móveis (Linha MACD) e uma EMA dessas Médias Móveis (Linha de Sinal) e plota a diferença entre as duas linhas como um histograma que oscila acima e abaixo de uma linha central zero.
O PPO é exatamente o mesmo, no entanto, ele pega os mesmos valores que o MACD e os calcula como uma porcentagem. O propósito disso é que ele torna as comparações de valor muito mais simples e diretas em períodos mais longos de tempo.


SB - VWDEMAScalping @ 1 Minute time frame.
Rules : -
1. Call entry - If Dema and ATR both turns green ( 1 minute TF )
2. Put Entry - If Dema and ATR both turns red ( 1minute TF )
If one is red and other is green wait till both align in same direction.
Vwap - Price above VWAP, call side entry will be rewarded well ( Try to find entry in calls) and if price is below Vwap Put side entry will be rewarded well ( Try to find entry in Puts).
Exit - Follow ATR stop loss line at 1 minute TF ( candle closing basis ).
Can be used on option charts directly.
Best results - Nifty derivatives @ 1 Minute TF, however it can work well with other instruments too.
Make your display setting as per your convenience.


US100 Liquidity Precision StrategyScalping strategy 5-10 point sl / 17 points tp
Automatic BE
Consistent money over time

Scalping all timeframe EMA & RSIEMA 50 and EMA 100 combined with RSI 14
Should also be accompanied by the RSI 14 chart.
With the following conditions:
IF the EMAs are close but not crossing:
* Be prepared to take a Sell position if the first Bearish Candlestick crosses the lowest EMA, and the RSI value is equal to or below 40.
* Be prepared to take a Buy position if the first Bullish Candlestick crosses the highest EMA, and the RSI value is equal to or above 60.
IF the EMAs are overlapping and crossing:
* Be prepared to take a Sell position if the first Bearish Candlestick crosses both EMAs, and the RSI value crosses below 50.
*Be prepared to take a Buy position if the first Bullish Candlestick crosses both EMAs, and the RSI value crosses above 50.

Scalping System by Machine# Custom Trading System Indicator
This Pine Script indicator is designed to identify potential trading setups based on a specific set of rules. It's intended for use on lower timeframes (M1-M5) in the forex market, particularly during the New York-London overlap period.
## Key Features
1. **EMA Condition**: Uses a 20-period Exponential Moving Average (EMA) to determine trend direction.
2. **Candle Analysis**: Identifies strong bars and candle color changes.
3. **Volume Confirmation**: Checks for increasing volume.
4. **Volatility Filter**: Utilizes the Average True Range (ATR) to gauge market volatility.
5. **Time-based Filter**: Highlights the New York-London overlap period.
6. **Visual Aids**: Plots potential entry points, stop losses, and take profit levels.
## Trading Rules
1. **Buy Signal**:
- Price is above the 20 EMA
- Candle color changes from red to green
- Current candle is a strong bar (closing within 75% of its range)
- Volume is higher than the previous bar
- ATR(14) is above 4 pips OR it's during the NY-London overlap
2. **Sell Signal**:
- Price is below the 20 EMA
- Candle color changes from green to red
- Current candle is a strong bar (closing within 75% of its range)
- Volume is higher than the previous bar
- ATR(14) is above 4 pips OR it's during the NY-London overlap
3. **Stop Loss**: Placed near the low of the setup candle for buys, or near the high for sells.
4. **Take Profit**: Aimed at 1R (one times the range of the setup candle).
## Visual Elements
- **20 EMA**: Plotted as a blue line on the chart.
- **Buy Signals**: Green triangles below the candles.
- **Sell Signals**: Red triangles above the candles.
- **Stop Loss Levels**: Small red dots at the calculated stop loss prices.
- **Take Profit Levels**: Small green dots at the calculated take profit prices.
- **Information Table**: Displays current values for ATR, strong bar condition and volume condition.
## Usage Notes
1. This indicator is designed for manual trading, not automated execution.
2. It works best when combined with analysis of major trend lines, support, and resistance levels.
3. Exercise caution with very large setup candles.
4. Consider additional filters or money management rules for enhanced performance.
5. For higher timeframe bias validation, consider incorporating a 100-period break of structure (BOS) analysis.
## Customization
The indicator includes several input parameters that can be adjusted:
- EMA Length
- ATR Length and Threshold
- Volume Multiplier
- Strong Bar Percentage
Users can also toggle the visibility of stop loss and take profit markers.
Remember, while this indicator can identify potential setups, it should be used in conjunction with other forms of analysis and risk management strategies. Always consider the overall market context and your personal risk tolerance when making trading decisions.

Scalping CPRFetch Previous Day's Data:
Uses request.security to get the previous day's high, low, and close prices.
lookahead=barmerge.lookahead_on ensures the data fetched is fixed for the current session.
Calculate CPR Levels:
Pivot: Average of the previous day's high, low, and close.
Bottom Central Pivot (BC): Average of the previous day's high and low.
Top Central Pivot (TC): Derived from the pivot and BC.
R1 and S1: First resistance and support levels calculated from the pivot and previous day's prices.
Plotting:
Plots the CPR levels (pivot, BC, TC, R1, S1) on the chart with different colors.
Scalping 1minMost trustworthy indicator for 1 minutes trader! This indicator is the same as the Bollinger band but much more reliable with extremely on-point signals! a lower line means buy, upper lines mean sell, the middle line is an extremely powerline so trade on the middle line will be mostly profitable!
Scalping EMA ADX RSI with Buy/Sell AlertsThis is a study indicator that shows the entries in the strategy seen in one of the youtube channel so it does not belong to me. I can't tell who it is because it's against the House Rules to advertise but you can find out if you look for it on youtube. Default values of oscilators and ema adjusted as suggested. He says he got the best results in 5 min timeframe but i tried to make things as modifiable as possible so you can mess around with the settings and create your own strategy for different timeframes if you'd like. Suggested to use with normal candlestick charts. The blue line below indicates the ADX is above the selected threshold set in the settings named "Trend Ready Limit". You can set alerts for Buy, Sell or Buy/Sell signal together.
The entry strategy itself is pretty straight forward.
The rules for entry are as follows, the script will check all of this on auto and will give you buy or sell signal :
Recommended time frame: 5 min
For Long Entry:
- Check if price above the set EMA (Can disable this rule if you'd like in the settings)
- RSI is in Oversold
- ADX is above set "Trend Ready" threshold (Meaning there is a trend going on)
- Price must approve the trend of previous candles. This is bullish for buy entries and bearish for sell entries.
- Enter with stop loss below last swing low with 1:1 or 1.5:1 take profit ratio.
For Short Entry:
- Check if price below the set EMA (Can disable this rule if you'd like in the settings)
- RSI is in Overbought
- ADX is above set "Trend Ready" threshold (Meaning there is a trend going on)
- Price must approve the trend of previous candles. This is bullish for buy entries and bearish for sell entries.
- Enter with stop loss above last swing high with 1:1 or 1.5:1 take profit ratio.
This is my first indicator. Let me know if you want any updates. I am not sure if i can add everything but i'll try nonetheless.
Changed: Signals will check up to 2 candles before if the RSI is below or above the set value to show signal. This is because sometimes the entry signal is right but the response might be a bit late.

Scalping Dips On Trend (by Coinrule)Coinrule's Community is an excellent source of inspiration for our trading strategies.
In these months of Bull Market, our traders opted mostly on buy-the-dips strategies, which resulted in great returns recently. But there has been an element that turned out to be the cause for deep division among the Community.
Is it advisable or not to use a stop-loss during a Bull Market?
This strategy comes with a large stop-loss to offer a safer alternative for those that are not used to trade with a downside protection.
Entry
The strategy buys only when the price is above the Moving Average 50 , making it less risky to buy the dip, which is set to 2%.
The preferred time frame is 1-hour.
The stop-loss is set to be quite loose to increase the chances of closing the trade in profit, yet protecting from unexpected larger drawdowns that could undermine the allocation's liquidity.
Exit
Stop loss: 10%
Take Profit: 3%
In times of Bull Market, such a trading system has a very high percentage of trades closed in profit (ranging between 70% to 80%), which makes it still overall profitable to have a stop-loss three times larger than the take profit.
Pro tip: use a larger stop-loss only when you expect to close in profit most of the trades!
The strategy assumes each order to trade 30% of the available capital and opens a trade at a time. A trading fee of 0.1% is taken into account.


First presented ineficiency indicator - 10 sessions📊 Enhanced FVG Indicator with Multi-Session Support
Overview
The Enhanced FVG (Fair Value Gap) Indicator is a professional-grade tool designed for traders who want to identify and track Fair Value Gaps across multiple trading sessions. This indicator combines advanced FVG detection with smart extension modes, customizable alerts, and automatic instrument calibration.
🎯 What is a Fair Value Gap (FVG)?
A Fair Value Gap occurs when there's a price imbalance in the market, creating a "gap" that the price often revisits. This happens when:
Bullish FVG: The high of candle 2 bars ago is below the low of the current candle
Bearish FVG: The low of candle 2 bars ago is above the high of the current candle
FVGs are powerful supply and demand zones that smart money traders use to identify potential reversal or continuation points.
✨ Key Features
🔟 Multiple Session Support
10 Configurable Sessions: Track FVGs across different time windows throughout the day
Independent Control: Enable/disable each session individually
Custom Session Times: Define your own session hours in any timezone
Unique Colors: Each session has its own customizable color scheme
Session Labels: Clear identification with customizable labels (S1-S10)
🎨 Modern Label System
Text-Only Labels: Clean, modern design without background boxes
9 Position Options: Place labels anywhere on the FVG (Top/Middle/Bottom × Left/Center/Right)
Dynamic Information: Shows session name, direction (↑/↓), and size in points
Adjustable Size: Choose from Tiny, Small, Normal, Large, or Huge text
Custom Colors: Full control over label text color
📏 Smart Extension Modes
1. Follow Current Bar
FVGs dynamically extend to follow the current price action
Configurable bar offset (-50 to +50) to project ahead or stop before current bar
Perfect for real-time trading and keeping your chart clean
2. Until Time
Extend FVGs until a specific time of day (HHMM format)
Ideal for intraday traders with specific market closure times
Example: Stop all FVGs at 1600 (4:00 PM)
3. Until Retest
Automatically stop extending when price retests the FVG
Three sensitivity levels:
Touch: Wick touches the FVG zone
Close Inside: Close price enters the FVG
Full Body Inside: Entire candle body within the FVG
Great for validating FVG fills and trading opportunities
🔔 Advanced Alert System
Creation Alerts: Get notified when a new FVG forms
Format: "FVG Created: S1 ↑ 79pts @ 70339.00-70418.30"
Retest Alerts: One-time alert when price revisits a FVG
Format: "FVG Retested: S1 @ 70380.00"
Configurable: Enable/disable alerts independently
No Spam: Each FVG only triggers one retest alert
🧮 Automatic Point Calculation
The indicator automatically detects your instrument type and calculates FVG size correctly:
Crypto: Bitcoin, Ethereum, Altcoins (÷10 or ÷100)
Forex: All major pairs with correct pip calculation
Futures: ES, NQ, YM, CL, GC with proper point values
Indices: S&P500, NASDAQ, etc. (1 point = 1 point)
Stocks: Penny and dollar stocks (cents calculation)
Manual Override: Option to set custom divisor if needed
🎯 Consequent Encroachment (CE)
Middle Line: Shows the 50% level of each FVG
Customizable Style: Solid, Dashed, or Dotted
Adjustable Thickness: 1-5 pixel width
Custom Color: Match your chart theme
Toggle On/Off: Show or hide as needed
🌍 Timezone Support
4 Major Timezones: America/New_York, UTC, Europe/London, Asia/Tokyo
Session-Based: Define sessions in your preferred timezone
Global Trading: Works for traders anywhere in the world
📋 Default Configuration
Active Sessions (1-5):
Session 1: 09:31-09:49 (Market Open)
Session 2: 09:50-10:30 (Morning Momentum)
Session 3: 10:50-11:10 (Mid-Morning)
Session 4: 11:50-12:10 (Pre-Lunch)
Session 5: 13:30-14:10 (Post-Lunch)
Additional Sessions (6-10): Disabled by default, customize as needed
Colors:
S1: Blue | S2: Purple | S3: Orange | S4: Yellow | S5: Aqua
S6: Green | S7: Red | S8: Fuchsia | S9: Lime | S10: Teal
🚀 How to Use
Basic Setup
Add the indicator to your chart
Select your timezone
Enable desired sessions (1-5 active by default)
Choose your extension mode
Configure alerts if needed
Trading Strategies
Intraday Scalping:
Use "Until Retest" mode with "Touch" sensitivity
Enable alerts for quick entries
Focus on Sessions 1-2 for high volatility
Swing Trading:
Use "Until Time" mode to extend FVGs to market close
Set retest sensitivity to "Close Inside" for confirmation
Track multiple sessions for confluence zones
Smart Money Concepts:
Combine FVGs with order blocks and liquidity zones
Use CE line for partial profit targets
Watch for FVG retests at key support/resistance levels
⚙️ Performance Optimizations
Efficient Rendering: Max 500 boxes, labels, and lines
Historical Limit: Display up to 30 days of FVGs
Memory Management: Inactive FVGs automatically marked
Real-Time Updates: Dynamic extension without lag
📊 Compatible Instruments
✅ Cryptocurrencies (Bitcoin, Ethereum, Altcoins)
✅ Forex Pairs (All majors and crosses)
✅ Futures Contracts (Indices, Commodities, Metals)
✅ Stock Indices (S&P500, NASDAQ, DOW)
✅ Individual Stocks
✅ Any instrument on TradingView
🎓 Understanding FVG Trading
Why FVGs Matter:
Represent inefficient price action
Act as magnets for price retracement
Often mark institutional order flow
High probability reversal zones
Best Practices:
Combine with volume analysis
Use higher timeframe FVGs for stronger zones
Wait for confirmation before entry
Place stops beyond the FVG boundaries
🔧 Customization Options
Visual Settings:
10 session colors
Border color (transparent by default)
CE line color, style, and thickness
Label size, color, and position
Functional Settings:
Extension mode (Follow/Time/Retest)
Bar offset (-50 to +50)
Retest sensitivity (3 levels)
Alert preferences
Calculation Settings:
Auto-detect point divisor
Manual divisor override
Maximum days to display
💡 Tips & Tricks
Reduce Chart Clutter: Disable sessions you don't trade
Session Optimization: Adjust session times to match your market's volatility
Confluence Trading: Enable multiple sessions to find overlapping FVGs
Mobile Trading: Use alerts to trade on-the-go
Backtesting: Increase max days to analyze historical FVG behavior
📝 Version History
v1.0 - Initial Release
10 configurable sessions
3 extension modes
Automatic point calculation
Alert system
Modern label design
Consequent encroachment support
🤝 Support & Feedback
If you find this indicator helpful, please leave a review and share your experience! For questions or feature requests, feel free to comment below.
Happy Trading! 🎯📈

Forex Renko LeaderboardForex Warlord: Kinetic Velocity Leaderboard
This indicator is a specialized dashboard designed to rank the 7 Major Forex pairs based on their real-time "Kinetic Velocity" and acceleration. Unlike standard strength meters that measure relative price change, the Warlord Engine calculates exactly how fast a pair is generating net profits per second, accounting for the "Physics" of the market: drag (spread costs) and inertia (lag).
It is designed specifically for momentum traders who need to know not just which pair is moving, but which pair is moving fast enough to overcome the cost of the spread and generate immediate net return.
HOW IT WORKS
The script runs a "Virtual Renko" simulation on your time-based chart (works best on 1-second or 1-minute timeframes). It tracks price movement in "Bricks" and calculates a standardized "Score" for each pair.
The Score represents "Net Pips per Second."
-- A positive score (> 0.00) means the price is moving fast enough to clear the spread and generate profit.
-- A negative score (< 0.00) means the price is moving too slowly, and the spread cost is eating the volatility.
The system then applies a "Smart Decay" penalty. If a pair is moving fast but starting to decelerate (slowing down), its score is penalized to prevent you from buying the top.
HOW TO USE IT
1. Attach the indicator to any chart (EURUSD, 1-Second or 1-Minute recommended for high-speed scalping).
2. Look at the Dashboard on the right side of the screen.
3. Identify the Rank #1 Pair. This is the currency currently moving with the highest velocity.
4. Check the "Action" Column:
-- TRADE (Green): The pair is Rank #1 AND its velocity is high enough to be profitable.
-- NO TRADE (Red): The pair is moving too slowly, or the spread cost is too high relative to the move.
-- SPREAD > MAX (Red): The calculated move does not clear your specified "Max Broker Cost."
-- NO TRADE (ZONE) (Red): The market is in the "Dead Zone" (typically 17:00-18:00 EST), where spreads widen and liquidity vanishes.
5. Check the "State" Icon:
-- Rocket: The pair is accelerating. This is the ideal entry signal.
-- Warning: The pair is decelerating. Caution is advised as momentum is fading.
ALERTS
The indicator features a built-in alert system. You can create an alert in TradingView to notify you specifically when the "Renko Leaderboard Ranking" changes. This allows you to wait for the market to tell you which pair is taking the lead without staring at the screen.
INPUTS & SETTINGS
-- Renko Brick Size (Pips): The most critical tuning knob. Determines the sensitivity of the engine. Smaller bricks (e.g., 2-3 pips) make it hyper-sensitive for scalping. Larger bricks (e.g., 10 pips) tune it for swing trends. Changing this instantly recalculates the entire board.
-- Max Broker Cost (Pips): Your "Hurdle Rate." If a pair's projected profit does not clear this cost (default 1.0 pip), the dashboard will forbid the trade.
-- Dead Zone Start/End (Hour): Hard-coded risk management. By default, it blocks all signals between 17:00 and 18:00 EST (New York Close) to protect you from high-spread rollover hours.
-- HMA Time Dilation: A smoothing factor to prevent noise on 1-second charts.
DISCLAIMER
This tool is for informational purposes only. It measures past velocity to rank current momentum. Past performance is not indicative of future results. Always verify the actual bid/ask spread on your broker before executing, as the script uses a fixed spread calculation.

DafeLiquidityEngineDafeLiquidityEngine: The Institutional Liquidity & Microstructure Engine
This is not a volume indicator. This is a complete, institutional-grade quantitative laboratory for the analysis of market liquidity. It is a toolkit for seeing the invisible architecture of the order book and trading the cause, not the effect.
█ CHAPTER 1: THE PHILOSOPHY - BEYOND VOLUME, INTO LIQUIDITY
The standard volume bar is a lie. It tells you that the market was active, but it tells you nothing about the quality of that activity. Was it a deep, liquid market that could easily absorb large orders, or a thin, fragile market on the verge of a violent cascade? Was the volume driven by informed, institutional flow, or by reactive, retail panic?
The DafeLiquidityEngine was created to answer these critical questions. This library is not a simple "mashup" of existing indicators; it is a foundational, original work that brings a suite of concepts from academic and institutional quantitative finance directly into the Pine Script environment. Its purpose is to move beyond the one-dimensional view of volume and provide a multi-faceted, high-resolution picture of the market's true, underlying liquidity structure.
b]This is not an indicator that gives buy or sell signals. It is a far more powerful tool: a measurement device. It provides you with the crucial intelligence to assess the quality of the market environment. It tells you when liquidity is deep and signals can be trusted, and when liquidity has vanished and risk is extreme. It is the definitive engine for understanding the hidden structure of the market auction.
█ CHAPTER 2: THE CORE INNOVATIONS - A UNIVERSITY-LEVEL TOOLKIT
This library's value is rooted in its implementation of sophisticated, academically recognized models for liquidity and price impact, many for the first time on this platform.
Multi-Scale Delta Divergence Engine: The engine doesn't just calculate one Cumulative Volume Delta (CVD). It calculates two simultaneously: a fast delta (representing scalpers and retail flow) and a slow delta (representing institutional accumulation/distribution). Its true genius lies in its ability to analyze the divergence between these two flows, classifying the market into one of five distinct states like "Absorption" (institutions absorbing retail selling) or "Stealth" (institutions quietly building a position).
Advanced Bid-Ask Spread Estimation: Without access to Level 2 data, how can you know the spread? This library uses two renowned academic models—the Corwin-Schultz estimator (using high-low data) and the Roll spread estimator (using serial covariance)—to create a high-fidelity proxy for the live bid-ask spread. This is a direct measure of market tightness.
Amihud Illiquidity Ratio: A classic, powerful measure of illiquidity. It calculates the absolute price return per dollar of volume traded. A high Amihud score means that even small amounts of volume are causing large, violent price swings—a clear sign of a dangerously illiquid market.
Kyle's Lambda (Price Impact): This is the professional's measure of market impact. Lambda calculates how much the price moves for every unit of signed order flow. A high Lambda value indicates a "thin" order book where a single large market order can cause a significant price cascade. It is a direct measure of market fragility.
The Volume Clock Engine: This module analyzes the market in "volume time" instead of chronological time. It detects volume "droughts" and "floods," measures the "participation rate" against historical norms, and analyzes the acceleration of volume to determine if a move is gaining or losing institutional support.
The Composite Liquidity Regime: The capstone of the engine. It synthesizes the intelligence from all other modules into a single, unified classification of the market's liquidity state, from "Deep" and "Normal" to "Thin," "Desert," and the dreaded "Frozen." For developers, this provides a simple, powerful output: a risk_multiplier and a signal_penalty to automatically adjust position sizing and signal confidence based on the current liquidity environment.
█ CHAPTER 3: A DEEP DIVE INTO THE ENGINE'S MODULES
This is your guide to the engine room. Each module is a specialized analytical tool.
The DeltaState Module: This is the heart of the divergence engine. It provides you with the raw and Z-scored values for both fast and slow delta, their velocity, and the final divergence classification ("absorption," "exhaustion," etc.) along with a confidence score. This is your primary tool for detecting conflicts between retail and institutional flow.
The SpreadState Module: This gives you a direct, quantitative measure of market tightness. Use the spread_z score to see if the current bid-ask spread is statistically wide or tight, and the spread_regime to know if the market is "Blown" (extremely wide and risky) or "Tight" (liquid and efficient).
The AmihudState & KyleState Modules: These are your professional-grade risk assessment tools. A rising illiquidity_z score from Amihud is a clear warning that the market is becoming fragile. A rising lambda_z from Kyle's Lambda tells you that price impact is increasing, and the risk of a slippage cascade is high.
The VolumeClockState Module: This is your lens into market participation. The vol_clock_regime ("drought," "low," "normal," "elevated," "flood") tells you the character of the current volume, while the vol_trend_strength provides a measure of the momentum of participation.
The LiquidityRegime Module: This is the final, synthesized verdict. It provides a single, easy-to-use regime name ("Flush," "Deep," "Normal," "Thin," "Desert," "Frozen") that encapsulates the combined intelligence of the entire system. Crucially, it also outputs the risk_multiplier and signal_penalty—direct, actionable factors you can use to modulate your own strategy's behavior.
█ CHAPTER 4: THE DEVELOPER'S MASTERCLASS - IMPLEMENTATION GUIDE
The DafeLiquidityEngine is a professional framework designed for seamless integration. This guide provides the complete instructions for leveraging its power.
PART I: THE INPUTS TEMPLATE (THE CONTROL PANEL)
While this is a library, a high-quality indicator built upon it would expose these parameters to the user for fine-tuning. This is the recommended input structure.
// ╔═════════════════════════════════════════════════════════╗
// ║ INPUTS TEMPLATE ║
// ╚═════════════════════════════════════════════════════════╝
// INPUT GROUPS
string G_LIQ_ENGINE = "═══════════ 💧 LIQUIDITY ENGINE ════════════"
string G_LIQ_DELTA = "═══════════ 📊 DELTA & DIVERGENCE ══════════"
string G_LIQ_RISK = "═══════════ ⚖️ RISK & SPREAD ════════════"
// ENGINE CONFIG
int i_liq_fast = input.int(8, "Fast Delta Length", minval=3, maxval=20, group=G_LIQ_ENGINE, tooltip="Lookback for the 'fast' retail/scalper delta.")
int i_liq_slow = input.int(34, "Slow Delta Length", minval=21, maxval=100, group=G_LIQ_ENGINE, tooltip="Lookback for the 'slow' institutional delta.")
int i_liq_zlookback = input.int(50, "Normalization Lookback", minval=20, maxval=200, group=G_LIQ_ENGINE, tooltip="The lookback period for all Z-Score calculations, which makes the metrics adaptive to the asset.")
PART II: THE IMPLEMENTATION LOGIC (THE HEART OF YOUR SCRIPT)
This is the boilerplate code you will adapt to your indicator. It shows the complete lifecycle of creating, updating, and using the engine.
// ╔═════════════════════════════════════════════════════════╗
// ║ USAGE EXAMPLE (ADAPT TO YOUR SCRIPT) ║
// ╚═════════════════════════════════════════════════════════╝
// 1. IMPORT THE LIBRARY
import YourUsername/DafeLiquidityEngine/1 as liq
// 2. INITIALIZE THE ENGINE (happens only on the first bar)
// The 'engine' must be a 'var' to retain its state across bars.
var liq.LiquidityEngine engine = liq.create_engine(i_liq_fast, i_liq_slow, i_liq_zlookback)
// 3. UPDATE THE ENGINE (runs on every bar)
// Feed the current bar's OHLCV data into the engine. It handles all internal calculations.
engine := liq.update(engine, open, high, low, close, volume)
// 4. EXTRACT INTELLIGENCE (runs on every bar)
// Get the final, synthesized output state from the engine.
liq.LiquidityState state = liq.get_state(engine)
// 5. USE THE INTELLIGENCE TO BUILD YOUR LOGIC
// --- Example 1: Creating a Sophisticated Signal Filter ---
bool my_raw_buy_signal = ta.crossover(ta.ema(close, 10), ta.ema(close, 20))
// The liquidity engine provides a simple penalty score. 1.0 = good liquidity, 0.2 = bad liquidity.
float liquidity_penalty = state.signal_penalty
// Only trust the signal if liquidity is good enough.
bool final_buy_signal = my_raw_buy_signal and liquidity_penalty > 0.6
plotshape(final_buy_signal, "Filtered Buy", ...)
// --- Example 2: Dynamic Position Sizing ---
float base_position_size = 10000 // Your base size in dollars
// The engine provides a risk multiplier. 1.0 = normal risk, 0.3 = high risk (reduce size).
float liquidity_risk_multiplier = state.risk_multiplier
float final_position_size = base_position_size * liquidity_risk_multiplier
// Now use 'final_position_size' in your strategy logic.
// --- Example 3: Building a Divergence-Based Strategy ---
if state.divergence_type == "accumulation" and state.divergence_confidence > 0.7
// This is a high-confidence signal that institutions are quietly buying while price is falling.
// A powerful setup for a long entry.
strategy.entry("Accumulation Long", strategy.long)
// --- Example 4: Displaying the State on a Dashboard ---
if barstate.islast
label.new(bar_index, high, "Liquidity Regime: " + state.liq_regime_name +
"\nRisk Multiplier: " + str.tostring(state.risk_multiplier, "#.##") +
"\nDivergence: " + state.divergence_type)
█ DEVELOPMENT PHILOSOPHY
The DafeLiquidityEngine was born from a single, guiding principle: liquidity is the fuel of the market. Price cannot move without it, and its absence or presence dictates the character of every trading session. This library provides, for the first time, a comprehensive, institutional-grade toolkit for quantifying this elusive but critical variable. It is a tool for the serious developer and the quantitative trader who is not satisfied with surface-level analysis, but who seeks to understand the deep, structural mechanics of the market auction.
█ DISCLAIMER & IMPORTANT NOTES
THIS IS A LIBRARY FOR ADVANCED DEVELOPERS: This script does nothing on its own. It is a powerful engine that must be imported and used by other indicator developers to build their own tools.
THIS IS AN ESTIMATION ENGINE: The algorithms used (Corwin-Schultz, Kyle's Lambda, Delta Estimation) are highly respected academic and institutional proxies for true order book data. They are high-fidelity estimates, not a direct feed of Level 2 data.
CONTEXT IS KEY: The output of this engine is contextual intelligence, not direct trading signals. A "Thin" liquidity regime is not a signal to sell; it is a signal to reduce position size, widen stops, and be wary of false breakouts.
Create with DAFE.
