Sideways Scalper Peak and BottomUnderstanding the Indicator
This indicator is designed to identify potential peaks (tops) and bottoms (bottoms) within a market, which can be particularly useful in a sideways or range-bound market where price oscillates between support and resistance levels without a clear trend. Here's how it works:
RSI (Relative Strength Index): Measures the speed and change of price movements to identify overbought (above 70) and oversold (below 30) conditions. In a sideways market, RSI can help signal when the price might be due for a reversal within its range.
Moving Averages (MAs): The Fast MA and Slow MA provide a sense of the short-term and longer-term average price movements. In a sideways market, these can help confirm if the price is at the upper or lower extremes of its range.
Volume Spike: Looks for significant increases in trading volume, which might indicate a stronger move or a potential reversal point when combined with other conditions.
Divergence: RSI divergence occurs when the price makes a new high or low, but the RSI does not, suggesting momentum is weakening, which can be a precursor to a reversal.
How to Use in a Sideways Market
Identify the Range: First, visually identify the upper resistance and lower support levels of the sideways market on your chart. This indicator can help you spot these levels more precisely by signaling potential peaks and bottoms.
Peak Signal :
When to Look: When the price approaches the upper part of the range.
Conditions: The indicator will give a 'Peak' signal when:
RSI is over 70, indicating overbought conditions.
There's bearish divergence (price makes a higher high, but RSI doesn't).
Volume spikes, suggesting strong selling interest.
Price is above both Fast MA and Slow MA, indicating it's at a potentially high point in the range.
Action: This signal suggests that the price might be at or near the top of its range and could reverse downwards. A trader might consider selling or shorting here, expecting the price to move towards the lower part of the range.
Bottom Signal:
When to Look: When the price approaches the lower part of the range.
Conditions: The indicator will give a 'Bottom' signal when:
RSI is below 30, indicating oversold conditions.
There's bullish divergence (price makes a lower low, but RSI doesn't).
Volume spikes, suggesting strong buying interest.
Price is below both Fast MA and Slow MA, indicating it's at a potentially low point in the range.
Action: This signal suggests that the price might be at or near the bottom of its range and could reverse upwards. A trader might consider buying here, expecting the price to move towards the upper part of the range.
Confirmation: In a sideways market, false signals can occur due to the lack of a strong trend. Always look for confirmation:
Volume Confirmation: A significant volume spike can add confidence to the signal.
Price Action: Look for price action like candlestick patterns (e.g., doji, engulfing patterns) that confirm the reversal.
Time Frame: Consider using this indicator on multiple time frames. A signal on a shorter time frame (like 15m or 1h) might be confirmed by similar conditions on a longer time frame (4h or daily).
Risk Management: Since this is designed for scalping in a sideways market:
Set Tight Stop-Losses: Due to the quick nature of reversals in range-bound markets, place stop-losses close to your entry to minimize loss.
Take Profit Levels: Set profit targets near the opposite end of the range or use a trailing stop to capture as much of the move as possible before it reverses again.
Practice: Before trading with real money, practice with this indicator on historical data or in a paper trading environment to understand how it behaves in different sideways market scenarios.
Key Points for New Traders
Patience: Wait for all conditions to align before taking a trade. Sideways markets require patience as the price might hover around these levels for a while.
Not All Signals Are Equal: Sometimes, even with all conditions met, the market might not reverse immediately. Look for additional context or confirmation.
Continuous Learning: Understand that this indicator, like any tool, isn't foolproof. Learn from each trade, whether it's a win or a loss, and adjust your strategy accordingly.
By following these guidelines
Cari dalam skrip untuk "scalping"

Multi Stochastic AlertHello Everyone,
I have created a Multi Stochastic Alert based on Scalping Strategy
The Strategy uses below 4 Stochastic indicator:
1. Stochastic (9,3)
2. Stochastic (14,3)
3. Stochastic (40,4)
4. Stochastic (60,10)
Trade entry become active when all of these goes below 20 or above 80, In this indicator you don't need to use all 4, this will show red and green background whenever all of them goes below 20 or above 80.
As shown in picture below, it works better when script is making a channel, Our indicator shows green or red signal, we wait for RSI Divergence and we enter. We book when blue line (9,3) goes above 80, as shown by arrow, and trail rest at breakeven or your own trailing method
Same Situation shown for Short side. We book 50% when Blue line (9,3) Goes below 20 and trail rest at breakeven or your own trailing method
Happy trading, Let me know if any improvements required.

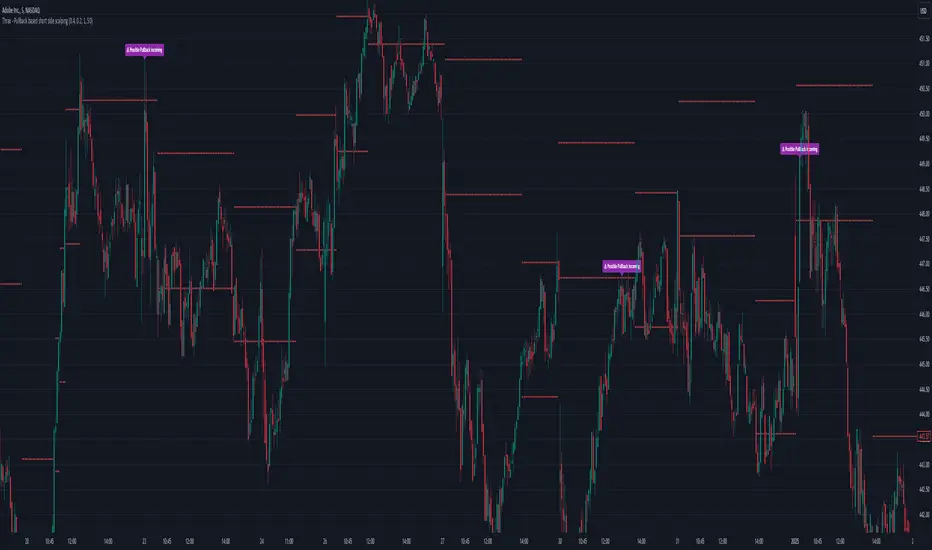
Thrax - Pullback based short side scalping⯁ This indicator is built for short trades only.
⤞ Pullback based scalping is a strategy where a trader anticipates a pullback and makes a quick scalp in this pullback. This strategy usually works in a ranging market as probability of pullbacks occurrence in ranging market is quite high.
⤞ The strategy is built by first determining a possible candidate price levels having high chance of pullbacks. This is determined by finding out multiple rejection point and creating a zone around this price. A rejection is considered to be valid only if it comes to this zone after going down by a minimum pullback percentage. Once the price has gone down by this minimum pullback percentage multiple times and reaches the zone again chances of pullback goes high and an indication on chart for the same is given.
⯁ Inputs
⤞ Zone-Top : This input parameter determines the upper range for the price zone.
⤞ Zone bottom : This input parameter determines the lower range for price zone.
⤞ Minimum Pullback : This input parameter determines the minimum pullback percentage required for valid rejection. Below is the recommended settings
⤞ Lookback : lookback period before resetting all the variables
⬦Below is the recommended settings across timeframes
⤞ 15-min : lookback – 24, Pullback – 2, Zone Top Size %– 0.4, Zone Bottom Size % – 0.2
⤞ 5-min : lookback – 50, pullback – 1% - 1.5%, Zone Top Size %– 0.4, Zone Bottom Size % – 0.2
⤞ 1-min : lookback – 100, pullback – 1%, Zone Top Size %– 0.4, Zone Bottom Size % – 0.2
⤞ Anything > 30-min : lookback – 11, pullback – 3%, Zone Top Size %– 0.4, Zone Bottom Size % – 0.2
✵ This indicator gives early pullback detection which can be used in below ways
1. To take short trades in the pullback.
2. To use this to exit an existing position in the next few candles as pullback may be incoming.
📌 Kindly note, it’s not necessary that pullback will happen at the exact point given on the chart. Instead, the indictor gives you early signals for the pullback
⯁ Trade Steup
1. Wait for pullback signal to occur on the chart.
2. Once the pullback warning has been displayed on the chart, you can either straight away enter the short position or wait for next 2-4 candles for initial sign of actual pullback to occurrence.
3. Once you have initiated short trade, since this is pullback-based strategy, a quick scalp should be made and closed as price may resume it’s original direction. If you have risk appetite you can stay in the trade longer and trial the stops if price keeps pulling back.
4. You can zone top as your stop, usually zone top + some% should be used as stop where ‘some %’ is based on your risk appetite.
5. It’s important to note that this indicator gives early sings of pullback so you may actually wait for 2-3 candles post ‘Pullback warning’ occurs on the chart before entering short trade.
Pip hunter 1-Minute Scalping Strategy [manesisnet]NOTE: This is my first attempt to write an indicator using pine script and it's not recommended for serious trading, just use it for your own research or feel free to create your own versions based on the below.
Overview: The "1-Minute Scalping Strategy" is a custom TradingView indicator designed for short-term traders looking to capitalize on quick price movements in the 1-minute timeframe. This strategy combines moving averages and the Relative Strength Index (RSI) to generate buy and sell signals while filtering out potential false entries by confirming trends on a higher timeframe.
How It Works:
Moving Averages:
The indicator uses two Simple Moving Averages (SMAs):
A fast SMA (5-period) for short-term price movements.
A slow SMA (20-period) to identify the overall trend.
Buy signals are generated when the fast SMA crosses above the slow SMA, indicating bullish momentum.
Sell signals occur when the fast SMA crosses below the slow SMA, indicating bearish momentum.
Higher Time Frame Confirmation:
To enhance the accuracy of the signals, the strategy checks the trend on a higher timeframe (default is 5 minutes).
A buy signal is only valid if the current price is above the higher timeframe SMA, confirming that the overall trend is bullish.
A sell signal is only valid if the current price is below the higher timeframe SMA, confirming a bearish trend.
This confirmation helps avoid false breakouts and ensures that trades are aligned with the prevailing market direction.
Relative Strength Index (RSI):
The RSI is used to assess market momentum and potential reversal points.
The indicator calculates a 14-period RSI to identify overbought and oversold conditions.
For buy signals, the RSI must be below 60 (indicating the market is not overbought).
For sell signals, the RSI must be above 40 (indicating the market is not oversold).
This helps to filter out trades that might occur during extreme market conditions.
Visual Representation:
The fast SMA (5-period) is plotted in blue, the slow SMA (20-period) in red, and the higher timeframe SMA in orange.
Buy signals are indicated with a green label below the bar, while sell signals are indicated with a red label above the bar.
This visual representation allows traders to quickly identify potential entry points.
Alerts:
The script includes alert conditions for buy and sell signals, enabling traders to receive notifications when the conditions for entering trades are met.

[FXAN] 71 Cygni Algorithm (Scalping)⚜️ FXAN CYGNI INDICATORS ORIGINALITY
Originality comes from proprietary formula we use to measure the relationship between Volume and Price Volatility in relation to overall current market positioning in developing Volume Profile and multiple custom period Volume Profiles. We combine that with our own approach to measure price velocity in correlation to average daily/weekly/monthly ranges of the given market.
The relationship between current volume and price volatility gives us information about how much the volume that is currently coming into the market affects the price movement (volatility) and which side is more dominant/involved in the market (Buyers/Sellers). We call this the "Volume Impact" factor.
This information is then compared in relation to the overall current market positioning in developing Volume Profile and Multiple custom period Volume Profiles. We have created a rating system based on current price positioning in relation to the Volume Profile. Volume profile consists of different volume nodes, high volume nodes where we consider market interest to be high (a lot of transactions - High Volume) and low volume nodes where we consider market interest to be low (not a lot of transactions - Low Volume). We call this the current "Market Interest" factor.
We combine this information with our own approach to measure price velocity in correlation to the higher-timeframe price ranges. Calculation is done by measuring current ranges of market movement in correlation to average daily/weekly/monthly ranges. We call this "Price Velocity" factor.
This approach was applied to develop key components of our Tradingview Indicators, we've simplified some of the calculations and made them easy to use by programming them to display buying/selling volume pressure with colors.
In addition to our own proprietary formulas and criterias to measure volume impact on price, we've also used an array of indicators that measure the percentage change in volume over custom specified periods of time, including custom period ranged Volume Profile, Developing VA, Accumulation/Distribution (A/D Line), Volume Rate of Change (VROC), Volume Price Trend (VPT) - all of them with of course fine-tuned settings to fit the purpose in the overall calculation.
Reasons for multiple indicator use:
Custom period ranged Volume Profiles: To determine current interest of market participants. Used for "Market Interest"
Developing VA: To determine current fair price of the market (value area). Used for "Market Interest".
Accumulation/Distribution (A/D Line): Helping to gauge the strength of buying and selling pressure. Used for "Volume Impact"
Volume Rate of Change (VROC): To give us information about percentage change in volume. Used for "Volume Impact"
Volume Price Trend (VPT): To help identify potential trends. Used for "Volume Impact".
Average True Range (ATR): Used for measuring volatility. Used for "Volume Impact" and "Price Velocity".
Average Daily Range (ADR): Used for measuring average market price movement. Used for "Price Velocity".
How it all works together:
"Volume Impact" factor tells us the influence of incoming market volume on price movement. This information alongside the overall market positioning information derived from "Market Interest" factor combined with information about speed and direction relative to higher-timeframe price ranges frin "Price Velocity.
This is the basis of our proprietary developed Volume Dynamics analysis approach
"Volume Impact" x "Market Interest" x "Price Velocity"
Combining this factors together gives a good overall understanding of which side is currently more involved in the market to gauge the direction ("Volume Impact"), where the market is currently positioned to gauge the context ("Market Interest") and what the current market's momentum to improve the timing of our trades ("Price Velocity"). This increases our probabilities for successful trades, executed with good timing.
To simplify - our indicators will always analyze the volume behind every price movement and rate those movements based on the relationship between movement distance and volume behind it through an array of criterias and rate them.
Colors displayed by the indicators will be a result of that, suggesting which side of the market (Buyers or sellers) is currently more involved in the market, aiming to increase the probabilities for profitable trades. With the help of our indicators you have deep volume analysis behind price movements done without looking at anything else then indicator components.
🔷 OVERVIEW
Cygni 71 Algorithm is a TradingView indicator designed for short-term trading (scalping) and enhancing the precision of your entries/exits based on a higher timeframe market context. It analyzes the underlying volume behind market movements and colors the candles with the help of the Heiken-Ashi methodology to provide a clearer perspective on the market's potential direction and intentions.
🔷 KEY FEATURES
▊ Candle Coloring
▊ Upper Colored Bar
▊ Lower Colored Bar
🔷 HOW DOES IT WORK?
□ Candles will color in reference to the Heiken ashi "average bar" methodology, which uses a modified formula based on two-period averages. This way, you can observe the normal candlesticks with less noise as colors will suggest the most likely direction where the market might be heading.
□ Upper Colored Bar analyzes daily volume dynamics in the market's price action by referencing the daily average price weighted by volume. If the market is bullish, you’ll see the green bars, and if the market is bearish, the bars will color red.
□ Lower Colored Bar analyzes volume dynamics and the market's price action every few second and minute intervals by referencing average price weighted by volume. This makes it much more sensitive than the Upper Colored Bar. If the market is bullish, you’ll see the green bars, and if the market is bearish, the bars will color red.
🔷 HOW TO USE IT?
□ In general, we look for areas where all components are in sync. These are valid trading signals (refer to the usage example below).
□ If all components are not in sync, we should look for at least two of them to be in sync while one of them must be Upper Colored Bar.
□ Candle Colors: Looking for longs when the candles are green and looking for shorts when the colors are red
□ Upper Colored Bar: The most important component of this indicator is that we favor trading in the direction suggested by this component. Additional confirmation of other components is a bonus. The green color suggests a bullish market, trading long. Red color suggests bearish market, trading short.
□ Lower Colored Bar: This should not be used on its own but always combined with at least one of the other components due to its sensitivity. Colors are indicating longs when green and shorts when red.
🔷 COMBINING THE COMPONENTS
Each component of the indicator serves it's own purpose and analyzes the market from it's own perspective and with its own custom settings and formulas. The calculation of the individual component is done independently from other components. Once all of them align, we're able to execute trades with an edge as it signals that different aspects of volume and price analysis line up for the trading opportunity.
- Candle Colors are used for improving the timing of your entries/exits based on market structure
- Upper Colored Bar is used for determining the favorable direction of the market based on Daily Volume Dynamics.
- Lower Colored Bar used for determining the favorable direction of the market based on Second/Minute/3-minute Volume Dynamics.
It's important to combine the components to increase the probability of success - here's how you should look for a trade:
1. Assess the current most favorable market direction by referencing the Upper Colored bar, look for longs if it’s green and for shorts if it’s red
2. Look for the Candle Colors to align with the Upper Colored bar, look for longs if it’s green and for shorts if it’s red
3. Look for short-time frame volume dynamics to align with your entries, by referencing the Lower Colored Bar - look for longs if it’s green and for shorts if it’s red.
A valid example of the trade would be:
- Upper Colored Bar is green, indicating the favorable trading directions is long
- Lower Colored Bar is green, indicating the favorable trading directions is long
- Candle Colors are green, indicating the market structure is favorable to enter your positions
📊 USAGE EXAMPLE

Volume Footprint Voids [BigBeluga]Volume Footprint Voids is a unique tool that uses lower timeframe calculation to plot different styles of single candle POC.
This indicator is very powerful for scalping and finding very precise entry and exits, spotting potential trapped traders, and more.
Unlike many other volume profiles, this aims to plot single candle profiles as well as their own footprints.
🔶 FEATURES
The script includes the following settings:
Windows: Plotting style and calculations
Coloring modes
Display modes
lower-timeframe calculations
🔶 CALCULATION
In the image above we can see how the script calculates each level position that will serve as a calculation process to see how much volume/closes there are within the levels.
In the image above, we can have a more clear example of how we count each candle close.
We use the prior screenshot as an example, after setting each level we will use the lower-timeframe input to measure the amount of closes within the ranges.
Depending on the lot size, the box will be larger or smaller, usually the POC will always have the highest box size.
NOTE: Size is the starting point, always from the low of the candle.
To find more voids, select a closer LTF to the current one you're using.
To find fewer voids, select a timeframe away from your current one.
Due to Pine Script limitations, we are only able to plot a certain amount of footprints, and we can't plot the whole history chart.
POC will be the largest block displayed, indicating the time point of control
Gray areas are closes above the average
Black are Void or imbalance that price will fill in the future, like FVG
The image above shows an incorrect size input that will lead to bad calculations, while on the other side, a correct size input that will lead to a clear vision and better calculation.
🔶 WINDOWS
The "▲▼" Mode will display delta buyers and delta sellers coloring with voids as black.
It also offers a gradient mode for a beautier visualization
The "Total Volume" mode will display the net volume within the lot size (closes within the levels).
This is useful to spot possible highest net volume within the same highest lot size.
The "POC + Gaps" will show both POC and Gaps as the highest block while all the rest will be considered as the smaller block.
This is useful to see where the highest lot were and if there are higher or lower imbalances within the candle
The last option "Gaps" will simply display the gaps as the highest block, while the POC as the lowest block.
This is useful to have a better view of the gaps areas
🔶 EXAMPLE
This is one of the most basic examples of how this script can be used. POC at the bottom creating a strong support area as price holds and creates higher voids gap that price fills while rising.
🔶 SETTINGS
Users have full control over the script, from colors to choosing the lower-timeframe inputs to disabling the lot size.

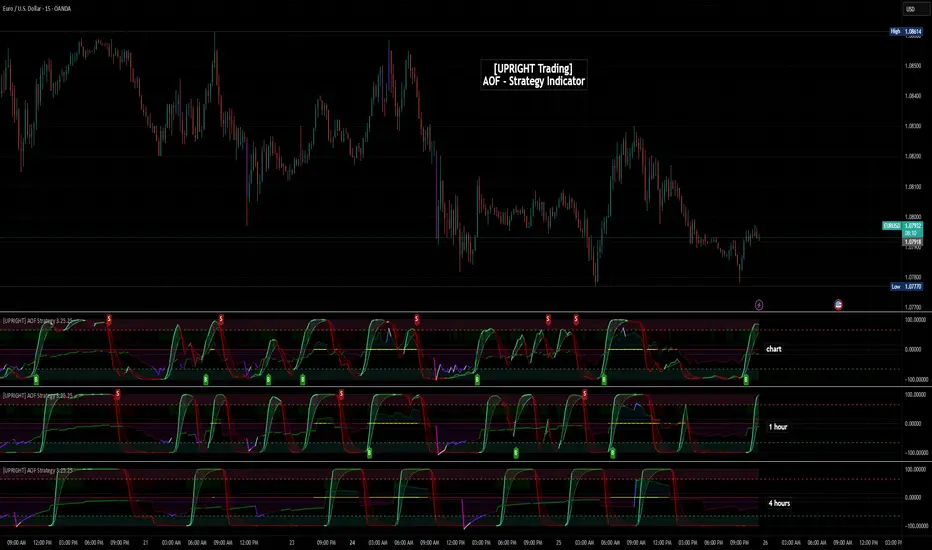
[UPRIGHT Trading] Academy of Forex - Scalp Strategy█ OVERVIEW
This is a collaboration of efforts of The Academy of Forex and UPRIGHT Trading .
The Academy of Forex - Scalp Strategy Indicator is a clean & reimagined lower indicator. To enable optimization & potential automation, we re-coded & optimized it at UPRIGHT Trading.
It is based on the one presented on its YT channel.
The idea is for it to be an easy to use - simple indicator - that works not just for confirmation, but also entering and exiting quickly (scalping).
█ CONCEPTS
The idea is that %B (derived from BBs) is able to pick up some pretty significant moves. With that as one of the bases the Inverse Fisher Transform (Ribbon) acts to show some of the movement of the asset highlighting when it at extremes. The RSI highlights are there as another confirmation to help normalize the sometimes too frequent movement of %B.
As expected the indicator often acts as a reversal indicator, but with the optimizations of logic it's able to pick up more than just the reversals and works as a pretty decent Buy/Sell Algorithm.
█ CALCULATIONS
Calculations used included, but not limited to:
- %B - Quantifies the price as a percentage to the Upper and Lower Band of the Popular Bollinger Bands, which were named after their inventor John Bollinger in 1980.
- Inverse Fisher Transform RSI - is a variation of the IFT, created by John Ehlers, the idea is for the IFT to convert Gaussian normal distribution and to take it a step further the RSI version is to just use overbought and oversold placements. This indicator is meant to highlight when price has moved to an extreme and in this process helps to spot turning points.
- Relative Strength Index (RSI) - As most of you know already the RSI is a technical analysis tool invented by J. Welles Wilder, that oscillates and is used to measure the momentum of price changes. It normalizes to index 0-100 with overbought and oversold defined by the user, but often around 70 as overbought and 30 as oversold.
- Pivot/Swing Points - Implemented to show recent Higher-Highs or Lower-Lows, Pivot points are included in the indicator for structure tracking.
- Moving Averages - Moving averages help to get an idea of when price is moving near the norm or outside to extremes.
█ FEATURES
Indicator Features:
-2 Buy/Sell Signals.
-U Signals (UPRIGHT optimized).
-Exit Reminders.
-Alerts allowing Automation of Scalp Strategy.
-H/L Swings.
-Color Customization.
-Clean Mode.
-Inverse Fisher Transform Ribbon.
-RSI Bullish/Bearish Highlights.
-Options for More Signals (including: Oversold/Overbought Circles, %B Bull/Bear Squares and Triangles, and IFT Highlights).
Showing some of the signals close up.
Should look like this:
Enjoy!
Sincerely,
Mike
Bank Nifty ScalpingThis indicator is designed for scalping purposes.
Users have the option to input the desired source and enable or disable the following indicators:
Multiple EMA (Exponential moving average)
Simultaneously displays multiple moving averages to quickly identify shifts in momentum and obtain confirmation from slower-moving averages.
By default, the EMA display settings are configured to show the 20-day EMA and the 200-day EMA. However, users have the flexibility to modify the display settings according to their preferences. This means that users can customize the indicator to show the EMA values of their choice, such as EMA 50 and EMA 100.
VWAP ( Volume weighted average price )
Default value is set to ‘hl2’
A bullish trend is indicated when the price is above the Volume Weighted Average Price (VWAP), while a bearish trend is indicated when the price is below the VWAP.
VWMA ( Volume weighted moving average )
In the VWMA (Volume Weighted Moving Average) indicator, a default value of 20 is used. If the price is higher than the VWMA, it typically indicates a bullish trend. Conversely, if the price is lower than the VWMA, it suggests a bearish trend. The VWMA takes into account both price and volume, providing a weighted average that can help identify shifts in market sentiment.
Multiple SuperTrends
Default value is 10 and 2 / 10 and 3
A bullish trend is identified when the price is above the SuperTrend indicator, whereas a bearish trend is observed when the price is below the SuperTrend indicator.
Camarilla Pivot Points (Level 3 and 4 only)
Levels 3 and 4 serve as crucial support and resistance levels, acting as the final line of defense against strong trends. These levels are expected to generate reversals, where price often changes direction.
CPR ( Central Pivot Points)
The Daily Central Pivot Point Indicator is a popular tool used in technical analysis. It calculates several levels based on the previous day's high, low, and closing prices.
Strong Volume
The user has the ability to set the average volume for Nifty and BankNifty indices to calculate strong volume.
Elder Impulse System
The Impulse System, developed by Alexander Elder and discussed in his book "New Trading for a Living," is a censorship trading system designed to determine whether a trade should be allowed or prohibited. Additionally, it can be used to identify when a trend is starting to weaken. The Impulse System relies on the following factors:
1. Slope of a Fast Exponential Moving Average (EMA): The fast EMA's slope reflects the price's inertia or momentum.
2. Slope of the Moving Average Convergence Divergence (MACD): The MACD's slope indicates the strength or power of the price movement.
Based on these factors, the Impulse System categorizes candles or price bars into three colors:
* Green Candle: When both the fast EMA and MACD are rising, indicating upward momentum.
* Red Candle: When both the fast EMA and MACD are declining, suggesting downward momentum.
* Blue Candle: In all other cases where the conditions for green or red candles are not met, representing a neutral or uncertain market condition.
By applying the Impulse System, traders can gain insights into the market trend, its strength, and potential shifts in momentum, helping them make informed trading decisions.
Happy Trading

3 Fib EMAs To Scalp Them AllThe "3 Fib EMAs To Scalp Them All" was made in order to clear up when we should look for shorts, longs, or walk away. Also it can alert you when a trend starts, or when there is a possible reversal. I use it for scalping/day trading in 5m-1h timeframes.
1. EMAs: By default, the indicator uses Fibonacci numbers (21, 55, 233), but you can change them.
2. Color Changes: The color of the Micro EMA line changes depending on its relation to the Mid and Macro EMAs.
When Micro EMA < Mid < Macro EMA, it turns red, indicating a potential bearish trend - that's when you should look for shorts
When Micro EMA > Mid > Macro EMA, it turns green, indicating a potential bullish trend - that's when you should look for longs
A white Micro EMA is when you need to take some rest, enjoy your coffee, and avoid overtrading.
3. Signals: The indicator provides visual signals in the form of diamonds and crosses and corresponding alert signals.
A red diamond above the bar signals a potential beginning of a downtrend
A red cross above the bar signals the end of the downtrend and can be used as a signal for a possible reversal up/breakout.
A green diamond below the bar signals a potential beginning of a downtrend,
A green cross below the bar signals the end of the uptrend and can be used as a signal for a possible reversal down/breakout.
4. Alerts: For algo traders and people who prefer to stay away from the monitor... there are alerts for every signal.
Friendly note: Don't blindly follow the signals for your long and short entries. The signals only pop up when the EMA cross value gets a confirmation. A smart move would be to wait for a retracement to the EMA line and use momentum indicators like market cipher B to pinpoint those ideal entry points.

Exhaustion Improved Scalping Consolidation and Squeeze IndicatorThis custom indicator, called " Exhaustion & Improved Scalping Consolidation and Squeeze Indicator," is designed to help traders identify potential trading opportunities in the context of price consolidations, squeezes, and momentum exhaustion. It is an overlay indicator that combines several popular technical analysis tools, including the Relative Strength Index (RSI), Moving Average Convergence Divergence (MACD), Bollinger Bands, Keltner Channels, and Rate of Change (ROC). By analyzing these metrics, the indicator aims to provide visual cues on price charts to support better decision-making in the markets.
Use Case for Trading:
Consolidation Detection: The indicator identifies periods of price consolidation, which typically occur when a market is experiencing low volatility and trading in a narrow range. During these periods, the RSI value is between 45 and 55, the MACD histogram is close to zero, and the ROC value is low. The indicator highlights these consolidation periods by coloring the price bars yellow. Traders can use this information to anticipate potential breakouts and prepare for a possible trend initiation.
Squeeze Detection: The indicator detects squeezes by comparing the Bollinger Bands and Keltner Channels. A squeeze occurs when the Bollinger Bands are within the Keltner Channels, indicating that price volatility is decreasing. The indicator colors the price bars orange during a squeeze, which can be a signal for traders to watch for an upcoming increase in volatility and potential trend expansion.
Momentum Exhaustion Detection: The indicator identifies exhaustion in momentum by analyzing the RSI and MACD histogram. When the RSI is above 70, indicating overbought conditions, and the MACD histogram is decreasing, it may signal that the current upward momentum is losing strength. The indicator colors the price bars white in these situations. Traders can use this information to potentially exit long positions or prepare for a trend reversal.

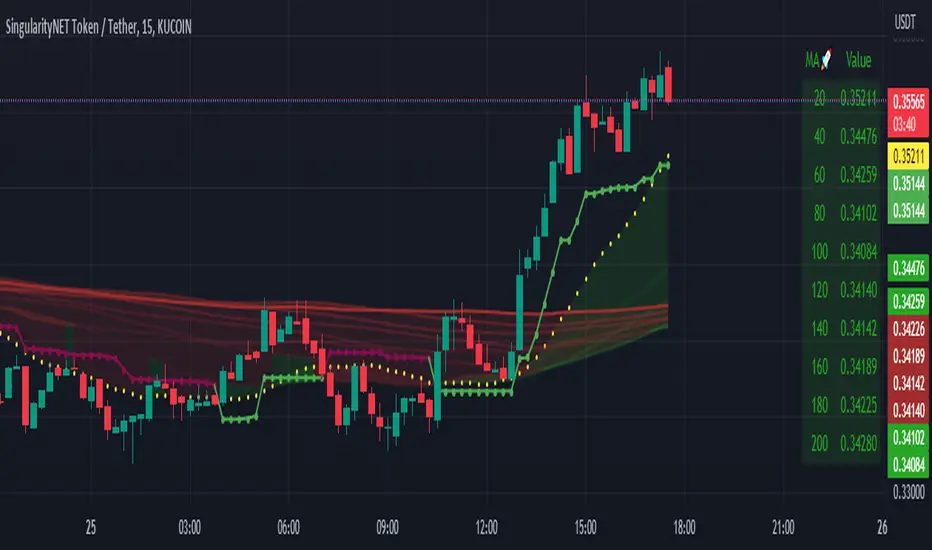
Moving Average Scalper by nnamdertWhat does this Indicator Do?
By request and popular demand, I have created a quick and easy Moving Average Crossover Scalper Indicator. This indicator simply allows the trader to visualize scalping opportunities in an easy way using MA crossovers.
The Indicator also plots multiple higher moving averages via an "optional" table. The table gives a quick glance at the overall trend (based on moving Averages alone).
Users can adjust the initial Moving Average Length and the number of additional Moving Average Lengths to be plotted on the chart.
How do I use it?
As shown below, the cross overs are very easy to see. The Stoploss "should" be set at the most recent swing high or low prior to the MA Cross.
The dotted yellow line must cross above or below the thick mutli-colored line in order to be considered valid.
As seen in the screenshot below, an optional input setting turns ON / OFF additional Moving Average "Lines" and plots them on the chart. In addition, the indicator color fills between the moving averages based on Bullish or Bearish movement. If the lines are in continuity, then the color will be either RED or GREEN depending on the market sentiment (bull or bear).
The total number of Moving Averages listed in the table can be manually adjusted in the settings by the user. The table is small and see-through so it works on mobile devices as well and allows the user to still see the candles easily. Simply double clicking on the table will bring up the settings.
As shown below, the table can be relocated to a position acceptable to the user if it is in the way. This option is available under input settings.
I hope this indicator proves useful for you and your trading style. If you have any suggestions please let me know.
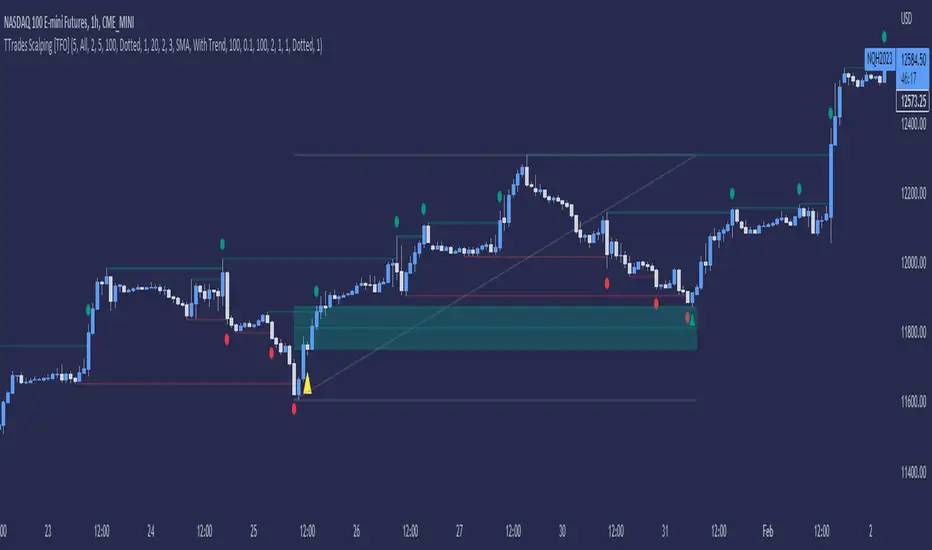
TTrades Scalping Indicator [TFO]Specialized for the scalping strategy of TTrades, this indicator focuses on inducement / stop hunt setups, utilizing additional factors such as volume spikes and trend bias to filter out setups that don’t fit the user-defined criteria.
The idea is that price is always seeking liquidity by reaching for trivial pivots where traders may put their stop loss orders. When price seeks these levels and stops these traders out, we may observe an influx of volume due to the large number of shares/contracts being exchanged given the large number of traders that have similar orders.
If price quickly comes back into the original range, we may determine this to be a stop hunt or a fakeout, only for price to proceed in the opposing direction. If it continues running and creates a displacement leg, we look to capitalize on that movement by tracking the Optimal Trade Entry (62 - 79% retracement), anchored to the swing pivot created as a result of the stop hunt.
Aside from volume, we can also use existing technical indicators like VWAP and SMA’s to ensure we’re only taking trades with the current trend (or against it). Simple criteria like this can help keep us out of low probability market environments.
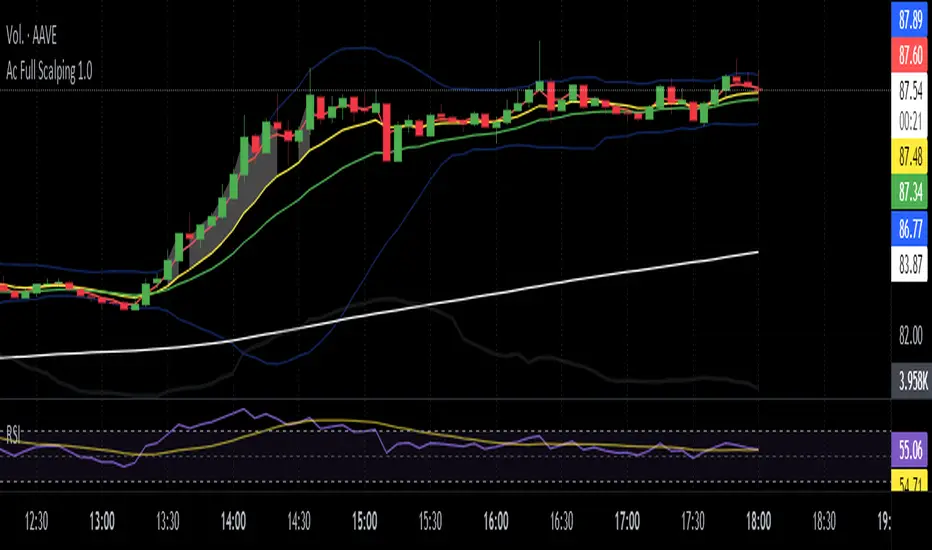
Ac Full Scalping 1.0These unified indicators are used for a 5-minute scalping strategy.
We regularly look for the RSI to be overbought and the price to be outside the bollinger bands as the main analysis.
This serves as a search protocol, to then analyze the price action by visually assisting us with 4 exponential moving averages to see wear or breakout of a move.
It also adds the distance from the price close to the 10-period exponential moving average, developed in two modes where you can mark a background color where the event occurs, or you can choose a shadow that is drawn from the exponential moving average to the closing price.
These two modes can be activated or deactivated so that each person can choose the most visually comfortable way to observe that distance, it is recommended to use one at a time and not both at the same time.
The distance indicator can also be used to change the distance percentage. The percentage as a minimum value admits 0.50%, but it is recommended to use it above 0.80% to make the analysis more effective.
People can also change colors of exponential moving averages, but it is not recommended, and the period cannot be changed to keep the analysis more specific.
The RSI indicator should be added separately, as it is used to see overbought values and divergences.
The other indicators are unified but can be turned on or off for better analysis.
As a summary, what is sought with this type of unified indicators is the attrition, break or retracement in 5-minute time frame to open only short trades.
Dual Bollinger Band Mean ReversionSimple but solid mean reversion indicator with sl and tp levels. Most of the code is based on the built in bollinger bands script. Designed for scalping 1-5 minute timeframes.
The indicator consists of two sets of bollinger bands.
Price has to close below the lower (fast) bollinger band, above the moving average of the (slower) bollinger band.
If price now closes above the lower (fast) bb, the indicator draws a label at the open of the next candle (which would be a potential entry point). Take profit becomes the upper bollinger band, stop loss the same distance below the open of the candle.
I've built in a simple backtesting function that calculates the potential win/loss-ratio. Loss and profit levels are 1:1. Exit strategy could be improved on.
Adjusting the lengths depending on the asset proves to be a good idea.
The slower bollinger bands can help to identify ranging markets and/or trends following regular bollinger bands theory.
Feel free to comment with any changes that you'd like to be made.

Entry helperHello traders,
This is a script I use daily as a scalper and it helps me a lot, maybe it can help you, this is why I am sharing it!
PART 1 - DESCRIPTION
This program is specifically designed to help scalpers but can be used for all types of trading but won't be as useful.
This script is what I call an entry helper as it calculates dynamically the position size, stop loss and take profit levels and more.
When scalping and placing market entry orders, the price can move significantely while you are calculating your position size according to your stop loss, capital, risk and especially close price that changes very quickly, this results in a risk that is not ideally controlled and personally was a source of frustration and stress. I wanted to enter my quantity and stop loss values as fast as possible and make the process easier.
This script automates the calculation of the position size, stop loss and take profit levels according the the users input and prints the data visibly on the screen so it is easy to copy by the trader. It allows the trader to be confident that his risk is as controlled as possible.
The script is easy to use and set up, this guide will help you if you have any difficulies or questions.
PART 2 - HOW TO USE THE SCRIPT
- SET THE CAPITAL SETTINGS
1 - Set your capital value in $
- SET THE TRADE SETTINGS
2 - Set your trade side (BUY or SELL)
3 - Set you desired risk in % of your capital
- ENTRY SETTINGS
4 - Set your entry from 2 different options
|MARKET| (default option)
This option will place the entry level at the last available price
|LIMIT|
This option allows you to input a fixed price level for the entry
- STOP LOSS SETTINGS
5 - Select your stop loss placement from 4 different options
|EXTREMA STOP LOSS| (default option)
This option will place the stop loss at the highest/lowest (extrema) price level within the last N candles
|ATR EXTREMA|
This option uses the same price level as the EXTREMA STOP LOSS but will add/soustract the last ATR value (calculated on the N last candles) multiplied by a coefficient that you input
|TICKS EXTREMA|
This option uses the same price level as the EXTREMA STOP LOSS but will add/soustract a number of ticks that you input
|PRICE LEVEL|
This option allows you to input a fixed price level for the stop loss
- TAKE PROFIT SETTINGS
6 - Select your take profit from 3 different options
|NONE| (default option)
This option will not display any take profit level, I have added this option as I don't have take profit targets
|RR|
This option uses a risk to reward ratio (reward/risk) that you input, it will automatically calculate the take profit level that corresponds
|PRICE LEVEL|
This option allows you to input a fixed price level for the take profit
- QUANTITY AND FEE SETTINGS
7 - Set the quantity settings, it represents the quantity in a lot (usually 100 000 in forex, 100 in stocks 1 for crypto currencies)
8 - Set the fee per quantity (turning lot)
- VISUAL SETTINGS
9 - Show or remove the tab
- TAB SETTINGS
10 - Select the data that you want to display in the tab (the tab will adapt automatically)
NOTES:
The vertical dashed line shows what candle has been used for the calculation of the stop loss, it allows you to visualize what candle the script has selected in case of an EXTREMA stop loss option.
I hope this helps you out! Any suggestions are welcome and I hope that the guide is clear enough.
Happy trading!

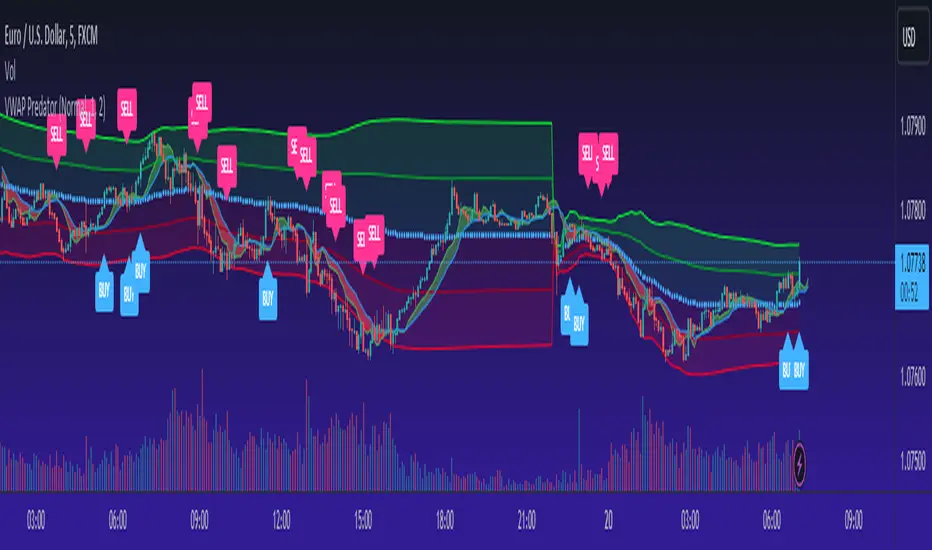
VWAP PredatorUsing VWAP as a start point, the VWAP Predator uses proprietary Fibonacci bands to help determine signal criteria. Most traders use VWAP in a simple way to determine whether an instrument is in a bearish or bullish state, but that doesn't help choosing the correct time to go long or short.
The xBat VWAP Predator uses behavioural analysis with volume, price action with open and close proximities to the Fibonacci bands/zones (Fib Zones). The following describes how the xBrat VWAP Predator is different to any standard use of Volume Weighted Average Price and uses xBrat Proprietary Behavioural logic to determine high probability long and Short signals. All of this heavy lifting and logic is done behind the scenes, keeping traders charts clean.
Long Trading Signals - Candle Coloured in Blue - There are many states with the logic to produce these signals, which are briefly described below:
1. The only standard criteria here - The price action must be above the VWAP Line
2. The Price must open below the boundary of one Fib Zone and close into the next Fib Zone
3. That Same Candle has to be an Accumulation Candle (more volume than the preceding candle and More Buyers) - This is determined with our proprietary logic coding
4. The Same signal candle also has to be higher than average volume. Again, our proprietary xBrat Logic just doesn't look back over a set number of bars, it looks at times of day and day of week, plus more to determine a true valuation of higher, lower or equal to average volume.
5. Only when these states are met, plus two more ema proximity logic, Does the xBrat VWAP predator give a Long Signal.
6. Trade Management is either set targets or indeed a simple ema cross which we provide as a ribbon on the chart to help traders. These ema's are different to entry logic. When the Ribbon turns from green to red, the trader should consider exiting the trade
Short Trading Signals - Candle Coloured in Pink - There are many states with the logic to produce these signals, which are briefly described below:
1. The only standard criteria here - The price action must be below the VWAP Line
2. The Price must open above the boundary of one Fib Zone and close into the next Fib Zone
3. That Same Candle has to be a Distribution Candle (more volume than the preceding candle and More Sellers) - This is determined with our proprietary logic coding
4. The Same signal candle also has to be higher than average volume. Again, our proprietary xBrat Logic just doesn't look back over a set number of bars, it looks at times of day and day of week, plus more to determine a true valuation of higher, lower or equal to average volume.
5. Only when these states are met, plus two more ema proximity logic, Does the xBrat VWAP predator give a Short Signal.
6. Trade Management is either set targets or indeed a simple ema cross which we provide as a ribbon on the chart to help traders. These ema's are different to entry logic. When the Ribbon turns from red to green, the trader should consider exiting the trade.
VWAP Predator is a day trading and scalping signals trading indicator.
Chrtpnk LTF Pullback ScalperINTRODUCTION
I am happy to present the system which I am using for intraday scalps. I have developed this system for my own using, and it has started out as a mere productivity tool. Since I am using more timeframes for the calibration of my scalp entries, I needed a clean, color-based chart tool that relieves me from watching several timeframes simultaneously.
The system has been optimized for entries on the 15-minute chart, providing calibration by following the 1-hour and 4-hour charts in the background.
In this trend following momentum pullback scalping system we are following the trend structure, the multi-timeframe momentum, and we can also add the Stochastic RSI to properly time our entries. Below please find details.
TREND STRUCTURE
The overall trend on our trading timeframe is shown with the assistance of three weighted moving average levels. In line with general MA trading principles, we are looking for the proper alignment of the MA levels, and a correlating price action with our trade. Whenever the short MA is above the middle MA and both of them are above the long MA, the trend is long. Whenever the short MA is below the middle MA and both of them are below the long MA, the trend is short.
MOMENTUM (Multi Timeframe!)
Further to the general trend structure, I am using market momentum to confirm my entries and exits. The most important market indicators to me in this respect are the RSI , DMI and Momentum Oscillator values. A bullish confluence of these momentum indicators are a confirmation for me on a long entry, and a bearish confluence may confirm a short entry.
This aspect is where I believe my indicator is a huge help. Instead of having to check for confluence separately, the indicator is simply signaling confluence by painting the bars, thus providing an easy and quick reading of current momentum.
Even further, the indicator is able to analyize the underlying indicators on three timeframes simultaneously, and paint the candles only in case of total confluence. This has been a huge help in my trading, as it provides me with an immediate MTF momentum reading upon opening a chart.
MY PREFERRED USE OF THIS INDICATOR
I am using this indicator on the 15-minute chart, and I am basically trying to perform trend following momentum pullback scalps. In order to properly time your sniper entries, you may add the Stochastic RSI to the indicator. Here is the strategy:
Long scalp: You are looking for a bullish moving average structure, and you are looking for green candles printed by the Chartpunk Indicator. Green candles mean bullish momentum confluence on the 15m, 1h and 4h timeframes. When you have the bullish ma structure and the green candles, you are waiting for a pullback to the short (yellow) moving average, or to the middle (orange) moving average. The shallower the pullback the stronger the odds. When you see a bounce (trend continuation) and you get also confirmation from the Stochastic RSI, you enter a long scalp.
Short scalp: You are looking for a bearish moving average structure, and you are looking for red candles printed by the Chartpunk Indicator. Red candles mean bearish momentum confluence on the 15m, 1h and 4h timeframes. When you have the bearish ma structure and the red candles, you are waiting for a pullback to the short (yellow) moving average, or to the middle (orange) moving average. The shallower the pullback the stronger the odds. When you see a bounce (trend continuation) and you get also confirmation from the Stochastic RSI, you enter a short scalp.
SUMMARY
This indicator is providing a very clean and quick-to-read outlook of an otherwise rather time and focus intensive study. Instead of checking for confluence of three momentum indicators on three timeframes, you immediately see confluence with the candle paint. The moving average structure is promptly there to confirm the read. The indicator is both a huge productivity help in scouting the market, and an asset to properly time your entries.

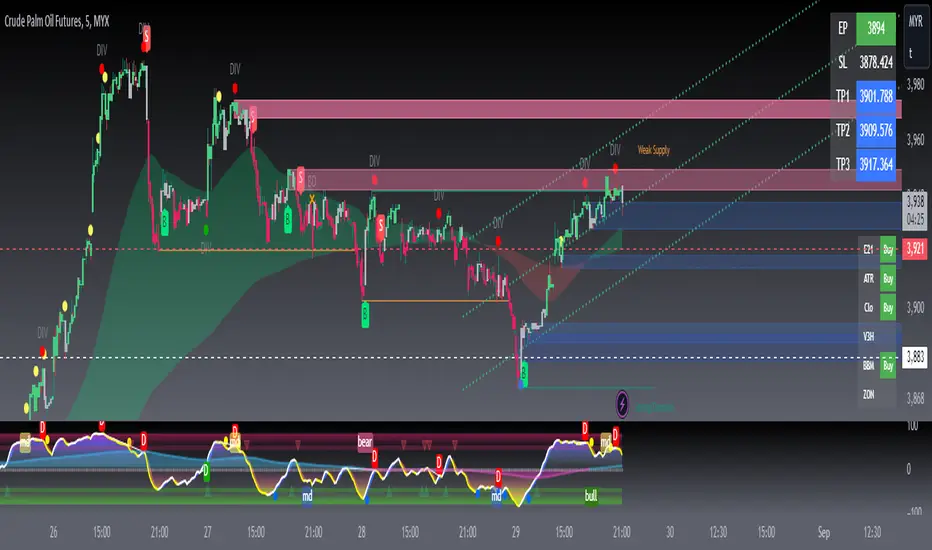
Attrition Scalper v2.0Green/Red Arrowed Buy/Sell signals are just simple buy sell signals based on SuperTrend, VWAP, Bollinger, Linear Regression
Purple Arrowed Buy/Sell Signals happen when the price/candle cross over or under the yellow outer lines (4.236 fib lines) It's extremely rare and hard for price to stay above these lines therefore we can usually and comfortably buy/sell it, a key information here though when price pumps or dumps super fast and hard to the point of crossing these borders, the trend might also be extremely strong and continous so even if the price temporarily goes back inside the borders as the lines expand over time price can continue riding or crossing these lines back again and continue the uptrend/downtrend, therefore crossing these outer borders doesn't necessarilly and always mean a reversal is due.
When analyzing the instrument you're trading the important factors for support/resistance areas are usually the outer lines like i said previously it's super hard for price to be outside these and will almost always get back inside quickly. The Middle thicker green/red line which is Variable Index Dynamic Average should also be a nice pivot line for major support and resistance . All the other lines are also important dynamic support/resistance lines.
Their Importance Order
1- Outer Yellow Line (4.236 Fibs)
2- Thicker Middle Green/Red Line (VIDYA)
3- Thinner Upper/Lower Green/Red Line (VIDYA +3, VIDYA -3)
4- The Rest Of The Lines (Fib Lines)
You can use this indicator in any market condition in any market to determine key support/resistance levels, use it for mean reversion through price expanding to outside of the most outer line therefore being overbought/oversold basically using the purple buy/sell signals or only follow the normal buy/sell signals or use it in confluence with each other. You can also use this indicator in confluence with your own manual technical analysis or other indicators/strategies you are already using and are comfortable with.
A good part is the support/resistance lines from timeframe to timeframe pictures the whole situation quite well, you can use lower timeframe to find your entry/exit positions and higher timeframe to find your key support/resistance points, they all should be somewhat in confluence from timeframe to timeframe anyways. My recommendation would be to look at 1HR, 4HR and 1D charts for swing trading and 5-15 Min for quick scalping/day trading
You should still probably at least take a look to higher timeframes so that you don't get burned when you realize there is a huge resistance line at price XXXXX on the 4 hour chart but you're expecting it to go above it on the 5 minute chart, it can go above it temporarily but we analyze everything on a closing basis so it most likely won't close above it. Again don't take a position or FOMO when price breaks a support/resistance line, we're looking for a CLOSE above/below them and a retest to see if S/R flip happened would even be better.
Sometimes the most outer line won't be the 4.236 (Yellow) lines as when it gets quite volatile the Thinner Upper/Lower Green/Red Lines (VIDYA +3, VIDYA-3) might cross them to be the most outer line, in this case i have observed that the trend is extremely strong this time price almost always doesn't go above or below the VIDYA line but can stay outside of the Yellow 4.236 Fib line for an extended amount of time (price will still get back inside the channel relatively quickly, just not as fast as the normal condition)
With Proper Risk Management and Discipline this indicator can be of great use to you as it's surprisingly successful especially at mean reversion and pointing out the support/resistance lines, they are so much more successful than your average MA/EMA lines.

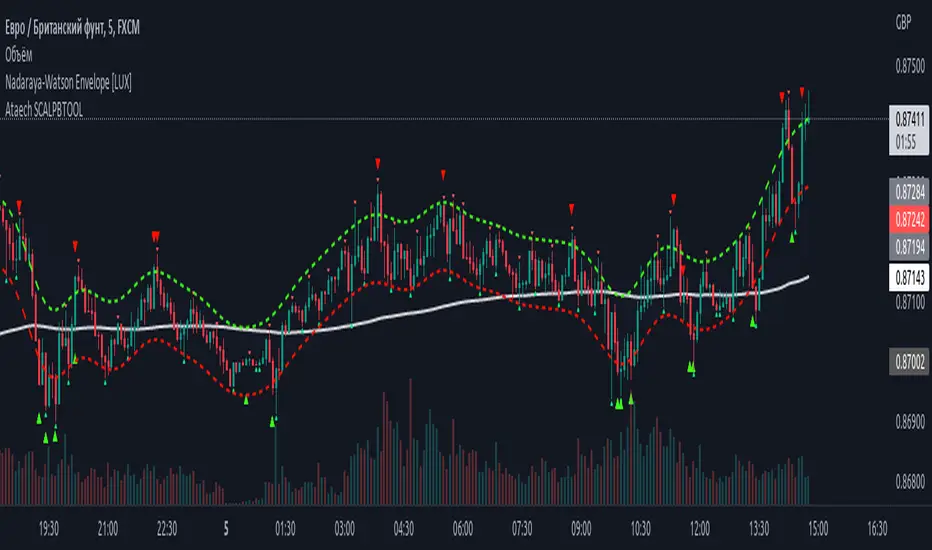
100400 Scalping PullBack Tool R1.1100400 Scalping PullBack Tool R1.1
The following tool smooths the price data using the Nadaraya-Watson estimator, a simple Kernel regression method. We make use of the Gaussian kernel as a weighting function.
SUPER GCOV5 MAPSCALP > MAPPING & SCALPING SUPER GCOV5 MAPSCALP indicator is built specifically for mapping/prediction measurement and fast trading i.e. scalping/intraday in the commodity market or cryptos market. It uses an indicator instrument consisting of ATR TRAILING STOP (ATR), EXPONENTIAL MOVING AVERAGE, PIVOT POINT, FIBONACCI KEY LEVEL, and LINEAR REGRESSION CHANNEL(LRC).
Rebuild of Instrument & Parameter
This indicator is also an upgraded instrument that is sourced from the previous indicator-FUTURES SCALPV2.This R&D of course makes trading activities more effective, and dynamic to increase the confidence of traders in current trading activities. The indicator has been upgraded in terms of parameters as well as additional instruments. Among them are;
1. ATR Trailing Stop
2. ATR BUY/SELL signal
3. Exponential Moving Average(EMA) – fastMA/slowMA Length
5. Breakout/breakdown signal
6. Pivot low/high level
7. Fibonacci extends & retracement
8. Linear Regression Channel(LRC)
9. Alert condition ( a dozen alerts )
> The best timeframe for entry is 3 minutes for FCPO and 15 minutes for other futures & cryptos.
> The best timeframe mapping/prediction is 1 hour & 4 hours.
>The candle/bars have been colored to make it easier for traders to see the price trends whether in bullish or bearish conditions.
Easier SOP of ENTRIES/POSITIONING:
1. entry by signal BUY/SELL after signal bar ( 2nd bar) for confirmation.
2. The best entries BUY at support(pivot low-Blue line) after price rebound then signal appears. The best buy also when the price is at lower
low pivot + fibo support level + lower trendline(LRC) + and the price went rebound.
3. The best entries SELL at resistance(pivot high-red line) after price pullback then signal appears.
The best buy also when the price is at a higher high pivot + fibo resistance level + upper trendline LRC + and the price went pullback.
4. Profit-taking areas are usually measured by support and resistance levels. Please refer to the bold line( support & resistance), fibo key level,
and trendline.
*To avoid false signals/wrong positions, you can use the EMA line as a guide and follow the trends, which are the buying weight when the price is above the 20/50 ema, and the selling weight when the price is below the 20/50 ema. EMA can be reset on the input setting.
STEPS of MAPPING/PROJECTION:
1. Use a bigger timeframe such as 4 hours or 1 hour
2. Use LRC to identify buy/sell weights when the price makes a zig-zag patent
3. Use monthly and weekly fibo levels to know support and resistance. This fibo is very important to see if the price will make an extension or
retracement based on the regression channel earlier. So here we can evaluate which area to buy/sell/take-profit/exit and the reversal of a
market price.
You can also create an ALERT CONDITION to help you get a reminder of signals and price trend changes
The original instrument has been retained but changed in terms of display & facelift features.
Hopefully, the new one will assist you in making analysis and strategy of trading activities successfully.
THIS IS NOT A BUY/SELL CALL, ONLY STUDY IDEAS AND ANALYSIS BASED ON MEASUREMENT TOOLS FOR EDUCATION AND GUIDANCE PURPOSES.PLEASE TAKE AT YOUR OWN RISK.
Impactful pattern and candles pattern AlertThe Alertion indicator!
impactful pattern:
pattern that happen near the zone or in the zone at lower timeframe and give us entry and stop limit price.
It is helpful for price action traders and those who want to decrease their risk.
There are 3 IP patterns:
Quasimodo
Head and shoulder
whipsaw engulfing
These patterns may occur near the zone or may not occur but by them, you can decrease your trading risk for example you can
trade with half lot before IP pattern and enter with other half after pattern.
how to use?
for example:
you find zone at 1h timeframe for short position
when price enter to your zone
you run this indicator and choose your lower timeframe, for example 15m and click on short position.
Then make the alert by right-click on your chart and choose the add alert and at condition box choose the impactful pattern and then click on create
now wait for message :)
Candles pattern:
like reversal bar, key reversal bar, exhaustion bar, pin bar, two-bar reversal, tree-bar reversal, inside bar, outside bar
these occur when the trend turn, so it is usable when the price enter to your zone or near your zone.
This pattern can decrease your risk.
Inside bar and outside bar:
if this pattern engulf up, it is bullish pattern and if engulf down, it is bearish pattern.
what does this indicator do?
this indicator is for making alert
it helps you to decrease your risk and failure.
You optimize it to alert you when IP pattern happen or candle pattern happen or inside bar or outside bar engulfing or all of them.
For IP pattern, it will message you entry and stop limit price.
It works at 2 different timeframes, so you can make alert for example in 1h TF for candles pattern and 15m TF for IP pattern.
Indicator will alert you for candles pattern at your chart timeframe and for IP pattern at timeframe you've chosen when you run the indicator, and it is changeable
in setting.
setting options
TIMEFRAME
IP: select the timeframe for IP patterns it means when IP pattern happen at that timeframe the indicator will alert you
example = your TF is 1h, you found the supply zone and want to trade, note that IP pattern happen in lower TF, so you select 15m TF or TF lower than 1h.
Short position: select it if you want to make short position.
BUFFERING
indicator send you entry and stop limit price
you can change it by amount of percent
it is your strategy to change your entry and stop loss or not
example= in head and shoulder pattern at short position, the stop limit is high price of head in pattern
so the indicator will message you the exact price but if you want to put
your stop limit 5 percent upper than exact price you can enter 5 in front of stop loss
or you want to enter 5 percent lower than exact high price of shoulder, you can optimize it.
ALERTION
you choose what alert you want
IP alert or candle alert or inside and outside bar alert
type your text for alert
you can write additional text for your message
ADVANCE
IP alert frequency option:
1. Once per bar : indicator will alert you for IP pattern once at your chat timeframe bar, and you should wait til next bar for next alert.
2. Once per bar close : alert you when your chart timeframe bar closed and next alert will happen when next bar is closed.
3. All: alert you all the times IP pattern happen
pivot left and right bars: lower will find smaller pattern
at the END:
this indicator is not strategy
it is part of your strategy that help you to increase your winning rate.
It is helpful for scalping and candle patterns finding.
After you make an alert, you can delete the indicator or change your timeframe or make another alert, your previous alert won’t change.
Thank you all.

Relative Andean ScalpingThis is an experimental signal providing script for scalper that uses 2 of open source indicators.
First one provides the signals for us called Andean Oscillator by @alexgrover . We use it to create long signals when bull line crosses over signal line while being above the bear line. And reverse is true for shorts where bear line crosses over signal line while being above bull line.
Second one is used for filtering out low volatility areas thanks to great idea by @HeWhoMustNotBeNamed called Relative Bandwidth Filter . We use it to filter out signals and create signals only when the Relative Bandwith Line below middle line.
The default values for both indicators changed a bit, especially used linreg values to create relatively better signals. These can be changed in settings. Please be aware that i did not do extensive testing with this indicator in different market conditions so it should be used with caution.

TrapLightTrap Light is built off the stochastic RSI to provide convenience and make your entries while scalping either long/short more straightforward.
Notes/Disclaimer:
This indicator is not guaranteed to work every time. Use it at your own discretion and perform your own due diligence. None of this is financial advice.
The main idea behind this is that when the stochastic RSI reaches such extremes that it often moves in a favorable direction.
K = momentum or the blue line of the stochastic RSI indicator.
Perks:
Don't have to look away from candlesticks and measure stochastic RSI's K level.
Simple visual indication of what to do.
Don't have to stare at your chart all day waiting for things to get exciting.
How to Use:
(Above the current candlestick on any timeframe)
1. When K is greater than or equal to 99.5, it shows a sell signal. This is to indicate a short entry.
2. When K is less than or equal to 0.5, it shows a buy signal. This is to indicate a long entry.
3. If neither the conditions for a short/long entry are present, it shows a circle that is like a traffic light.
Red Light: When K is between 99.5 and 95, a red circle is shown to indicate that a short entry may be available soon.
Yellow Light: When K is between 95 and 5, a yellow circle is shown to indicate that neither a long nor short entry may be available soon.
Green Light: When K is between 5 and 0.5, a green circle is shown to indicate that a long entry may be available soon.
Alerts:
Set an alert on the ticker you trade to notify you when either the green or red light is present so that you have time to prepare to make an entry either long/short.
The Code:
The PineScript is open-source and annotated to explain different parts of the script for ease of understanding.
@Credit to Kingson1 for this strategy and his feedback on its creation/implementation.
