CBC Flip with Volume [Pt]█ CBC Flip with Volume
A price-action based indicator that detects real-time control flips between bulls and bears, enhanced with volume filtering and Pine Screener compatibility.
This tool tracks when the market shifts from bear control to bull control or vice versa, using candle structure and volume behavior. It highlights key reversal points, filters low-conviction moves, and provides two screener-ready outputs for directional monitoring.
█ What It Detects
This script identifies when control flips between buyers and sellers on a candle-by-candle basis. A flip is confirmed only when both price structure and volume meet strict criteria. The indicator uses an internal state to track who is in control and updates when a flip occurs.
█ Flip Conditions
Bull Flip
• Previous bar was under bear control
• Current candle closes above the previous high
• Candle is bullish (close is above open)
• Volume is greater than the previous bar
Bear Flip
• Previous bar was under bull control
• Current candle closes below the previous low
• Candle is bearish (close is below open)
• Volume is greater than the previous bar
When a flip occurs, the indicator updates the control state and records the open price of the flip candle.
█ Strong Flip Detection
A flip is considered strong when volume is also greater than the average volume over a set number of candles (default is 50). Strong flips are visually emphasized using larger markers and darker background shading. This helps filter out moves that lack follow-through volume.
█ Visual Elements on Chart
• Bull Flip (Normal): Small teal triangle below the candle
• Bull Flip (Strong): Larger green triangle below the candle
• Bear Flip (Normal): Small salmon triangle above the candle
• Bear Flip (Strong): Larger red triangle above the candle
• Background Color:
– Green shades for bull flips
– Red shades for bear flips
– Darker color when flip is strong
These visual elements appear only on the candle where a flip is detected. No markers are shown on continuation candles.
█ Inputs
• Volume MA Lookback : Sets the moving average length used for determining whether volume is high enough for a strong flip (default: 50)
█ Alerts
• Bull Flip – Notifies when bulls take control
• Bear Flip – Notifies when bears take control
Alerts are triggered at candle close.
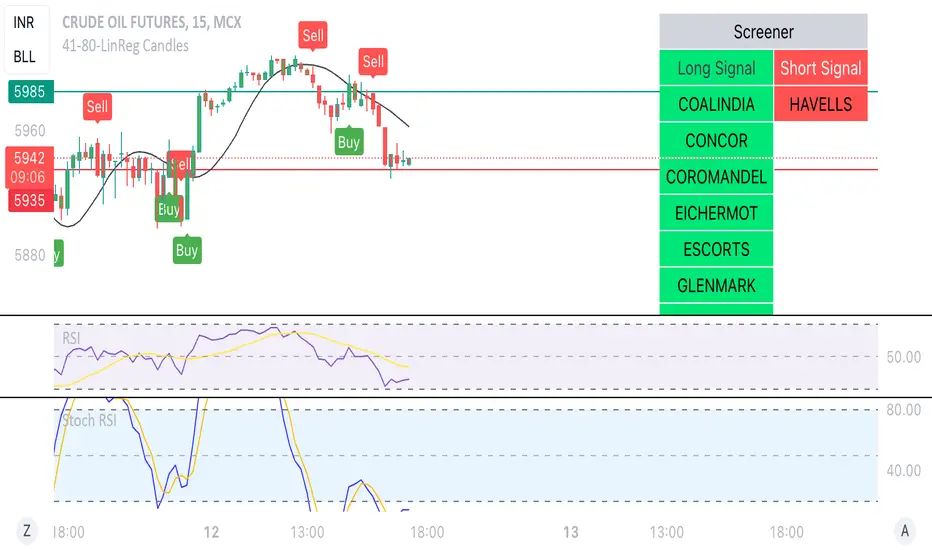
█ Pine Screener Support
This script includes two output columns for TradingView’s Pine Screener:
• Bull in Control (% gain) : Shows the percentage gain from the bull flip’s open to the current close. Resets to 0 when bulls lose control.
• Bear in Control (% gain) : Shows the percentage drop from the bear flip’s open to the current close (as a positive number). Resets to 0 when bears lose control.
These outputs allow you to filter for active moves. For example:
• Bull in Control (% gain) > 2.0 to find strong uptrends
• Bear in Control (% gain) > 1.5 to find sharp breakdowns
█ Use Cases
• Confirm breakouts using volume-backed flips
• Spot short-term reversals at key zones
• Filter out low-volume chop
• Combine screener results with trend or volatility filters
• Build entries around control flips and follow-through strength
Inspired by MapleStax’s original CBC method.
Penunjuk Pine Script®