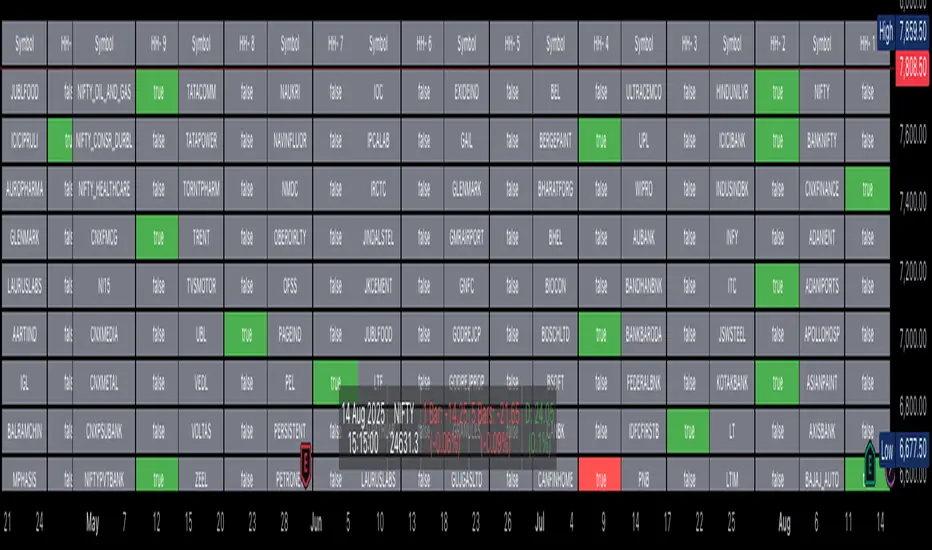
Nifty36ScannerThis code is written for traders to be able to automatically scan 36 stocks of their choice for MACD , EMA200 + SuperTrend and Half Trend . Traders can be on any chart, and if they keep this scanner/indicator on , it will start displaying stocks meeting scanning criteria on the same window without having to go to Screener section and running it again and again. It will save time for traders and give them real time signals.
Indicators for scanning stocks are:
MACD
EMA200
Supertrend
HalfTrend - originally developed by EVERGET
Combination of EMA200 crossover/under and MACD crossover/under has worked well for me for long time, so using this combination as one of the criteria to
Scan the stocks. Using Everget's Half Trend method confirms the signal given by MACD , EMA200 and Supertrend Crossover.
I have added 36 of my favourite stocks from Nifty 50 lot. Users of this script can use the same stocks or change it by going into the settings of this scanner.
The Code is divided into 3 Sections
Section 1: Accepting input from users as boolean so that they can scan on the basis of one of the criteria or any combination of the criteria.
Section 2: "Screener function" to calculate Buy/ Sell on the basis of scanning criteria selected y the user.
screener=>
= ta.supertrend(2.5,10)
Buy/Sell on the basis of Supertrend crossing Close of the candle
//using ta.macd function to calculate MACD and Signal
= ta.macd(close, 12, 26, 9)
using HalfTrend indicator to calculate Buy/Sell signals , removed all the plotting functions from the code of Half Trend
Bringing Stock Symbols in S series variables
s1=input.symbol('NSE:NIFTY1!', title='Symbol1', group="Nifty50List", inline='0')
Assigning Bull/Bear ( Buy/Sell) signals to each stocks selected
=request.security(s1, tf, screener())
Assign BUY to all the stocks showing Buy signals using
buy_label1:= c1?buy_label1+str.tostring(s1)+'\n': buy_label1
Follow the same process for SELL Signals
Section 3: Plotting labels for the BUY/SELL result on the in terms of label for any stocks meeting the criteria with deletion of any previous signals to avoid clutter on the chart with so many signals generated in each candle
Display Buy siganaling stocks in teh form of label using Label.new function with parameters as follows:
barindex
close as series
color
textcolor
style as label_up,
yloc =price
textalign=left
Delete all the previous labels
label.delete(lab_buy )
STOCKS SELECTION
We have given range f 36 stocks from NIFTY 50 that can be selected at anytime,. User can chose their own 36 stocks using setting button.
INDICATORS SELECTION
1. MACD: It i sone of the most reliable trading strategy with 39.3% Success rate with 1.187 as profit factor for NIFTY Index on Daily time frame
2. EAM200 + Super trend : Combination of EMA200 crossover and Super trend removes any false positives and considered a very reliable way of scanning for Buy/Sell signals
3. HALF TREND: Originally developed as an indicator by Everget and modified as strategy by AlgoMojo, it generates Buy/Sell signals with 40.2% success rate with 1.469 as profit faction, on 15 minutes timeframe.
Penunjuk Pine Script®