PDH/PDL ScreenerHello Fellow Traders,
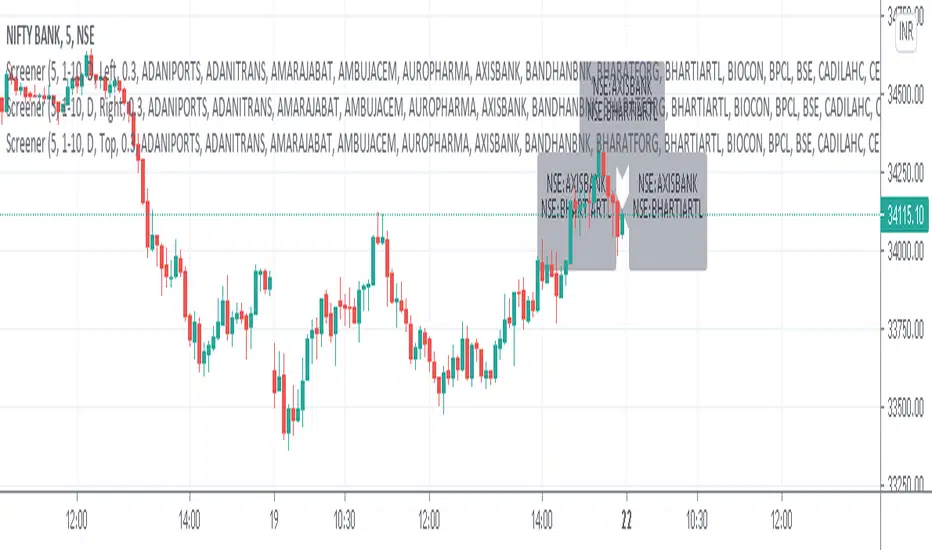
This is a Real-Time Screener for stocks trading near previous day's high/low and day before previous day's high/low (default), you can select previous week also.
Screener scans stocks in batches of 10 on defined time-frame (preset- 5 min).
As of now total 100 stocks can be added out of which i've added 80 scripts i.e 8 batches to scan out.
Bits slower due to long code please give some seconds to load.
Happy Trading ...
"Dua me yaad rakhna :-)"
-Nitin
Cari dalam skrip untuk "screener"
Indices Sector SigmaSpikes█ OVERVIEW
“The benchmark Dow Jones Industrial Average is off nearly 300 points as of midday today...”
“So what? Is that a lot or a little? Should we care?”
-Adam H Grimes-
This screener aims to provide Bird-Eye view across sector indices, to find which sector is having significant or 'out-of-norm' move in either direction.
The significance of the move is measured based on Sigma Spikes, a method proposed by Adam H. Grimes, where Standard Deviation of returns used as a baseline.
*You can google his blog or read his book, got some gold in there, especially on how he use indicators for trading
█ Understanding Sigma Spikes
As described by Grimes, moves in markets are only meaningful when we consider what “normal” is for that market.
Without that baseline, the daily change number, and even the percent change on the day doesn’t really mean much.
To overcome that problem, Sigma Spikes, as a measure of volatility, attempt to put todays change in price (aka return) in context of the standard deviation of 20 days daily's return.
Refer chart below:
1. The blue bars refer to each days return
2. The orange line is 1 time standard deviation of past 20days daily's return (today not included)
3. The red line is 2 time standard deviation of past 20days daily's return (today not included)
Using the ratio of today's return over the Std Deviation, determining your threshold (1,2,3,etc) will be the key that tells if today's move is significant or not.
*Threshold referring to times standard deviation, and different market may require different threshold.
*20 Days period are based on the Lookback Period, adjustable from user input window.
█ Features
- Scan up to 13 symbols at a time (Bursa (MYX) indices are defaulted, but you may change to any symbols/index from the user input setting)
█ Limitation
- Due to multiple use of security() function required to call other symbols, expect the screener to be slow at certain times
- Custom Timeframe currently accept only Daily and Weekly. I'll try to include lower timeframe in the next update
█ Disclaimer
Past performance is not an indicator of future results.
My opinions and research are my own and do not constitute financial advice in any way whatsoever.
Nothing published by me constitutes an investment recommendation, nor should any data or Content published by me be relied upon for any investment/trading activities.
I strongly recommends that you perform your own independent research and/or speak with a qualified investment professional before making any financial decisions.
Any ideas to further improve this indicator are welcome :)

Patternz Screener DBPPatternz Screener is Breakout of box
This indicator forms triangle based on candle open close and then paints it breakout either on upside or downside
it is impossible to scan each stocks whether it have broken breakout so i have used his script and converted into screener
This indicator helps you identify which stocks are breaking above or below patternz box
Multi timeframe - 5,15,30,60,120,240,Day,Week and Month
Can add upto 40 - Stocks , commodities ,indices

BlueswimmersMinorsBoxV1sloth288Something different to what you usually see in the pine world Part 2
This is an add on to BlueswimmersMajorBoxV1sloth288.
Custom currency screener, to be used with BlueswimmerDoesPine at the same time. to get an idea of whats going on change lookback setting to 0, and go to minute candles.
But in a nutshell.
With lookback being 1, and if currency pair says NEUTRAL LONG, it means last close of candle the long signal happened.
With lookback being 0, and if currency pair says NEUTRAL LONG, it means last candle was neutral and current candle is sitting at long.
If scalping minute candles. Have trading screen split in two, BlueswimmersMajorsBoxV1sloth288 on one side, and BlueswimmerDoesPine on the other. that way when flicking between different charts the indicator does not need to load security data over and over again. This is also the reason why the time frame setting is there, so on the screener it can be just loaded to low time frames, and to double check a trade on the other screen you can zoom out to larger time frames and not reloading data over and over again.

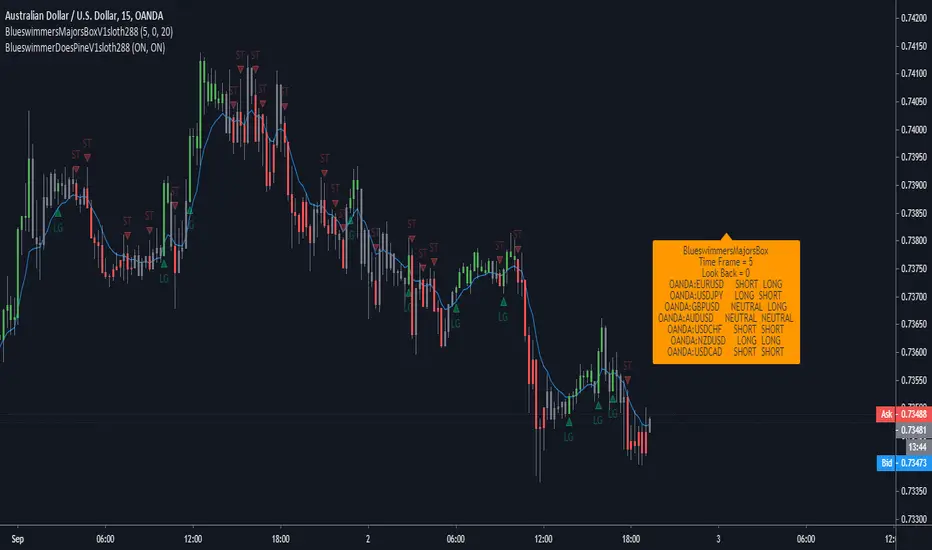
BlueswimmersMajorsBoxV1sloth288Something different to what you usually see in the pine world.
Custom currency screener, to be used with BlueswimmerDoesPine at the same time. to get an idea of whats going on change lookback setting to 0, and go to minute candles.
But in a nutshell.
With lookback being 1, and if currency pair says NEUTRAL LONG, it means last close of candle the long signal happened.
With lookback being 0, and if currency pair says NEUTRAL LONG, it means last candle was neutral and current candle is sitting at long.
If scalping minute candles. Have trading screen split in two, BlueswimmersMajorsBoxV1sloth288 on one side, and BlueswimmerDoesPine on the other. that way when flicking between different charts the indicator does not need to load security data over and over again. This is also the reason why the time frame setting is there, so on the screener it can be just loaded to low time frames, and to double check a trade on the other screen you can zoom out to larger time frames and not reloading data over and over again.
Oversold Screener · v4# Step-2 Oversold Screener · v3.3
US equities · 15-minute event engine · AVWAP entries A–F · optional CVD/RSI/Z guards
## What this script does
Finds short, emotion-driven selloffs in large, healthy US stocks and turns them into actionable, right-side opportunities.
On a qualified 15-minute close it:
1. emits a minimal webhook so your backend/AI can vet the news and fundamentals, and
2. anchors an Event-AVWAP and plots ±1/±2/±3σ bands to guide entries A–F as price mean-reverts.
The logic runs in a fixed 15-minute space, independent of the chart timeframe you view.
## How an event is detected (Step-2 signal)
All conditions are evaluated on 15-minute data, including extended hours.
Depth, measured vs yesterday’s RTH reference
* Reference = min(yesterday’s RTH VWAP proxy, yesterday’s Close).
* 4h depth: current price vs reference across 16×15m bars ≤ threshold (default −4%).
* 8h depth: lowest close across the last 32×15m bars vs reference ≤ threshold (default −6%).
Relative underperformance
* Versus market ETF (SPY/QQQ) and sector ETF (XLK/XLF/XLY… or KWEB/CQQQ).
* Uses the same 16/32×15m windows; stock must be weaker by at least the set margins (default −3%).
Macro circuit breakers (any one trips = suppress signal)
* VIX level ≥ fuse (default 28).
* Market 4h/8h drawdown ≤ limits (default −2.0% / −3.5%).
* Sector 4h/8h drawdown ≤ limits (default −2.5% / −4.0%).
Momentum and distribution guards
* RSI(1h) < 30 by default (computed from 15m series).
* Optional Z-score filters: stock Z ≤ zTrig, and macro Z floors for market/sector.
* Cooldown per symbol so you don’t get spammed by repeated events.
When the event closes, the script posts a tiny JSON to your alert webhook and pins an on-chart “S2” marker at the event bar.
## Event-AVWAP and bands
From the event bar forward the script computes AVWAP natively in 15m space and draws bands at ±1σ/±2σ/±3σ.
σ is a rolling standard deviation of typical price with optional EMA smoothing and an optional cap.
Why this helps
* AVWAP from the shock timestamp approximates the crowd’s average position after the selloff.
* Reclaiming key bands often marks the start of orderly mean reversion rather than a dead-cat bounce.
## Entry proposals A–F (right-side confirmations)
Each entry requires first touching a lower band, then reclaiming a higher band.
A touch ≤ −2σ, then cross up through −1σ
B touch ≤ −1σ, then reclaim AVWAP
C break above −1σ, retest near −1σ within N bars, then bounce
D after compression (low ATR%), reclaim AVWAP
E touch ≤ −3σ, then cross up through −2σ
F touch ≤ −3σ, then cross up through −1σ (fast, aggressive)
Labeling hygiene
* Only the first three occurrences of each type A–F are shown within a one-week window after the event.
* A debounce interval avoids over-labeling across adjacent bars.
## Optional CVD gate (order-flow confirmation)
When enabled, entries must also pass a 15-minute CVD gate that looks for sell pressure exhaustion and a turn-up in cumulative delta.
Defaults are conservative; start with CVD off until you’re comfortable, then enable to filter chop after capitulations.
## Alert payload (minimal by design)
On the event bar close the script fires one alert with a tiny JSON that is easy to route and process in bulk:
```json
{
"event": "Crash_signal_15m",
"symbol": "NVDA",
"symbol_id": "NASDAQ:NVDA",
"ts_alert_15m_ms": 1730898900000,
"ts_alert_15m_local": "2025-11-06 10:45"
}
```
Notes
* ts_alert_15m_ms is the 15-minute close time in milliseconds since epoch (UTC reference).
* ts_alert_15m_local uses your chart’s timezone for readability.
Optional: a 24-hour streaming mode can resend this minimal payload on every 15-minute close during the day after the event (tiny patch available on request).
## Inputs you will actually touch
Bench/Sector symbols
* Bench: SPY or QQQ. Sector: XLK/XLF/XLY… or KWEB/CQQQ depending on the name.
Depth and relative thresholds
* 4h depth ≤ −4%, 8h depth ≤ −6%.
* Relative to market/sector ≤ −3% each.
Macro fuses
* VIX ≥ 28; market ≤ −2.0%/−3.5%; sector ≤ −2.5%/−4.0%.
Z/RSI guards
* Z window 80 bars (15m), stock zTrig ≤ −1.5, macro floors ≥ −1.0.
* RSI(1h) < 30.
AVWAP band engine
* σ EMA length 3; σ cap off by default.
* Retest window for entry C: 24 bars (≈6 hours).
Presentation and hygiene
* One-week entry window; per-type cap 3; debounce 8×15m bars.
* Signal table on/off, label pinning on/off.
## How to run it
1. Open a 15-minute chart (extended hours enabled recommended).
2. Add the indicator and choose Bench/Sector for the names you are reviewing.
3. Create a single alert per chart with Condition = Any alert() function call and Options = Once per bar close.
4. Point the alert to your webhook URL (or use app/email if you don’t have a URL).
5. Let your backend/AI receive the minimal JSON, do the news/fundamentals check, and decide Allow / Hold / Reject.
6. For Allowed names, use the on-chart A–F markers to stage in; manage risk against Event-AVWAP and upper HVNs/POC.
## Defaults that work well
* RSI(1h) < 30
* Depth 4h/8h ≤ −4%/−6% vs yesterday’s reference
* Relative to market/sector ≤ −3%
* Z: stock ≤ −1.5; macro floors ≥ −1.0
* Fuses: VIX ≥ 28; market ≤ −2.0%/−3.5%; sector ≤ −2.5%/−4.0%
* Bands: σ EMA = 3; no σ cap; one-week window; 3 labels per type
## Notes and limitations
* This is an indicator, not an auto-trader. Position sizing and exits are up to you.
* Designed for liquid US equities; thin ADRs and micro-caps are noisy.
* All event logic and entries are evaluated on bar close; AVWAP and bands do not repaint.
* If you need to monitor many symbols without a server, a Scanner variant can batch 10–17 tickers per script and alert without a webhook.

Oversold Screener · Webhook v3.3#Oversold Screener · Webhook v3.3
US Equities · 15-minute signals · AVWAP entries A–F · Optional CVD gate
## TL;DR
This indicator finds short-term, emotion-driven selloffs in large, liquid US stocks and pings your webhook with a compact alert (symbol + 15-minute close time).
It anchors an Event-AVWAP at the first qualified 15-minute bar after the selloff and proposes disciplined “right-side” entries (A–F) as price mean-reverts back through statistically defined bands. Optional macro fuses and CVD filters help avoid catching knives.
---
## What it does
1. Universe filter (off-chart): You run this on constituents of S&P 500 / Nasdaq-100 / Nasdaq Golden Dragon (or your curated list of healthy companies).
2. Signal (Step-2): On the 15-minute timeframe—including extended hours—the script flags an “oversold event” when:
• Depth: Today’s drawdown vs yesterday’s RTH reference (min of yesterday’s VWAP and Close) is large.
• Relative: The stock underperforms both its market benchmark (e.g., SPY/QQQ) and its sector ETF over the same 16/32×15m windows.
• Macro fuses: If any of the following exceed thresholds, the signal is suppressed: VIX spike, market 16/32×15m selloff, sector 16/32×15m selloff.
• RSI guard: 1-hour RSI is below a configurable level (default 30).
• Cooldown: De-dupes repeated events; you won’t be spammed by the same name intraday.
3. Execution geometry: At the event bar’s close the indicator anchors an AVWAP calculated natively in 15m space and draws ±1σ/±2σ/±3σ bands from a rolling variance of typical price.
4. Entry proposals: It labels A–F entries when price regains key bands after first probing the lower ones (see below). Optional 15m CVD confirmation can be required.
5. Alerts: When the event closes, TradingView raises a single alert with a tiny JSON payload so your downstream AI/service can do the news check and decide.
---
## Why this approach works
• Depth vs yesterday’s RTH reference targets “fresh” dislocations rather than slow trends.
• Relative filters ensure the stock fell much more than both the market and its sector, isolating idiosyncratic panic.
• AVWAP from the event bar approximates the market’s true average position after the shock; band reclaims are robust right-side confirmations.
• Optional CVD (delta volume) catches sell-side exhaustion and buy-side emergence without requiring a full order-book feed.
• Macro fuses (VIX / market / sector) avoid swimming against systemic stress.
---
## Inputs (key)
Bench ETF / Sector ETF
Choose your market (SPY or QQQ) and sector ETF (XLK/XLF/XLY… or KWEB/CQQQ for China tech ADRs).
Depth & relative settings (15-minute space)
• Depth vs prior-day RTH reference: percentage thresholds for 16 and 32 bars.
• Relative to market & sector: underperformance thresholds over 16 and 32 bars.
Macro circuit breakers
• VIX max change (e.g., +8%/+12% over the session)
• Market max 16/32×15m selloff (e.g., −1.5% / −2.5%)
• Sector max 16/32×15m selloff (e.g., −2.0% / −3.0%)
If any one exceeds the limit, the signal is suppressed.
Momentum guard
• RSI(1h) < 30 (configurable).
AVWAP band engine (15m native)
• Bands: ±1σ / ±2σ / ±3σ with EMA smoothing and optional σ cap.
• Settling bars after anchor (default 1–3) to reduce immediate whipsaws.
Entry toggles
• Enable/disable A, B, C, D, E, F individually.
• Optional CVD gate (on/off), lookback window and reversal thresholds.
Housekeeping
• Debounce per ticker and per entry type.
• Entry window length (default 1 week) and per-type cap (show top 3 per event).
• Webhook on/off.
---
## Entries (A–F)
These are right-side confirmations; each requires first touching the prerequisite lower band before reclaiming a higher one.
A Touch ≤ −2σ, then cross up through −1σ (classic exhaustion → relief).
B Touch ≤ −1σ, then reclaim AVWAP (crowd average changes hands).
C Break −1σ up, retest near −1σ within N bars, then bounce (retest confirmation).
D After compression (low ATR%), reclaim AVWAP (coiled spring).
E Touch ≤ −2σ, then reclaim AVWAP after a base (deeper flush → stronger reclaim).
F Touch ≤ −3σ, then cross up through −1σ (capitulation → violent mean reversion).
Optional CVD gate (15m): require sell-pressure exhaustion and a CVD turn-up before validating entries. Defaults are conservative so that A/F remain the highest-quality.
---
## Alert payload (minimal by design)
On event close, one alert is fired with a tiny JSON:
{
"event": "step2_signal",
"symbol": "TSLA",
"ts_15m_ms": 1730879700000
}
Use “Once per bar close” and the 15-minute chart. Your webhook receiver can enrich with fundamentals/news and decide Allow / Hold / Reject, then monitor A–F entries for execution.
---
## How to use
1. Run on your 15-minute chart with extended session enabled.
2. Create one alert per chart (or use TradingView’s multi-chart / watchlist alerts if you have Pro+).
3. Your backend ingests the minimal payload, fetches news and fundamentals, and returns a decision.
4. For Allowed names, watch the on-chart A–F labels; scale in across levels, scale out into upper HVNs/POC or AVWAP give-back.
---
## Defaults that work well
• RSI(1h) < 30
• Depth vs yesterday’s RTH ref: ≤ −4% (16 bars), ≤ −6% (32 bars)
• Relative to market/sector: ≤ −3% (16 bars), ≤ −4% (32 bars)
• Macro fuses: VIX day change ≤ +10%; market ≤ −2.0% / −3.0%; sector ≤ −2.5% / −3.5%
• AVWAP bands: EMA(σ)=3; σ cap off; settle ≥ 1 bar
• CVD gate off initially; enable after you’re comfortable with its behavior.
---
## Notes & limitations
• Indicator, not a strategy: it proposes event points and entries; position sizing and exits are up to you.
• Designed for US equities with ample liquidity; thin names will be noisy.
• Repainting: AVWAP and bands are anchored and do not repaint; entries are evaluated on bar close.
• To keep charts readable, we limit entry labels to the first three occurrences per type within the one-week window.
---
## What’s new in v3.3
• 15-minute event engine (always 15m, independent of the chart you view).
• Depth measured vs yesterday’s RTH VWAP/CLOSE (the lower of the two).
• Removed structure-health (SMA50 coverage) and MA50/200 position checks.
• Macro circuit breakers: VIX + market + sector thresholds; any one trips a fuse.
• RSI guard moved to 1-hour.
• AVWAP bands include ±3σ and new Entry F (−3σ → −1σ reclaim).
• Optional 15m CVD gate for entries.
• Minimal webhook payload for fast downstream AI checks.
• Debounce + entry-window caps to prevent over-labeling and to focus the week after the event.
• Numerous performance and stability tweaks in the 15m security sandbox.
---
## Disclaimer
This is a research tool. It does not constitute investment advice. Test in Replay first, start with small size, and respect your risk.


Market Screener - NarwingThis is a 20 cryptocurrency market screener, it's goal is to provide a broad view of the state of cryptocurrencies using 4 key components
1. ROC
2. Sharpe Ratio
3. Sortino Ratio
4. Omega Ratio
All these metrics are calculated twice with two different lengths, 7 day and 30 days
This allows for broad market screening instead of focusing on one particular asset
This tool is meant for research purposes only, never invest money you can't afford to lose

Turtle Donchian Screener — with signalsTurtle strategy for Pine screener — with signals for buy and sell (long positions).
Turtle/Donchian Screener — Recency & CloseAtBuyTurtle strategy, donchian channels. For Pine screener with for example buysignals and sellsignals.

Days Above MA Since Last Breach (10/20/50/200) — v6 ScreenerIt identifies the number of days above a certain MA since the last breach. Mostly helpful for use with pine screener
MCX RSI Screener (5m,15m,1D)A complete multi-timeframe RSI screener designed for MCX commodities.
It automatically fetches RSI values from 5-minute, 15-minute, and 1-day timeframes for up to 10 selected MCX symbols — all in one compact table.
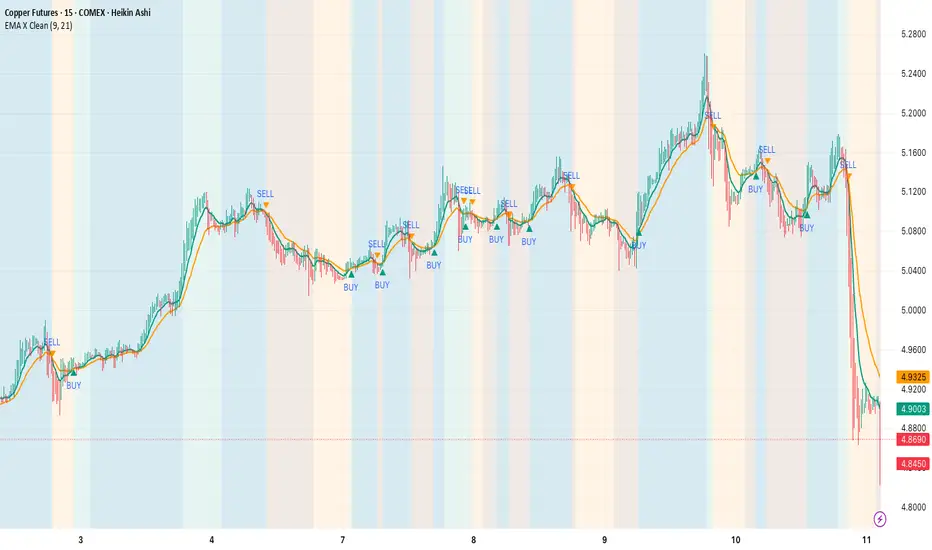
"Top 20 Crypto Coins Table Screener + SuperTrend & EMA 9/21 CrosThis indicator is a powerful table screener for the top 20 crypto coins, updated for 2025 and designed for maximum clarity and speed. It displays customizable columns for Symbol, Price, SuperTrend ("Up"/"Down"), and EMA 9/21 crossover signals ("Buy"/"Sell") across multiple assets on a single chart.
Features:
Covers 20 major coins (edit the symbol list for preferences).
SuperTrend direction and coloring, for quick visual identification of trend.
EMA 9/21 crossover logic for rapid momentum buy/sell decisions.
Fast table rendering, minimal lag—even on basic hardware.
All logic, table columns, and alerts directly built into the script.
How To Use:
Paste the indicator code into Pine Editor and save it.
Activate for your preferred timeframes and coins.
View the table at the top right for actionable signals.
Easy to customize ticker symbols and table layout.
Remarks:
No RSI, ADX, or TSI for speed—focus is on high-impact trend/momentum signals.
Ideal for day traders, swing traders, and crypto investors monitoring broader markets.
For questions, improvements, or feedback, comment on the script page or connect via TradingView.

Market Structure ICT Screener [TradingFinder] BoS ChoCh🔵 Introduction
Market Structure is the foundation of every Smart Money and ICT based trading model. It describes how price moves through a sequence of highs and lows, forming clear phases of expansion, retracement and reversal. Understanding this structure allows traders to read institutional order flow and align their positions with the true direction of liquidity.
Two of the most critical components in Market Structure are the Break of Structure (BOS) and Change of Character (CHOCH). A BOS represents trend continuation, confirming strength within the current direction. In contrast, CHOCH also known as a Market Structure Shift (MSS) signals the first sign of a trend reversal or liquidity shift where order flow begins to change from bullish to bearish or vice versa.
Because the market is fractal, structure can exist at multiple levels known as Major (External) and Minor (Internal). Major structure defines the overall trend on higher timeframes while minor or internal structure reveals short term swings and early reversals within that larger move.
🔵 How to Use
Understanding Market Structure starts with identifying how price interacts with previous swing highs and swing lows. Every trend in the market, whether bullish or bearish, is built from a sequence of impulsive and corrective moves. Impulsive legs show strong displacement in the direction of liquidity flow, while corrective legs represent temporary pullbacks as the market rebalances before the next expansion. Recognizing these sequences is essential for reading the story of price and anticipating what may happen next.
A Break of Structure (BOS) occurs when price decisively moves beyond a previous structural point by breaking above the last high in an uptrend or falling below the last low in a downtrend. This event confirms that the current trend remains intact and that liquidity has been successfully taken from one side of the market. A BOS acts as confirmation of continuation and reflects strength within the existing directional bias.
A Change of Character (CHOCH) appears when price violates structure in the opposite direction of the prevailing trend. This is the first signal that market sentiment and order flow may be shifting. For example, during a downtrend if price breaks above a previous high, it indicates that sellers are losing control and a potential bullish reversal may be developing. In an uptrend, when price drops below a recent low, it suggests a possible bearish transition.
Because the market is fractal, structure exists across multiple layers. Major structure reflects the dominant movement visible on higher timeframes and defines the broader directional bias. Minor or internal structure represents smaller swings within that move and helps identify early transitions before they appear on the higher timeframe. When internal and external structures align, they offer a high probability signal for trend continuation or reversal.
By observing BOS and CHOCH across both internal and external structures, traders can clearly visualize when the market is expanding, contracting or preparing to shift direction. This structured understanding of price movement forms the foundation for precise trend analysis and high quality decision making in any Smart Money or ICT based trading approach.
🔵 Settings
🟣 Display Settings
Table on Chart : Allows users to choose the position of the signal dashboard either directly on the chart or below it, depending on their layout preference.
Number of Symbols : Enables users to control how many symbols are displayed in the screener table, from 10 to 20, adjustable in increments of 2 symbols for flexible screening depth.
Table Mode : This setting offers two layout styles for the signal table :
Basic : Mode displays symbols in a single column, using more vertical space.
Extended : Mode arranges symbols in pairs side-by-side, optimizing screen space with a more compact view.
Table Size : Lets you adjust the table’s visual size with options such as: auto, tiny, small, normal, large, huge.
Table Position : Sets the screen location of the table. Choose from 9 possible positions, combining vertical (top, middle, bottom) and horizontal (left, center, right) alignments.
🟣 Symbol Settings
Each of the 20 symbol slots comes with a full set of customizable parameters :
Symbol : Define or select the asset (e.g., XAUUSD, BTCUSD, EURUSD, etc.).
Timeframe : Set your desired timeframe for each symbol (e.g., 15, 60, 240, 1D).
Pivot Period : Set the length used to detect swing highs and lows. Shorter values increase sensitivity, longer ones focus on major structures.
🔵 Conclusion
Mastering Market Structure and understanding the relationship between BOS and CHOCH allows traders to see the market with greater clarity and confidence. These two elements reveal how liquidity moves through different phases of expansion and retracement and how institutional order flow shifts between accumulation and distribution.
By analyzing both internal and external structures, traders can align short term and long term perspectives and anticipate where price is most likely to react. The ability to read these structural shifts helps identify continuation points, reversals and areas where liquidity is engineered or collected.
Incorporating Market Structure into a consistent trading process transforms the way a trader views the chart. Instead of reacting to random movements, each swing, break and shift becomes part of a logical framework that reflects the true behavior of the market. Understanding BOS and CHOCH is not just a concept but a complete language of price that guides every professional decision in Smart Money and ICT based trading.

Multi-Strategy Trading Screener SummaryI only combined famous scripts, all thanks to wonderful scripts and community out there .
ThankYou !
------
Core Architecture
Multi-Symbol Analysis: Tracks up to 5 configurable tickers simultaneously
Multi-Timeframe Support: Each symbol can use different timeframes
Real-Time Dashboard: Color-coded table displaying all signals and analysis
Trend Validation: All signals include trend alignment confirmation
Integrated Trading Strategies
1. Breaker Blocks (Order Blocks)
Detects institutional order blocks using swing analysis
Tracks when blocks are broken and become "breaker blocks"
Monitors retests of broken levels
Shows trend alignment (✓ aligned, ⚠️ misaligned)
2. Chandelier Exit
ATR-based trend-following exit system
Provides BUY/SELL signals based on dynamic stop levels
Uses configurable ATR multiplier and lookback period
3. Smart Money Breakout
Channel breakout detection with volatility normalization
Identifies accumulation/distribution phases
Generates persistent BUY/SELL signals on breakouts
4. Trendline Breakout
Dynamic trendline detection using pivot highs/lows
Calculates trendline slopes and breakout points
Provides BUY signals on upward breaks, SELL on downward breaks
Dashboard Columns Explained
Symbol: Ticker being analyzed
Trend: Overall SuperTrend direction (🟢 UP / 🔴 DOWN / ⚪ FLAT)
Timeframe: Analysis timeframe with clock icon
Breaker Block: Type (Bullish/Bearish) with trend alignment indicator
Status: Price position relative to breaker block (Inside/Approaching/Far)
Retests: Number of times the broken level was retested (indicates level strength)
Volume: Volume associated with the order block formation
Chandelier: BUY/SELL signals from Chandelier Exit strategy
Smart Money: BUY/SELL signals from breakout detection
Trendline: BUY/SELL signals from trendline breakouts
Key Features
No HOLD States: All signals show definitive BUY (🟢) or SELL (🔴) only
Persistent Signals: Signals remain active until opposite conditions trigger
Color Coding: Visual distinction between bullish (green) and bearish (red) signals
Trend Alignment: Enhanced accuracy through trend confirmation logic
This screener provides a comprehensive view of market conditions across multiple strategies, helping identify high-probability trading opportunities when signals align.

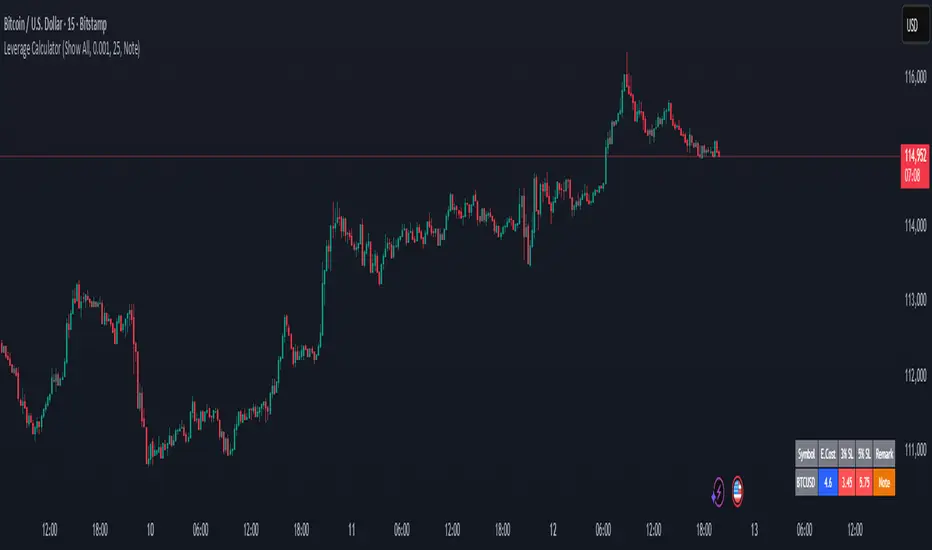
Margin Cost Calculator Screener - Taylor V1.2# Leverage Position Cost Calculator & Stop Lose Cost Screener #
Designed to provide traders with crucial insights into their leveraged positions directly on the TradingView chart.
Key Features:
> Dynamic Display: Choose to view only the estimated entry cost, or a comprehensive overview including potential losses at specific stop-loss levels, and a custom remark.
> Contract Size Input: Easily specify the contract size for your trades.
> Leverage Level Input: Set your desired leverage level, with helpful tooltips explaining the margin requirements for various leverage ratios (e.g., 25x, 10x, 5x) and an included fee estimate.
> Cost Calculation: Accurately calculates the estimated entry cost for your position based on the current market price, contract size, and leverage.
> Stop-Loss Projections: It projects potential losses for stop-loss orders set at 3% and 5% below the entry price, helping you manage risk effectively.
> Clear Table Visualization: All calculated data is presented in a clean, organized table anchored to the bottom-left of your chart, making it easy to reference at a glance.
> Symbol Identification: Automatically displays the short ticker symbol for the asset you are analyzing.
This tool is invaluable for traders who utilize leverage and need a quick, visual way to understand their financial exposure and potential outcomes before entering or managing a trade.
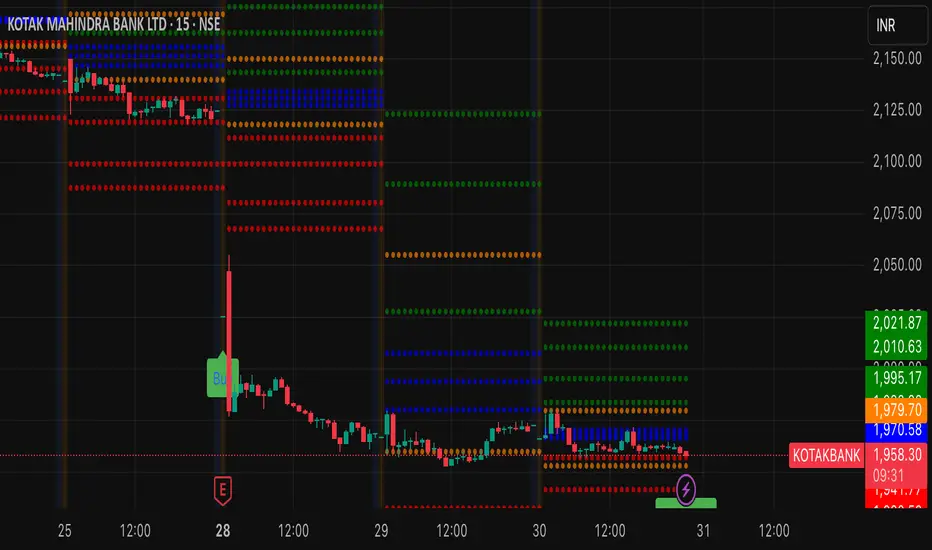
Aggressive Phase + Daily Buy Visual Screener — v6Aggressive Phase + Daily Buy Visual Screener — v6 for bullish, neutral and bearish zone identification

ORB Screener-Multiple Indicators [Marin adjusted]ORB Screener for multiple instruments
You can select the range of the ORB and see different indicators for the selected instruments
Weekly % Change Screener (5% Sell Threshold)This is a weekly screener for a 5% change in the stock value. If it increases by 5%, we sell and if it decreases by 5% we buy the stock. Good for stable high value stocks. Buy before testing.
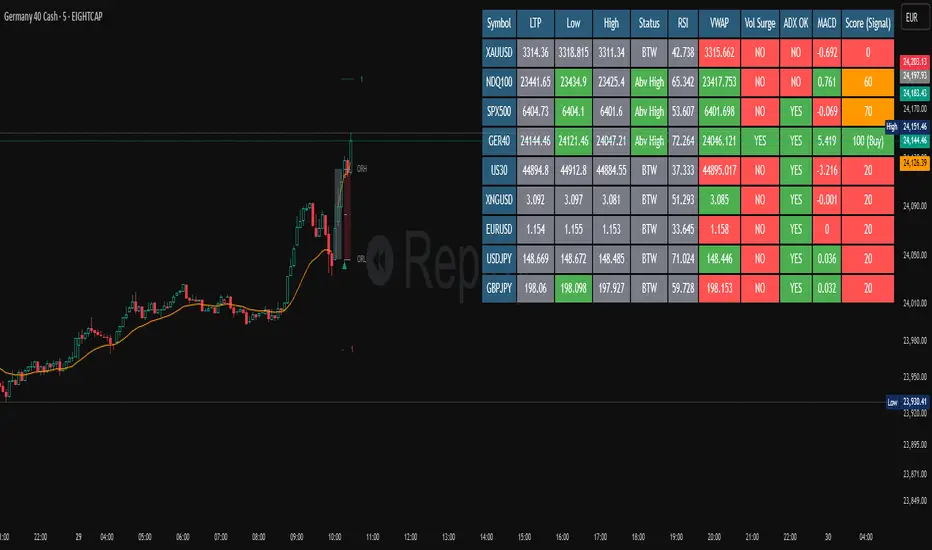
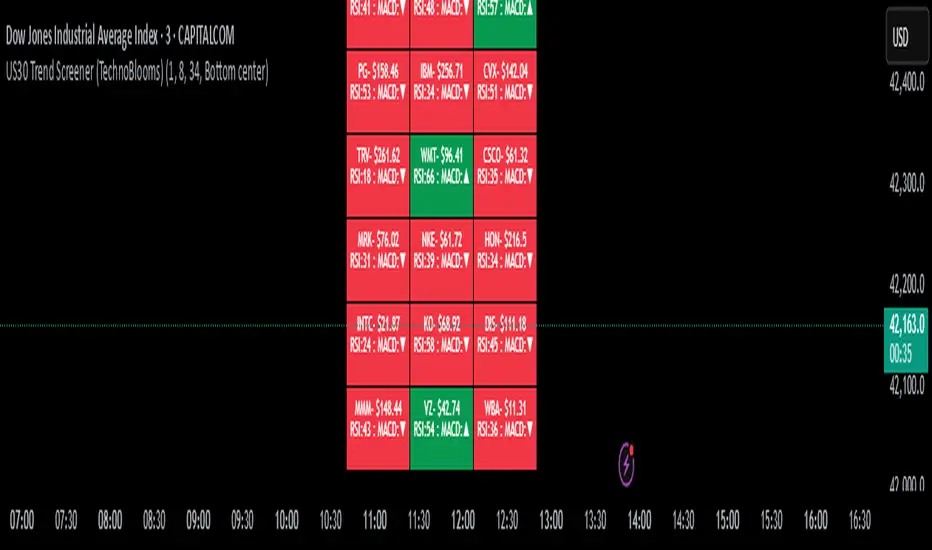
US30 Trend Screener (TechnoBlooms)Identify Index Trends Before the Move Starts.
The US30 Trend Screener is a powerful tool designed to help traders understand the internal dynamics of the Dow Jones Industrial Average (US30) by analyzing the trends of its weighted component stocks in real time.
📊 How It Works
This indicator uses EMA crossovers, RSI, and MACD signals from the 30 Dow Jones stocks and visualizes them in a compact, color-coded dashboard overlay on your chart.
You can choose your preferred lower timeframe (e.g., 1min, 5min, 15min) to analyze intraday momentum before the US30 index reflects the shift.
⏱ Timeframe Input
Select any minute-based timeframe (1–240 min) to suit your trading strategy.
Each stock’s trend data is fetched using your selected timeframe, so you can zoom in or out on price action dynamics.
It is recommended to select the timeframe closer to the chart timeframe in the indicator.
🚀 Key Features
✅ Component-Based Analysis: Tracks all 30 Dow stocks like MSFT, AAPL, GS, etc., with real-time price and indicator updates.
✅ Trend Detection: Uses EMA (8/34) crossover to determine bullish or bearish trends per stock.
✅ Momentum Signals: Shows RSI (14) values and MACD direction (▲ / ▼) for each stock.
✅ Color-Coded Dashboard:
🟩 Green = Bullish trend
🟥 Red = Bearish trend
✅ Compact Display: See 30 stocks in a 3-column grid format, updated every few bars for performance.
🧠 Pro Tips
🔍 Use shorter timeframes (1–5 min) to detect early trend shifts—perfect for scalping and intraday entries.
💼 Watch high-weight stocks like GS, MSFT, UNH. A shift in their trend often precedes index movement.
🎯 Combine with price action or SMC tools to confirm institutional moves and breakouts.
🚦 If most of the dashboard turns green/red at once, it often signals a strong momentum breakout or reversal.
💡 Ideal For:
Index traders (US30/DJI futures or CFDs)
Scalpers & day traders
Momentum and trend-following strategies
Traders who want to see the story behind the index move
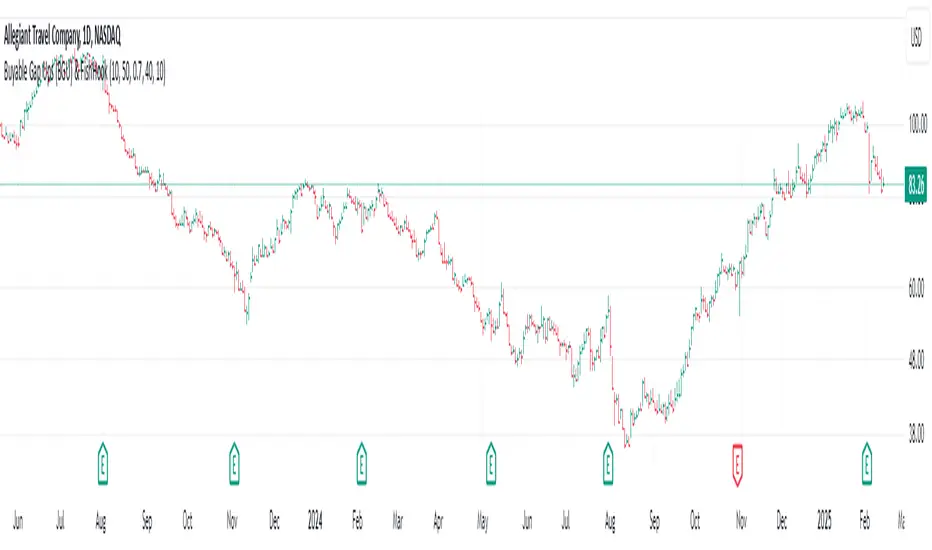
Buyable Gap Ups (BGU) ScreenerBuyable Gap Ups (BGU) Screener
This custom indicator detects Buyable Gap Ups (BGU), designed to identify stocks with significant price movements driven by gap-ups, often signaling strong bullish momentum. It helps traders spot potential opportunities where a stock has gapped up above the previous day's high with increased volume, suggesting the possibility of continued price strength.
Key Features:
Gap Percentage Threshold: Set a minimum gap percentage required for a valid buyable gap-up.
Volume Change Threshold: Identifies gap-ups accompanied by a significant increase in volume compared to the 50-day average.
ATR-Based Gap Detection (Optional): Use Average True Range (ATR) to determine whether the gap is large enough, factoring in recent volatility.
Customizable Lookback Period: Adjust the number of recent bars to track the frequency of BGU occurrences.
Volume Confirmation: Only signals buyable gaps when volume surpasses a defined threshold above the 50-day average.
Input Parameters:
Gap Percentage Threshold: Adjusts the minimum percentage gap for a valid signal.
Volume Change Threshold: Determines the minimum percentage increase in volume compared to the 50-day moving average.
Use ATR Gap: Option to use ATR to determine the minimum gap size instead of the percentage gap.
ATR Multiplier for Gap: Customizes the gap size based on the ATR.
ATR Length: Adjusts the lookback period for calculating ATR.
Lookback Period for BGU: Set the number of bars over which to calculate the BGU count.
Alerts & Signals:
The script will plot signals below bars where a valid BGU condition is met.
Alerts can be set for when a BGU is detected, giving real-time notifications for potential trading opportunities.
This indicator is designed to help traders find stocks showing strong bullish momentum, especially after earnings or other market-moving events, with the potential for continued uptrend. It is ideal for those looking to incorporate gap-based strategies in their trading.
[Spinn] ATH ScreenerThe indicator helps visualize the market’s state as a kind of heatmap, showing how far coins are from their all-time highs (ATH).
Since TradingView has a limitation on the number of coins processed simultaneously (no more than 40), all coins are divided into sets of 40 coins per set. If you place multiple copies of the indicator on the chart and assign a different set number in each copy, you can see the full picture for the exchange or the entire market.
The screener displays a table indicating the set number and the base currency (default is USDT).
For each coin, the following data is provided:
its name;
the distance from the current price to the ATH in percentage;
a 🔹 icon marks new coins (with a short price history);
coins that recently reached their ATH or ATL are highlighted in bold;
the background is colored as follows:
green — when less than 40% remains to the ATH;
red — when more than 60% remains;
blue — between 40% and 60%;
gray — when no data is available.
Hovering over a coin displays its name, current price, ATH and ATL values, and how many days ago they were reached.
Settings
Coin set number
Base currency (USDT)
Exchange
List of all coins on the exchange (comma-separated)*
No overlaps — if this option is enabled, tables with different sets will be placed one below the other.
Sorted — if this option is enabled, coins in the set will be sorted by their distance from ATH.
Colorize — whether to color the cell background with the specified colors or leave it light gray.
Bold ATH or ATL, days back — highlight coins in bold that recently reached an extreme (number of days is configurable).
New coins (🔹), days — mark young coins with a short price history using an icon (number of days is configurable).
Table width, % — approximate table width as a percentage of screen width.
Text size — text size in the table, from 1 to 3.
*Note: The default list was up-to-date at the time of the indicator’s publication. If certain coins are no longer traded, they will be marked with a dark gray background (no data).
Recommendation: to prevent the graph from obscuring the data, I recommend hiding it. This is done in the Object Tree, on the right side of the panel.
—
Индикатор помогает увидеть состояние рынка в виде своеобразной тепловой карты — как далеко монеты находятся от своих исторических максимумов (ATH).
Поскольку у TradingView есть ограничение на количество одновременно обрабатываемых монет (не более 40), все монеты разбиты на наборы по 40 монет в каждом. Если разместить на графике несколько копий индикатора и в каждой копии задать свой номер набора монет, можно видеть всю картину по бирже или рынку целиком.
Скринер выводит на экран таблицу с указанием номера набора монет и базовой валюты (по умолчанию — USDT).
Для каждой монеты указаны следующие данные:
её название;
расстояние от текущей цены до ATH в процентах;
значком 🔹 выделены новые монеты (с короткой историей графика);
жирным шрифтом выделены монеты, у которых ATH или ATL был достигнут недавно;
фон окрашен в такие оттенки:
зелёные — когда до ATH осталось менее 40%;
красные — более 60%;
голубые — между 40% и 60%;
серые — когда нет данных.
Если навести курсор на монету, будут показаны её название, текущая цена, значения ATH и ATL, а также сколько дней назад они были достигнуты.
Настройки
Номер набора монет
Базовая монета (USDT)
Биржа
Список всех монет на бирже (через запятую)*
No overlaps — если эта опция выделена, таблицы с разными наборами будут размещены одна под другой.
Sorted — если эта опция отмечена, монеты в наборе будут отсортированы по удалению от ATH.
Colorize — окрашивать ли фон ячеек в указанные выше цвета или оставить его светло-серым.
Bold ATH or ATL, days back — выделять жирным монеты, у которых недавно был достигнут экстремум (задаётся количество дней).
New coins (🔹), days — выделять значком молодые монеты, история графика которых небольшая (задаётся количество дней).
Table width, % — задаётся приблизительная ширина таблицы в процентах от ширины экрана.
Text size — размер текста в таблице, от 1 до 3.
*Примечание: заданный по умолчанию список был актуален на момент публикации индикатора. Если какие-то монеты перестали торговаться, они будут отмечены тёмно-серым фоном (нет данных).
Рекомендация: для того, чтобы график не заслонял данные, рекомендую его скрыть. Делается это в Дереве объектов, справа на панели.
