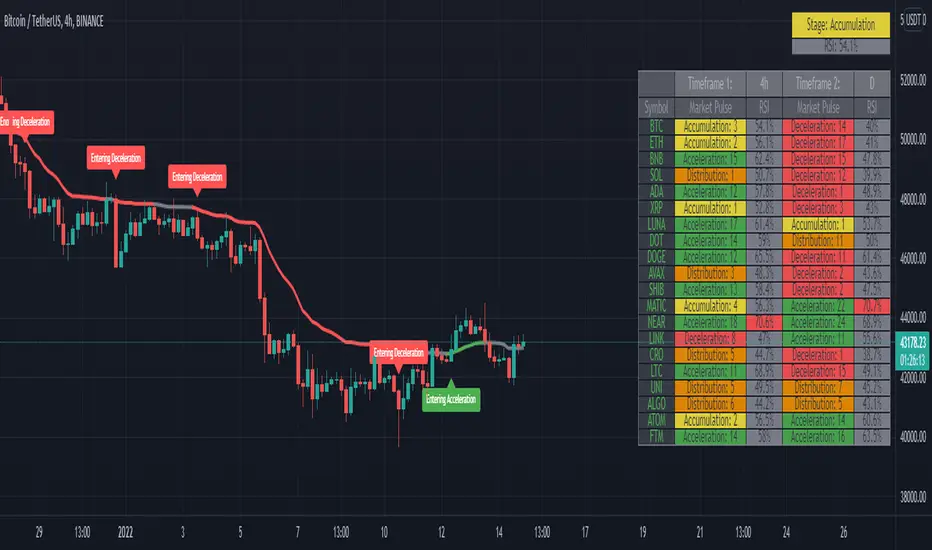
Market PulseBINANCE:BTCUSDT
This is the "Market Pulse" indicator from TOS Indicators.
The scope of this indicator is to identify which one of the four market stages we're in
█ WHAT ARE THE 4 STAGES?
ACCELERATION (or uptrend)
DECELERATION (or downtrend)
ACCUMULATION (occurs after the market has presumably found a bottom and buyers are coming in)
DISTRIBUTION (occurs after the market has presumably found a top and sellers are coming in)
█ WHAT ARE THE TOOLS THAT IT USES TO IDENTIFY THEM?
3 VWMA (Volume Weighted Moving Average)
1 VMA (Variable Moving Average)
VWMA = is a moving average which takes volume into account, and gives closes with higher volume an higher weight
vwma(src, len) => ta.sma(src * volume, len) / ta.sma(volume, len)
VMA = is a moving average which automatically adjusts the smoothing constant using Market Volatility
vma(src, len) =>
vi = ta.cmo(src, len) / 100
alpha = 2 / (len + 1) * math.abs(vi)
vma = 0.0
vma := alpha * src + nz(vma ) * (1 - alpha)
█ HOW CAN I INTERPRET THE INDICATOR?
1) On the top right you can see a box which tells you the Market Stage of the chart you are currently using:
If VWMA8 > VWMA21 > VWMA34 it signals ACCELERATION, color coded in green
If VWMA8 < VWMA21 < VWMA34 it signals DECELERATION, color coded in red
If neither of the previous two conditions are met it signals ACCUMULATION (yellow) if price closes above the VMA and DISTRIBUTION (orange) if price closes below the VMA
2) Next you have the actual VMA which is the line plotted on the chart and color coded in green, red or gray accordingly to the Market Stage with a filter applied:
for a bullish signal (green label) the market needs to be in ACCELERATION and price must be above the VMA
for a bearish signal (red label) the market needs to be in DECELERATION and price must be below the VMA
This characteristic makes it sometimes slower at giving direction indications, but also makes it more suitable to be considered as actual signals for buying and selling
ACCUMULATION and DISTRIBUTION are both rapresented with color gray, if you want you can consider:
the line going from green to gray as ACCUMULATION, your bias is bullish until the line turns red
the line going from red to gray as DISTRIBUTION, your bias is bearish until the line turns green
3) Then you can choose to plot the 3 VWMA to indentify pullbacks and entries for your trades
4) Finally you have the Market Screener, which you can choose to plot and gives a fast look to the markets you are interested on
It basically gives you the Market Stage for every Symbol you choose using the timeframes you input
The maximum number of Symbols you can set is 20, and for all of them you have 2 different timeframes you can choose to analyse.
By default the Symbols are set to the top 20 Cryptocurrency by Market Cap, and the timeframes to 4h and D
There is an option which is on by default and color codes ACCUMULATION and DISTRIBUTION the same as the box on the top right, you can turn it off to make them gray
As I've written in the tooltip inside the indicator you should only use the screener to analyse timeframes which are equal or higher than the one you are currently on your chart.
If you don't plan to use the screener you can delete every symbol from the input boxes to make the indicator update faster when changing timeframe or market.
Be aware that the screener is on BETA and may give repainting signals!
Cari dalam skrip untuk "screener"
JOEJOE VOLUME UNIVERSAL 03112025A universal volume screener that identifies when institutions are aggressively buying a stock by comparing current activity to recent averages, then recommends position sizing based on signal strength.
JOEJOE SHARK INDICATOR - Summary
🎯 Purpose
A volume-based screener that detects institutional buying activity and high-conviction trading opportunities across all global markets (Malaysia, US, Crypto).
📊 What It Does
Identifies 4 Types of Signals:
🟣 Purple Bar (A+ / High Conviction) - Best signal: Both institutional buying AND buy value surge detected
🟡 Yellow Bar (Buy Value Surge) - Strong money inflow detected
🔵 Blue Bar (Institutional Buying) - Large volume with strong buyer control
🟢🔴 Green/Red Bars - Normal volume (no special signal)
🔍 Key Innovation
Universal Design:
Works on ANY market without code changes
Uses relative comparisons (2.5x average) instead of fixed thresholds
Automatically adapts to each stock's normal behavior
Malaysian stocks, US stocks, Bitcoin - all use same logic
📈 Signal Detection Logic
Purple Bar Requirements (ALL must be met):
Volume exceeds 2x the 20-day average (institutional size)
Buy value exceeds 2.5x the 20-day average (money surge)
Price closes in top 30% of candle range (buyer strength)
Price above 50-period EMA (uptrend filter)
Short-term volume MA above long-term (sustained interest)
Candle body is at least 30% of range (decisive move)
Bullish candle (green)
⚙️ Customizable Settings
Signal Configuration:
Buy Value Surge Multiplier (default: 2.5x)
Volume Multiplier (default: 2.0x)
Buyer Strength Threshold (default: 0.7)
Lookback period (default: 20 bars)
Filters (All Toggle-able):
Trend filter with customizable MA length
Sustained interest filter (volume momentum)
Decisiveness filter (candle body size)
Option to require/not require bullish candles
Visual Customization:
All colors adjustable
Toggle markers and dashboard on/off
Volume MA display options
📊 Smart Position Sizing Feature
Calculates Signal Strength (0-100):
Combines Volume Ratio score + Buy Value Ratio score
Higher ratios = higher strength
Position Size Recommendations:
80-100 → 🔥 FULL SIZE (maximum confidence)
60-79 → 75% position (high confidence)
40-59 → 50% position (moderate confidence)
0-39 → 25% position or skip (low confidence)
Purpose: Not all A+ signals are equal - size your position based on actual signal quality
📱 Enhanced Dashboard Display
When High Conviction Signal Active:
Signal status (Active/Inactive)
Signal strength score with emoji indicator
Volume ratio (e.g., 3.2x)
Buy value ratio (e.g., 4.1x)
R/R ratio placeholder (future enhancement)
Position size recommendation with color coding
Visual Indicators:
Blue triangle "A+" marker at chart top
Color-coded position size backgrounds
Professional bordered table
All text in bright blue for visibility
🔔 Alert System
3 Alert Types:
High Conviction Signal (purple bar)
Buy Value Surge (yellow bar)
Institutional Buying (blue bar)
Alert Messages Include:
Ticker symbol
Current price
Signal type with emoji
💡 Screening Workflow
Multi-Chart Setup:
Open 4x4 or 6x3 chart grid
Load watchlist of stocks
Apply indicator to all charts
Scan top-right corners for active signals
Look for blue "A+" triangles at chart tops
Check signal strength scores
Focus on stocks with 80+ scores
🎓 Best Practices
Recommended Settings by Market:
Bursa Malaysia:
Buy Value Multiplier: 2.0-2.5
Volume Multiplier: 2.0
Timeframe: Daily
US Stocks (NYSE/NASDAQ):
Buy Value Multiplier: 2.5-3.5
Volume Multiplier: 2.5
Timeframe: Daily or 4H
Bitcoin/Crypto:
Buy Value Multiplier: 3.5-5.0
Volume Multiplier: 2.5-3.5
Timeframe: Daily or 4H
⚡ Key Advantages
Objective - Based on volume and price data, not subjective patterns
Universal - One indicator for all markets
Adaptive - Compares each stock to its own history
Risk-Aware - Built-in position sizing logic
Screener-Ready - Visual tools for scanning multiple charts
Filter-Heavy - Multiple filters reduce false signals
Customizable - Every parameter adjustable through settings
🚫 What It Doesn't Do
No price targets or stop losses
No prediction of how high price will go
No guarantee of profitability
Doesn't tell you when to exit
Doesn't account for fundamentals or news
R/R ratio currently a placeholder
🎯 Ideal Use Cases
✅ Swing trading - Catching institutional accumulation phases
✅ Stock screening - Finding high-conviction setups in watchlists
✅ Position sizing - Scaling in based on signal quality
✅ Multi-market trading - One tool for Malaysia, US, crypto
✅ End-of-day analysis - Daily timeframe scanning
❌ NOT ideal for:
Scalping (too much noise on low timeframes)
Short selling (designed for long signals)
Range-bound markets (requires uptrend)

High Volume & Near All-Time HighThe **High Volume & Near All-Time High Screener** is a simple yet powerful Pine Script tool designed to help traders identify stocks showing strong price momentum and trading activity. This screener automatically scans multiple tickers that you define in the settings and highlights those meeting two key conditions — daily trading volume greater than **500,000 shares** and the closing price being **within a set percentage (default 2%) of its all-time high**. The results are displayed in an easy-to-read table directly on your chart, making it ideal for traders who want to quickly spot potential breakout stocks without switching between multiple charts.
**How to Use:**
To use this script, open your **TradingView Pine Editor**, paste the code, and click **“Add to Chart.”** Make sure your chart is set to the **Daily timeframe (1D)**, as the script pulls daily data automatically. You can customize the list of symbols, the minimum volume threshold, and the proximity percentage in the settings panel to match your trading style. Once added, the screener will display a table on the right side of your chart showing each symbol, its latest closing price, and whether it currently meets the breakout conditions. A ✅ mark indicates that the stock meets both criteria. This tool works best for swing traders and momentum investors who want to focus on high-volume stocks nearing new highs for potential entries.

Deviation Rate Crash SignalDescription
This indicator provides entry signals for contrarian trades that aim to capture rebounds after sharp declines, such as during market crashes.
A signal is triggered when the deviation rate from the 25-day moving average falls below -25% (default setting). On the chart, a red circle is displayed below the candlestick to indicate the signal.
Backtest (2000–2024, Nikkei 225 stocks):
Win rate: 64.73%
Payoff ratio: 1.141
Probability of ruin: 0.0% (with proper risk control)
Trading Rules (Long only):
Entry: Market buy at next day’s open when the closing price is 25% or more below the 25-day MA.
Exit: Market sell at next day’s open when:
The closing price is 10% above the entry price (take profit), or
The closing price is 10% below the entry price (stop loss), or
40 days have passed since entry.
Notes:
This indicator is tuned for crisis periods (e.g., 2008 Lehman Shock, 2011 Great East Japan Earthquake, 2020 COVID-19 crash, 2024 Yen carry trade reversal).
In normal market conditions, signals will be rare.
Pine Screener BETA Support:
Add this indicator to your favorites and scan with long condition = true.
Screener results display both the MA deviation rate and current price.
When multiple signals occur, use the deviation rate as a reference to prioritize setups.
説明
このインジケーターは、暴落時など短期間で急落した銘柄のリバウンドを狙う逆張りトレードのエントリーシグナルを提供します。
25日移動平均線からの乖離率が -25% を下回ったときにシグナルが点灯します(初期設定)。シグナルはメインチャートのローソク足の下に赤い丸印で表示されます。
バックテスト結果(2000~2024年、日経225銘柄):
勝率: 64.73%
ペイオフレシオ: 1.141
破産確率: 0.0%(適切なリスク管理を行った場合)
トレードルール(買いのみ):
エントリー: 終値が25日移動平均線から25%以上下方乖離した場合、翌日の寄り付きで成行買い。
手仕舞い: 翌日の寄り付きで成行売り(以下のいずれかの条件を満たした場合)
終値が買値より10%以上上昇(利確)
終値が買値より10%以上下落(損切り)
エントリーから40日経過
注意点:
このインジケーターは、2008年リーマンショック、2011年東日本大震災、2020年コロナショック、2024年円キャリートレード巻き戻しショックなど、危機的局面で効果を発揮するように調整されています。
通常の相場ではシグナルはほとんど出現しません。
Pine Screener BETA 対応:
このインジケーターをお気に入り登録し、long condition = true をフィルター条件にしてスキャンしてください。
スクリーナー結果には移動平均乖離率と現在値が表示されます。
シグナルが同時に多数出現した場合は、移動平均乖離率を参考に優先順位をつけてください。

Day 3 PlayDay 3 Play — Indicator Summary
The Day 3 Play indicator is designed to identify outsized moves on Day 1 with a consolidation on Day 2 and are primed for a breakout on Day 3.
Day-1: A stock makes an outsized move (configurable, default = ±3% from prior close) on above-average relative volume (default = ≥3× 30-day average).
Day-2: The stock consolidates inside the Day-1 range (an inside bar).
Day-3: Price is primed for a breakout beyond the Day-2 high (bullish) or Day-2 low (bearish).
How It Works in the Pine Screener
The script computes Day-1 moves, Day-2 ranges, and checks volume requirements in the daily timeframe.
In the Screener, add a watchlist that includes your custom list of stocks. Then, add the custom Day 3 Play indicator. Select the time frame and the parameters from the indicator.
Screener columns (hidden by default) report whether a setup is found, whether it’s bullish or bearish, and the precise trigger/offset levels.
Alerts and Offsets
Alerts are available for:
Breakout at the Day-2 high/low (the trigger).
Approaching within an offset (configurable, default = 0.25%) from the Day-2 high or low.
This lets you catch moves as they’re forming intraday, even in extended hours, and not just after the breakout occurs.
Customization
Thresholds: Adjust the Day-1 % move (default 3%) and minimum relative volume (default 3×).
Alert Offset: Change the proximity level (default 0.25%) where alerts should fire before the breakout.
Visibility: Toggle chart lines (levels and offsets) and a debug panel separately.
Lookback: Control how many past days are scanned for the most recent valid setup.
On-Chart Levels
Day-2 High/Low: Shown as reference levels.
Bull/Bear Level: The breakout level (Day-2 high or low depending on setup).
Alert Offset Lines: Offset from the breakout level by your chosen % for early alerts.
Key Calculations
Relative Volume (RVOL): Day-1 volume ÷ 30-day average (excluding the day itself).
Inside Bar: Day-2 high ≤ Day-1 high and Day-2 low ≥ Day-1 low.
Breakout Levels:
Bullish = Day-2 High (with offset below).
Bearish = Day-2 Low (with offset above).

Bar TimeBar Time is a simple utility for traders who rely on backtesting, Bar Replay, and detailed price action analysis. It solves a common but frustrating problem: knowing the exact time of the bar you are looking at.
While most time indicators show your computer's live clock time, this tool displays the bar's own timestamp, perfectly synchronized with your chart's data and timezone.
Why Is This Important?
When you are deep in a Bar Replay session or analyzing a historical setup, the live clock is irrelevant. You need to know when that critical breakout or reversal candle actually happened. Was it during the pre-market? At the London open? In the last five minutes of the US session? This indicator provides that vital context instantly, without you needing to squint at the small print on the x-axis.
Key Use Cases
1. Mastering Bar Replay
As you click through bars in Replay mode, the displayed time updates with each new bar. This allows you to simulate a live trading session with full awareness of the time of day, helping you train your decision-making under more realistic conditions.
2. Analyzing Screener Signals
This is one of the most powerful uses. Imagine your screener finds a "BUY" signal on a stock from two bars ago. You switch to that stock's chart to investigate. Instead of hunting for the exact bar, this tool instantly shows you the date and time of the bar you are currently hovering over. It dramatically speeds up the workflow of moving from a screener alert to actionable analysis.
3. Detailed Price Action Study
Quickly identify key session timings, see how price reacts to news events at a specific time, or analyze intraday volume patterns with complete temporal clarity.
Features & Customization
The tool is designed to be lightweight, efficient, and fully customizable to match your charting environment.
Timezone-Aware Accuracy: Automatically detects your chart's timezone for a perfect match between the label and the x-axis.
Fully Customizable Position: Place the time display in any of nine screen positions (e.g., Top Left, Bottom Center) using a simple dropdown menu.
Custom Colors: Easily set the background and text colors to blend seamlessly with your chart's theme.
OC損益率 (%)This Pine Script indicator computes the percentage change from the daily open price to the daily close price and exposes it as a custom column for TradingView’s Stock Screener and Watchlist. By enabling screener compatibility, the script automatically calculates:
ocRet = (close - open) / open * 100
for each bar and plots the result. Once published (as a public or protected script), you can add the OC損益率 (%) column in your Watchlist or Stock Screener 2.0 → Columns → Custom, allowing you to sort, filter, and export symbols based on their intraday return.
Pristine Volume AnalysisThe Pristine Volume Analysis indicator organizes volume, liquidity, and share structure data, allowing users to quickly gauge the relative volume a security is trading on, and whether it is liquid enough to trade🏆
Volume is an important metric to track when trading, because abnormally high volume tends to occur when a new trend is kicking off, or when an established trend is hitting a climax.
Track only the most important metrics, reducing mental clutter and noise:
▪ Volume run rate - Candle volume/ Avg candle volume
▪ Security liquidity - Average volume and average dollar volume
▪ Float rotation - Candle volume/ Float
This script automatically detects and flags the following conditions on volume bars:
▪ High volume run rate buying/selling based on user-defined thresholds
▪ HVE (highest volume ever) & HVY (highest volume in a year)
▪ High float rotation based on user-defined thresholds
Settings and Preferences
Customize this script based by setting preferred colors and thresholds:
Custom Alerts on HVE and HVY
Set custom alerts on a single equity or an entire watchlist to receive notifications when volume hits HVE or HVY.
Screen for HVE or HVY
Using the Pine Screener, scan watchlists for equities that have reached HVE or HVY.
Note: The Pine Screener is limited to calculations on the last 500 bars. If a symbol has less than 500 bars and has reached HVE, it will be included in the screener results. All symbols with more than 500 historical bars will not be included in the scan.
Volume Analysis Use Case : Confirming a breakout (1/3)
A high volume run rate as a stock breaks out to new highs can confirm a change of character and increase the odds of success on long setups. SMCI put in an HVE candle in January '24, sparking a super-performance run.
1-Month follow-through +137%
SMCI had plenty of gas left in the tank after putting in it's first HVE candle. The rest is history!
Volume Analysis Use Case : Gauging sentiment (2/3)
When a stock advances on repeated high run rate volume and an increasing angle of ascent (parabolic) , it can be a good indication that sentiment is overheated and it is time to reduce exposure to the stock.
Note:25% is the default float rotation threshold. This value can be customized based on your own trading style and preferences.
Following the parabolic ascent on high volume run rate and float rotation, HIMS topped, falling ~67% over the next two months!
Volume Analysis Use Case : Passing on a meme stock (3/3)
High float rotation often goes hand-in-hand with high stock volatility. One might opt out of trading a stock if it is outside their risk tolerance.

Order Block Matrix [Alpha Extract]The Order Block Matrix indicator identifies and visualizes key supply and demand zones on your chart, helping traders recognize potential reversal points and high-probability trading setups.
This tool helps traders:
Visualize key order blocks with volume profile histograms showing liquidity distribution.
Identify high-volume price levels where institutional activity occurs.
rank historical order blocks and analyze their strength based on volume.
Receive alerts for potential trading opportunities based on price-block interactions.
🔶 CALCULATION
The indicator processes chart data to identify and analyze order blocks:
Order Block Detection
Inputs:
Price action patterns (consolidation areas followed by breakouts).
Volume data from current and lower timeframes.
User-defined lookback periods and thresholds.
Detection Logic:
Identifies consolidation areas using a dynamic range comparison.
Confirms breakout patterns with percentage threshold validation.
Maps volume distribution across price levels within each order block.
🔶Volume Analysis
Volume Profiling:
Divides each order block into configurable grid segments.
Maps volume distribution across price segments within blocks.
Highlights zones with highest volume concentration.
Strength Assessment:
Calculates total block volume and relative strength metrics.
Compares block volume to historical averages.
Determines probability of reversal based on volume patterns.
isConsolidation(len) =>
high_range = ta.highest(high, len) - ta.lowest(high, len)
low_range = ta.highest(low, len) - ta.lowest(low, len)
avg_range = (high_range + low_range) / 2
current_range = high - low
current_range <= avg_range * (1 + obThreshold)
🔶 DETAILS
Visual Features
Volume Profile Histograms:
Color-coded bars showing volume concentration within order blocks.
Gradient coloring based on relative volume (high volume = brighter colors).
Bull blocks (green/teal) and bear blocks (red) with varying opacity.
Block Visualization:
Dynamic box sizing based on volume concentration.
Optional block borders and background fills.
Volume labels showing total block volume.
Screener Table:
Real-time analysis of order block metrics.
Shows block direction, proximity, retest count, and volume metrics.
Color-coded for quick reference.
Interpretation
High Volume Areas: Zones with institutional interest and potential reversal points.
Block Direction: Bullish blocks typically support price, bearish blocks typically resist price.
Retests: Multiple tests of an order block may strengthen or weaken its influence.
Block Age: Newer blocks often have stronger influence than older ones.
Volume Concentration: Brightest segments within blocks represent the highest volume areas.
🔶 EXAMPLES
The indicator helps identify key trading opportunities:
Bullish Order Blocks
Support Zones: Identify strong support levels where price is likely to bounce.
Breakout Confirmation: Validate breakouts with volume analysis to avoid false moves.
Retest Strategies: Enter trades when price retests a bullish order block with high volume.
Bearish Order Blocks
Resistance Zones: Identify strong resistance levels where price is likely to reverse.
Distribution Areas: Detect zones where smart money is distributing to retail.
Short Opportunities: Find optimal short entry points at high-volume bearish blocks.
Combined Strategies
Order Block Stacking: Multiple aligned blocks create stronger support/resistance zones.
Block Mitigation: When price breaks through a block, it often indicates a strong trend continuation.
Volume Profile Applications: Higher volume segments provide more precise entry and exit points.
🔶 SETTINGS
Customization Options
Order Block Detection:
Consolidation Lookback: Adjust the period for consolidation detection.
Breakout Threshold: Set minimum percentage for breakout confirmation.
Historical Lookback Limit: Control how far back to scan for historical order blocks.
Maximum Order Blocks: Limit the number of visible blocks on the chart.
Visual Style:
Grid Segments: Adjust the number of volume profile segments.
Extend Blocks to Right: Enable/disable extending blocks to current price.
Show Block Borders: Toggle border visibility.
Border Width: Adjust thickness of block borders.
Show Volume Text: Enable/disable volume labels.
Volume Text Position: Control placement of volume labels.
Color Settings:
Bullish High/Low Volume Colors: Customize appearance of bullish blocks.
Bearish High/Low Volume Colors: Customize appearance of bearish blocks.
Border Color: Set color for block outlines.
Background Fill: Adjust color and transparency of block backgrounds.
Volume Text Color: Customize label appearance.
Screener Table:
Show Screener Table: Toggle table visibility.
Table Position: Select positioning on the chart.
Table Size: Adjust display size.
The Order Block Matrix indicator provides traders with powerful insights into market structure, helping to identify key levels where smart money is active and where high-probability trading opportunities may exist.

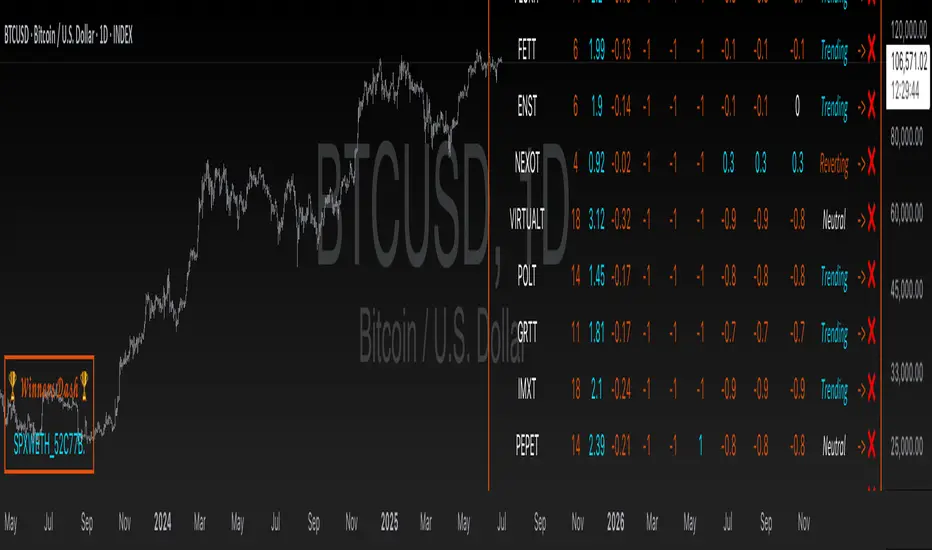
Altitude Alpha | QuantEdgeB✨ Altitude Alpha | Altcoin Screener by QuantEdgeB ✨
1. Objective
Altitude Alpha is a quantitative altcoin screener designed to systematically identify the strongest outperforming assets from a universe of 20 selected altcoins. With 7 layered filters and a robust scoring engine, this system empowers traders to focus only on high-potential candidates, eliminating guesswork and emotional bias and maximize opportunity cost.
2. 🧠 Purpose & Core Philosophy
The primary goal of Altitude Alpha is not to trigger buy or sell signals, but to highlight where strength is concentrated in the altcoin space. In the most volatile and noisy market environment, relative strength is your compass. By identifying coins that not only outperform their peers but also meet trend, volatility, and statistical benchmarks, Altitude Alpha becomes your strategic alpha-finder.
💡 Winners are displayed visually and intuitively in the “🏆 Winners Dash” table at the bottom left.
3. ⚙️ What Makes It Powerful?
Altitude Alpha uses a multi-dimensional 7-filter scoring model built around these components:
🔹 1. Relative Strength Matrix
Each altcoin is scored relative to all others in the pool using pairwise strength logic. The result: the strongest of the strong rise to the top.
🔹 2. Trend Structure
Three independent trend assessments are used to validate the momentum. A coin must sustain multi-angle trend agreement to pass.
🔹 3. Regime Filter
Filters out noisy environments. Only coins in “Trending” or strong “Neutral” regimes are considered.
🔹 4. Beta Screening
Measures each asset’s sensitivity compared to the broader market (BTC Index by default). Higher beta = higher potential volatility-based opportunity.
🔹 5. Alpha Screening
Only assets showing positive alpha—returns exceeding what their beta would explain—are considered worthy of your attention.
🔹 6. Composite Score Threshold
Trend + Regime + Alpha/Beta strength must all align for a coin to qualify.
🔹 7. Top N Rank Filter
Customize your scope: allocate to top 1, 2, 3...5 ranked altcoins dynamically, based on their total composite score.
4. 🧪 Backtest Mode Explained
Altitude Alpha includes an optional backtest simulation, allocating capital to the currently top-ranked assets. This model applies equal-weight dynamic allocation to assets that pass all filters.
⚠️ Disclaimer:
1. While the backtest feature demonstrates performance potential, this is not the recommended live trading mode. The best use-case for Altitude Alpha is asset selection, not execution. Combine it with your personal trading edge or system for superior risk/reward and entry timing.
2. Past performance is not indicative of future performance. Always conduct your own research before investing!
5. ✅ Recommended Use
• Use Altitude Alpha to scan for the best-performing altcoins.
• Select 1–3 assets from the “🏆 Winners Dash” panel.
• Apply your own entry strategy or confirmation setup (e.g., price action, strategies, valution alignment, market structure, etc.)
• Only allocate capital when your personal system confirms opportunity.
• You may optionally allocate based on the system itself—just be aware this introduces higher exposure and risk.
6. 🧬 Customization Features
• 🖌️ Multiple color palettes (Strategy, Solar, Warm, Cool, etc.)
• 🌓 Text readability toggles (Dark/Light)
• 🔢 Adjustable Alpha/Beta periods and benchmark (BTC by default)
• 🔁 Allocation rank selection (Top 1–5)
7. 📈 Visual Output & Dashboards
• 🔍 Altitude Alpha Dashboard — Complete transparency into ranks, trends, scores, and regimes.
• 🏆 Winners Dash Table — Clean, minimal summary of top-selected altcoins.
• 📊 Backtest Panel — Equity curve and stats (Sharpe, Sortino, Omega, Max Drawdown).
• 🌌 Futuristic Glow Plotting — High-contrast equity visuals with layered gradients.
Conclusion & Key Highlights
Altitude Alpha is not just a screener—it's a precision instrument designed to cut through market noise and systematically reveal where true strength lies in the altcoin universe.
While most traders are busy chasing hype, Altitude Alpha offers clarity through quantitative filtration. It’s not about timing the perfect entry. It’s about focusing attention on the highest-potential coins, so you never waste energy on underperformers again.
📌 Key Takeaways:
🧭 Purpose-Built-> Helps identify the strongest altcoin out of 20 dynamically.
🧮 7-Layer Filter Logic-> Combines trend, regime, alpha, beta, and composite strength into one decision engine.
📊 Winners Dash Panel-> Clean display of current top performers — no noise, just output.
⚙️ Backtest Feature-> Optional equity curve based on rotating into ranked leaders (educational use).
🔎 Customizable Framework-> Tweak ranking depth, visual style, and filter sensitivity.
✅ Best Use Case ->Select strong coins, then apply your own entry strategy - maximize risk/reward.
📌 Trade with Statistical Precision | Powered by QuantEdgeB
🔹 Disclaimer: Past performance is not indicative of future results.
🔹 Strategic Advice: Always backtest, optimize, and align parameters with your trading objectives and risk tolerance before live trading.
Swing Trade TarayıcıSwing Trade Scanner (v6) User Guide
1. Purpose:
This TradingView indicator (written in Pine Script v6) is designed to help identify swing trading opportunities. It calculates an overall trend strength and direction score by combining multiple technical analyses for up to 20 financial assets (stocks, cryptocurrencies, forex, etc.) that you specify. It presents the results in a customizable table, allowing you to quickly scan the market.
2. Analyses Used and Their Roles:
By default, the indicator uses the following 4 main technical analyses:
EMA Crossover (Default: 9/21): Used to capture short-term trend direction and potential momentum shifts. When the fast EMA (9) crosses above the slow EMA (21), it's considered a bullish signal; when it crosses below, it's a bearish signal. It's often one of the main entry/exit triggers.
RSI (Relative Strength Index - Default: 14): Measures the speed of price movements to identify overbought (OB) and oversold (OS) conditions. Reversals from the OB zone can signal potential downturns, while reversals from the OS zone can signal potential upturns. It also provides insight into the strength of the momentum.
MACD (Moving Average Convergence Divergence - Default: 12, 26, 9): A trend-following momentum indicator. The relationship between the MACD line and the signal line (crossovers) and the state of the histogram (position relative to the zero line) are used to confirm momentum shifts and trend strength.
ADX/DI (Average Directional Index - Default: 14, 14): Measures the strength (ADX) and direction (+DI/-DI lines) of a trend. Its main role is to filter signals from other indicators. A trend is considered to exist if the ADX is above a certain threshold (e.g., 25). +DI above -DI indicates an uptrend, and the reverse indicates a downtrend.
3. Scoring System:
The indicator calculates an individual score for each analysis and then combines these scores using weights you define to create a final Trend Score:
Individual Scores: Each analysis (EMA, RSI, MACD, ADX/DI) generates a decimal score between -1.0 (Strong Negative/Bearish) and +1.0 (Strong Positive/Bullish) based on its own rules. For example, RSI might score +1.0 if oversold, -1.0 if overbought, and 0.0 if neutral. MACD and ADX/DI scores can also take intermediate values reflecting both direction and strength (e.g., ±1.0, ±0.6, ±0.3, 0.0).
Weighting: In the settings, you can assign a weight (between 0.0 and 1.0) to each analysis, determining how much it influences the final score. For instance, you might give EMA crossover a higher weight and use RSI with a lower weight.
Total Score: The individual scores of the active analyses are multiplied by their assigned weights and summed up. This total is then divided by the sum of the weights of the active analyses to obtain a final, normalized Trend Score between -1.0 and +1.0. This score represents the combined view of all analyses.
4. Trend Determination:
The calculated final Trend Score is classified into an overall TREND status based on threshold values you set in the settings:
S.UP (Strong Up): Score > Strong Up Threshold (Default: 0.70)
UP: Up Threshold < Score <= Strong Up Threshold (Default: 0.35 < Score <= 0.70)
NEUTRAL: Down Threshold <= Score <= Up Threshold (Default: -0.35 <= Score <= 0.35)
DOWN: Strong Down Threshold <= Score < Down Threshold (Default: -0.70 <= Score < -0.35)
S.DOWN (Strong Down): Score < Strong Down Threshold (Default: -0.70)
This classification allows you to see at a glance which assets have strong trend potential.
5. Table Structure and Meanings:
The indicator displays the results in a table with the following columns:
TICKER: The symbol of the analyzed asset (abbreviated).
TREND: The overall trend status determined by the total score (S.UP, UP, NEUTRAL, DOWN, S.DOWN). The background color of this column also reflects this overall trend (Dark Green, Green, Gray, Red, Dark Red).
SCORE: The calculated weighted total score (between -1.00 and +1.00, with two decimal places). The background color of this column also reflects the overall trend.
EMA: Shows the result of only the EMA 9/21 analysis.
▲: EMA(9) > EMA(21) (Green Background)
▼: EMA(9) < EMA(21) (Red Background)
N: Neutral (Gray Background)
-: Analysis disabled or no data (Pale Gray Background)
RSI: Shows the result of only the RSI analysis.
OS: Oversold (RSI < 30) (Green Background)
M+: Mid Positive (30 <= RSI < 45) (Light Green/Lime Background)
N: Neutral (45 <= RSI <= 55) (Gray Background)
M-: Mid Negative (55 < RSI <= 70) (Orange Background)
OB: Overbought (RSI > 70) (Red Background)
-: Analysis disabled or no data (Pale Gray Background)
MACD: Shows the result of only the MACD analysis.
S+: Strong Positive (MACD > Signal AND Histogram > 0) (Green Background)
M+: Mid Positive (MACD > Signal BUT Histogram < 0) (Light Green/Lime Background)
N: Neutral (Other cases) (Gray Background)
M-: Mid Negative (MACD < Signal BUT Histogram > 0) (Orange Background)
S-: Strong Negative (MACD < Signal AND Histogram < 0) (Red Background)
-: Analysis disabled or no data (Pale Gray Background)
ADX/DI: Shows the result of only the ADX/DI analysis.
S+: Strong Uptrend (ADX > 40 AND +DI > -DI) (Green Background)
M+: Mid Uptrend (25 < ADX <= 40 AND +DI > -DI) (Light Green/Lime Background)
W: Weak Trend (ADX <= 25) (Gray Background)
M-: Mid Downtrend (25 < ADX <= 40 AND -DI > +DI) (Orange Background)
S-: Strong Downtrend (ADX > 40 AND -DI > +DI) (Red Background)
-: Analysis disabled or no data (Pale Gray Background)
6. Settings (Inputs):
You can customize the indicator's behavior using the following settings:
General Settings:
Analysis Timeframe: Select the timeframe for the scans (Leave blank to use the chart timeframe).
Auto Adjust Parameters and Weights: If checked, predefined parameters and weights based on the selected timeframe (1h, 4h, 1D, 1W) are used. If unchecked, or if an unsupported timeframe is selected, the manual settings below apply.
Strong/Normal Up/Down Thresholds: Adjust the score thresholds used to determine the TREND column.
Analysis Settings (Separate Group for Each Analysis):
Enable ... Analysis: Check to include the respective analysis in the score.
... Weight (Manual): If auto-adjust is off, set the weight of this analysis in the total score.
... Period/Level (Manual): If auto-adjust is off, adjust the parameters (period, level, etc.) of the respective indicator.
Symbols (1-10):
Checkbox: Check to include the respective symbol in the scan.
Text Box: Enter the symbol of the asset you want to analyze (e.g., "NASDAQ:AAPL", "BINANCE:BTCUSDT").
Table Settings:
Table Position: Choose where the table appears on the chart.
Cell Width: Adjust the width of the table cells.
Text Size: Select the general size of the text in the table (individual analysis columns are usually shown one size smaller).
7. How to Use:
Add the indicator to your TradingView chart.
Enter the indicator settings.
In the Symbols section, enter the symbols of the assets you want to analyze and check the boxes next to them.
In the General Settings section, select your desired Analysis Timeframe.
Decide whether the Auto Adjust Parameters and Weights option should be checked. If not, adjust the manual parameters and weights for each indicator in the Analysis Settings section according to your strategy.
Examine the table:
The TREND and SCORE columns give you a general overview. Focus on strong signals (S.UP, S.DOWN) or states that have just crossed thresholds (UP, DOWN).
The EMA, RSI, MACD, ADX/DI columns allow you to see in detail which analyses influenced the overall score. You can track confirming or conflicting signals here.
Combine these scan results with other rules of your swing trading strategy (support/resistance, patterns, risk management, etc.) to make trading decisions.
8. Important Notes:
This indicator does not constitute financial advice. It is merely a tool that combines technical analysis tools to help you scan the market.
The default parameters and weights in the indicator settings are for general use. For best results, it is strongly recommended that you optimize these settings by backtesting them on historical data according to your own strategy, the assets you trade, and market conditions.
No technical indicator or system generates 100% accurate signals. Always apply risk management principles and do not trade with money you cannot afford to lose.
I hope this guide helps you use the indicator effectively!

Democratic MultiAsset Strategy [BerlinCode42]Happy Trade,
Intro
Included Trade Concept
Included Indicators and Compare-Functions
Usage and Example
Settings Menu
Declaration for Tradingview House Rules on Script Publishing
Disclaimer
Conclusion
1. Intro
This is the first multi-asset strategy available on TradingView—a market breadth multi-asset trading strategy with integrated webhooks, backtesting capabilities, and essential strategy components like Take Profit, Stop Loss, Trailing, Hedging, Time & Session Filters, and Alerts.
How It Trades? At the start of each new bar, one asset from a set of eight is selected to go long or short. As long there is available cash and the selected asset meets the minimum criteria.
The selection process works through a voting system, similar to a democracy. Each asset is evaluated using up to five indicators that the user can choose. The asset with the highest overall voting score is picked for the trade. If no asset meets all criteria, no trade is executed, and the cash reserve remains untouched for future opportunities.
How to Set Up This Market Breadth Strategy:
Choose eight assets from the same market (e.g., cryptos or big tech stocks).
Select one to five indicators for the voting system.
Refine the strategy by adjusting Take Profit, Stop Loss, Hedging, Trailing, and Filters.
2. Voting as the included Trade Concept
The world of financial trading is filled with both risks and opportunities, and the key challenge is to identify the right opportunities, manage risks, and do both right on time.
There are countless indicators designed to spot opportunities and filter out risks, but no indicator is perfect—they only work statistically, hitting the right signals more often than the wrong ones.
The goal of this strategy is to increase the accuracy of these Indicators by:
Supervising a larger number of assets
Filtering out less promising opportunities
This is achieved through a voting system that compares indicator values across eight different assets. It doesn't just compare long trades—it also evaluates long vs. short positions to identify the most promising trade.
Why focus on one asset class? While you can randomly select assets from different asset classes, doing so prevents the algorithm from identifying the strongest asset within a single class. Think about, within one asset class there is often a major trend whereby different asset classes has not really such behavior.
And, you don’t necessarily need trading in multiple classes—this algorithm is designed to generate profits in both bullish and bearish markets. So when ever an asset class rise or fall the voting system ensure to jump on the strongest asset. So this focusing on one asset class is an integral part of this strategy. This all leads to more stable and robust trading results compared to handling each asset separately.
3. Included Indicators and Compare-Functions
You can choose from 17 different indicators, each offering different types of signals:
Some provide a directional signal
Some offer a simple on/off signal
Some provide both
Available Indicators: RSI, Stochastic RSI, MFI, Price, Volume, Volume Oscillator, Pressure, Bilson Gann Trend, Confluence, TDI, SMA, EMA, WMA, HMA, VWAP, ZLMA, T3MA
However, these indicators alone do not generate trade signals. To do so, they must be compared with thresholds or other indicators using specific comparison functions.
Example – RSI as a Trade Signal. The RSI provides a value between 0 and 100. A common interpretation is:
RSI over 80 → Signal to go short or exit a long trade
RSI under 20 → Signal to go long or exit a short trade
Here, two comparison functions and two thresholds are used to determine trade signals.
Below is the full set of available comparison functions, where: I represents the indicator’s value and A represents the comparator’s value.
I < A if I smaller A then trade signal
I > A if I bigger A then trade signal
I = A if I equal to A then trade signal
I != A if I not equal to A then trade signal
A <> B if I bigger A and I smaller B then trade signal
A >< B if I smaller A then long trade signal or if I bigger B then short trade signal
Image 1
In Image 1, you can see one of five input sections, where you define an indicator along with its function, comparator, and constants. For our RSI example, we select:
Indicator: RSI
Function: >< (greater/less than)
Comparator: Constant
Constants: A = 20, B = 80
With these settings a go short signal is triggered when RSI crosses above 80. And a go long signal is triggered when RSI crosses below 20.
Relative Strength Indicator: The RSI from the public TradingView library provides a directional trade signal. You can adjust the price source and period length in the indicator settings.
Stochastic Relative Strength Indicator: As above the Stoch RSI offers a trade signal with direction. It is calculated out of the RSI, the stochastic derivation and the SMA from the Tradingview library. You can set the in-going price source and the period length for the RSI, for the Stochastic Derivation and for the SMA as blurring in the Indicator settings section.
Money Flow Indicator: As above the MFI from the public Tradingview library offers a trade signal with direction. You can set the in-going price source and the period length in the Indicator settings section.
Price: The Price as Indicator is as simple as it can be. You can chose Open, High, Low or Close or combinations of them like HLC3 or even you can import an external Indicator. The absolute price or value can later be used to generate a trade signals when certain constant thresholds or other indicators signals are crossed.
Volume: Similar as above the Volume as Indicator offers the average volume as absolute value. You can set the period length for the smoothing and you can chose where it is presented in the base currency $ or is the other. For example the trade pair BTCUSD you can chose to present the value in $ or in BTC.
Volume Oscillator: The Volume Oscillator Indicator offers a value in the range of . Whereby a value close to 0 means that the volume is very low. A value around 1 means the volume is same high as before and Values higher as 1 means the volume is bigger then before. You can set the period length for the smoothing and you can chose where it is presented in the base currency $ or is the other. For example the trade pair BTCUSD you can chose to present the value in $ or in BTC.
Pressure Indicator: The Pressure is an adapted version of LazyBear's script (Squeeze Momentum Indicator) Pressure is a Filter that highlight bars before a bigger price move in any direction. The result are integer numbers between 0 and 4 whereby 0 means no bigger price move excepted, while 4 means huge price move expected. You can set the in-going price source and the period length in the Indicator settings section.
Bilson Gann Trend: The Bilson Gann Trend Indicator is a specific re-implementation of the widely known Bilson Gann Count Algorithm to detect Highs and Lows. On base of the last four Highs and Lows a trend direction can be calculated. It is based on 2 rules to confirm a local pivot candidate. When a local pivot candidate is confirmed, let it be a High then it looks for Lows to confirm. The result range is whereby -1 means down trend, 1 means uptrend and 0 sideways.
Confluence: The Confluence Indicator is a simplified version of Dale Legan's "Confluence" indicator written by Gary Fritz. It uses five SMAs with different periods lengths. Whereby the faster SMA get compared with the (slower) SMA with the next higher period lengths. Is the faster SMA smaller then the slower SMA then -1, otherwise +1. This is done with all SMAs and the final sum range between . Whereby values around 0 means price is going side way, Crossing under 0 means trend change from bull to bear. Is the value>2 means a strong bull trend and <-2 a strong bear trend.
Trades Dynamic Index: The TDI is an adapted version from the "Traders Dynamic Index" of LazyBear. The range of the result is whereby 2 means Top goShort, -2 means Bottom goLong, 0 is neutral, 1 is up trend, -1 is down trend.
Simple Moving Average: The SMA is the one from the Tradingview library. You can compare it with the last close price or any other moving average indicator to indicate up and down trends. You can set the in-going price source and the period length in the Indicator settings section.
Exponential Moving Average: The EMA as above is the one from the Tradingview library. You can compare it with the last close price or any other moving average indicator to indicate up and down trends. You can set the in-going price source and the period length in the Indicator settings section.
Weighted Moving Average: The WMA as above is the one from the Tradingview library. You can compare it with the last close price or any other moving average indicator to indicate up and down trends. You can set the in-going price source and the period length in the Indicator settings section.
Hull Moving Average: HMA as above is the one from the Tradingview library. You can compare it with the last close price or any other moving average indicator to indicate up and down trends. You can set the in-going price source and the period length in the Indicator settings section.
Volume Weighted Average Price: The VWAP as above is the one from the Tradingview library. You can compare it with the last close price or any other moving average indicator to indicate up and down trends. You can set the in-going price source in the Indicator settings section.
Zero Lag Moving Average: The ZLMA by John Ehlers and Ric Way describe in their paper: www.mesasoftware.com
As the other moving averages you can compare it with the last close price or any other moving average indicator to indicate up and down trends. You can set the in-going price source and the period length in the Indicator settings section.
T3 Moving Average: The T3MA is the one from the Tradingview library. You can compare it with the last close price or any other moving average indicator to indicate up and down trends. You can set the in-going price source, the period length and a factor in the Indicator settings section. Keep this factor at 1 and the T3MA swing in the same range as the input. Bigger 1 and it swings over. Factors close to 0 and the T3MA becomes a center line.
All MA's following the price. The function to compare any MA Indicators would be < or > to generate a trade direction. An example follows in the next section.
4. Example and Usage
In this section, you see how to set up the strategy using a simple example. This example was intentionally chosen at random and has not undergone any iterations to refine the trade results.
We use the RSI as the trade signal indicator and apply a filter using a combination of two moving averages (MAs). The faster MA is an EMA, while the slower MA is an SMA. By comparing these two MAs, we determine a trend direction. If the faster MA is above the slower MA the trend is upwards etc. This trend direction can then be used for filtering trades.
The strategy follows these rules:
If the RSI is below 20, a buy signal is generated.
If the RSI is above 80, a sell signal is generated.
However, this RSI trade signal is filtered so that a trade is only given the maximum voting weight if the RSI trade direction aligns with the trend direction determined by the MA filter.
So first, you need to add your chosen assets or simply keep the default ones. In Image 2, you can see one of the eight asset input sections.
Image 2
This strategy offers some general trade settings that apply equally to all assets and some asset-specific settings. This distinction is necessary because some assets have higher volatility than others, requiring asset-specific Take Profit and Stop Loss levels.
Once you have made your selections, proceed to the Indicators and Compare Functions for the voting. Image 3 shows an example of this setup.
Image 3
Later on go to the Indicator specific settings shown in Image 4 to refine the trade results.
Image 4
For refine the trade results take also a look on the result summary table, development of capital plot, on the list of closed and open trades and screener table shown in Image 5.
Image 5
To locate any trade for any asset in the chronological and scroll-able trade list, each trade is marked with a label:
An opening label displaying the trade direction, ticker ID, trade number, invested amount, and remaining cash reserves.
A closing label showing the closing reason, ticker ID, trade number, trade profit (%), trade revenue ($), and updated cash reserves.
Additionally: a green line marks each Take Profit level. An orange line indicates the (trailing) Stop Loss.
The summary table in the bottom-left corner provides insights into how effective the trade strategy is. By analyzing the trade list, you can identify trades that should be avoided.
To find those bad trades on the chart, use the trade number or timestamp. With replay mode, you can go back in time to review a specific trade in detail.
Image 6
In Image 6, you can see an example where replay mode and the start time filter are used to display specific trades within a narrow time range. By identifying a large number of bad trades, you may recognize patterns and formulate conditions to avoid them in the future.
This is the backtesting tool that allows you to develop and refine your trading strategy continuously. With each iteration—from general adjustments to detailed optimizations—you can use these tools to improve your strategy. You can:
Add other indicators with trade signals and direction
Add more indicators signals as filter
Adjust the settings of your indicators to optimize results
Configure key strategy settings, such as Time and Session Filters, Stop Loss, Take Profit, and more
By doing so, you can identify a profitable strategy and its optimal settings.
5. Settings Menu
In the settings menu you will find the following high-lighted sections. Most of the settings have a i mark on their right side. Move over it with the cursor to read specific explanation.
Backtest Results: Here you can decide about visibility of the trade list, of the Screener Table and of the Results Summary. And the colors for bullish, side ways, bearish and no signal. Go above and see Image 5.
Time Filter: You can set a Start time or deactivate it by leave it unhooked. The same with End Time and Duration Days . Duration Days can also count from End time in case you deactivate Start time.
Session Filter: Here, you can chose to activate trading on a weekly basis, specifying which days of the week trading is allowed and which are excluded. Additionally, you can configure trading on a daily basis, setting the start and end times for when trades are permitted. If activated, no new trades will be initiated outside the defined times and sessions.
Trade Logic: Here you can set an extra time frame for all indicators. You can enable Longs or Shorts or both trades.
The min Criteria percentage setting defines the minimum number of voices an asset has to get to be traded. So if you set this to 50% or less also weak winners of the voting get traded while 100% means that the winner of the voting has to get all possible voices.
Additionally, you have the option to delay entry signals. This feature is particularly useful when trade signals exhibit noise and require smoothing.
Enable Trailing Stop and force the strategy to trade only at bar closing. Other-ways the strategy trade intrabar, so when ever a voting present an asset to trade, it will send the alert and the webhooks.
The Hedging is basic as shown in the following Image 7 and serves as a catch if price moves fast in the wrong direction. You can activate a hedging mechanism, which opens a trade in the opposite direction if the price moves x% against the entry price. If both the Stop Loss and Hedging are triggered within the same bar, the hedging action will always take precedence.
Image 6
Indicators to use for Trade Signal Generating: Here you chose the Indicators and their Compare Function for the Voting . Any activated asset will get their indicator valuation which get compared over all assets. The asset with the highest valuation is elected for the trade as long free cash is present and as long the minimum criteria are met.
The Screener Table will show all indicators results of the last bar of all assets. Those indicator values which met the threshold get a background color to high light it. Green for bullish, red for bearish and orange for trade signals without direction. If you chose an Indicator here but without any compare function it will show also their results but with just gray background.
Indicator Settings: here you can setup the indicator specific settings. for deeper insights see 3. Included Indicators and Compare-Functions .
Assets, TP & SL Settings: Asset specific settings. Chose here the TickerID of all Assets you wanna trade. Take Profit 1&2 set the target prices of any trade in relation to the entry price. The Take Profit 1 exit a part of the position defined by the quantity value. Stop Loss set the price to step out when a trade goes the wrong direction.
Invest Settings: Here, you can set the initial amount of cash to start with. The Quantity Percentage determines how much of the available cash is allocated to each trade, while the Fee percentage specifies the trading fee applied to both opening and closing positions.
Webhooks: Here, you configure the License ID and the Comment . This is particularly useful if you plan to use multiple instances of the script, ensuring the webhooks target the correct positions. The Take Profit and Stop Loss values are displayed as prices.
6. Declaration for Tradingview House Rules on Script Publishing
The unique feature of this Democratic Multi-Asset Strategy is its ability to trade multiple assets simultaneously. Equipped with a set of different standard Indicators, it's new democratic Voting System does more robust trading decisions compared to single-asset. Interchangeable Indicators and customizable strategy settings allowing for a wide range of trading strategies.
This script is closed-source and invite-only to support and compensate for over a year of development work. Unlike other single asset strategies, this one cannot use TradingView's strategy functions. Instead, it is designed as an indicator.
7. Disclaimer
Trading is risky, and traders do lose money, eventually all. This script is for informational and educational purposes only. All content should be considered hypothetical, selected post-factum and is not to be construed as financial advice. Decisions to buy, sell, hold, or trade in securities, commodities, and other investments involve risk and are best made based on the advice of qualified financial professionals. Past performance does not guarantee future results. Using this script on your own risk. This script may have bugs and I declare don't be responsible for any losses.
8. Conclusion
Now it’s your turn! Chose an asset class and pick 8 of them and chose some indicators to see the trading results of this democratic voting system. Refine your multi-asset strategy to favorable settings. Once you find a promising configuration, you can set up alerts to send webhooks directly. Configure all parameters, test and validate them in paper trading, and if results align with your expectations, you even can deploy this script as your trading bit.
Cheers

3 Important Value CompositesCalculated on February 17, 2024. USDT 378 items, BTC 282 items, BINANCE
This is a watchlist, along with the most accurate computed values that I could achieve. It may be beneficial for those who want to change values from the "120x ticker screener (composite tickers)" indicator, which is one of the excellent indicators to bypass the limitation of the request. security() function that limits to only 40 requests. I've thought about this before but couldn't succeed, but someone finally did it. :)
--> 120x ticker screener (composite tickers)
Thank you once again for this idea.
You must look for this and change it.
t1 = 'symbol', n1 = Multiply , r1 = Pricescale(decimal)
Example of grouping: Group 1
BINANCE:ETHUSDT , BINANCE:FDUSDUSDT , BINANCE:BTCUSDT
2, 4, 2
13, 10
█ Note
• Tickers: For your watchlist, arrange them from left to right, pairing them in groups of 3.
• Pricescale: This represents the decimal length, arrange them from left to right, pairing them in groups of 3.
• Multiply: This involves multiplying the first 2 items in each pair of watchlists. Arrange them from left to right, pairing them in groups of 2.
* If you group items incorrectly, it may lead to inaccurate results.
* Please be advised that if one of the values in the "Pricescale"(decimal) trio changes, there may be a need to adjust those values accordingly to ensure correct digit separation. Otherwise, within the group, the numbers might appear peculiar.

Open Interest Suite [Aggregated] - By LeviathanThis script is an all-in-one indicator that uses aggregated Open Interest data to plot OI candles, Open Interest Delta, OI x rVOL, and OI RSI. It also includes tools such as an OI Distribution profile, large OI increase/decrease coloring, a Stats Screener, and much more.
You can select and have the script plot the following:
- Open Interest in the form of OHLC candles
- Open Interest Delta in the form of a histogram
- Open Interest x Relative Volume in the form of a histogram
- Open Interest RSI in the form of a line
Additional features include:
- OI Distribution Profile (It shows the distribution of open interest in the visible range on y axis. This makes it easier to identify when Open Interest is relatively high or low and at which values most of the action took place)
- Stats screener (The screener includes the real-time net Open Interest value, Rekt Longs/Rekt Shorts based on large OI decreases and Aggressive Longs/Shorts based on large OI increases)
- Coloring (You can color OI Delta nodes, background and chart candles based on large OI increases/decreases)
- more
Instructions for the settings will be provided in the tooltips shortly.
Full credit goes to @KioseffTrading for the profile generation code.
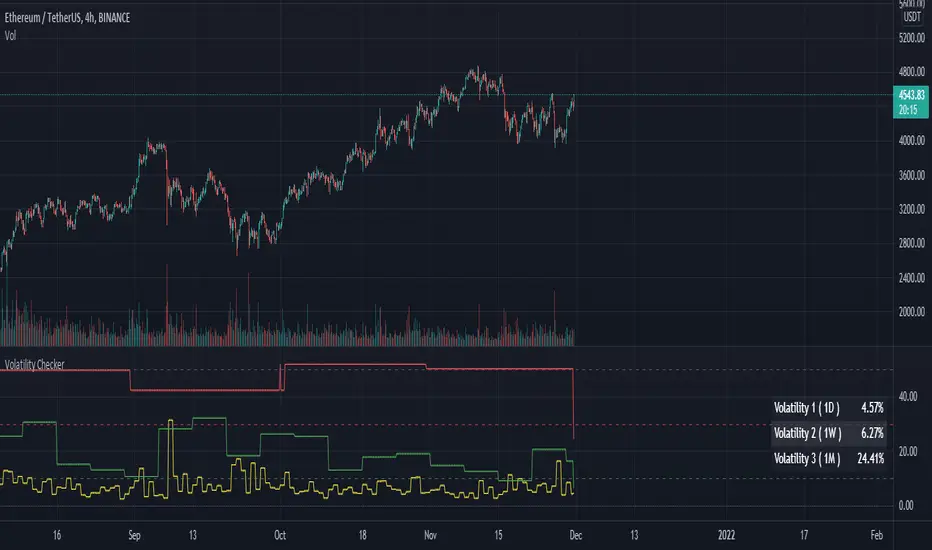
Volatility CheckerWhenever we want to find out volatility of the current chart, we need to visit screener and check the latest percentage. Because of this frustration by visiting screener page, I made this script. And there is no script like this, so it's open and free to use.
This script is detect current percentage of volatility as indicator way. Screener show default 1D volatility. But this script is not only show 1D volatility. You can change the resolution whatever you like. And you can switch more resolution style. But I think, 1D resolution is better. This script is best for crypto investors. I've no idea about stock/forex, so hmmmmm.
Hline helps you to detect the position of the volatility. I always like to check those symbol which is less than 30. Because it's best for scalping. Less than 10 is best for swing traders.
Feel free to use. Any feedback? welcome to comment zone :)
Stochastic RSI Heat Bollinger BandsThis indicator is based on a combination of the famous Bollinger Bands and the Stochastic RSI indicator.
Bands are dynamically colored (and filled) with a RGB color composed by red and green values, directly generated from the average Stochastic RSI current value.
By default, colors represent the following status -> green zone is overgought & red zone is oversold.
A screener is also displayed on the chart, representing StochRSI K and D lines values, RSI value, as well as the current status (Overbought/Oversold) of the StochRSI and RSI indicators.
Notes:
The heat color and the screener status are both based on the average value between the K and D lines (for stochastic RSI based heat)
Bands can be disabled in options to use this indicator as a simple moving average colored by the Stochastic RSI heat color.
Options:
Various moving average types (SMA, EMA, SMMA, VWMA...)
Inversion of colors between overbought and oversold status
Enabling/disabling heat color on bands / basis line and bands background color
Show/Hide the screener
Color source can be modified to base the heat on the RSI instead of the Stochastic RSI value
Standards Bollinger bands, Stochastic and RSI parameters
Example
Feel free to suggest any improvements in comment.

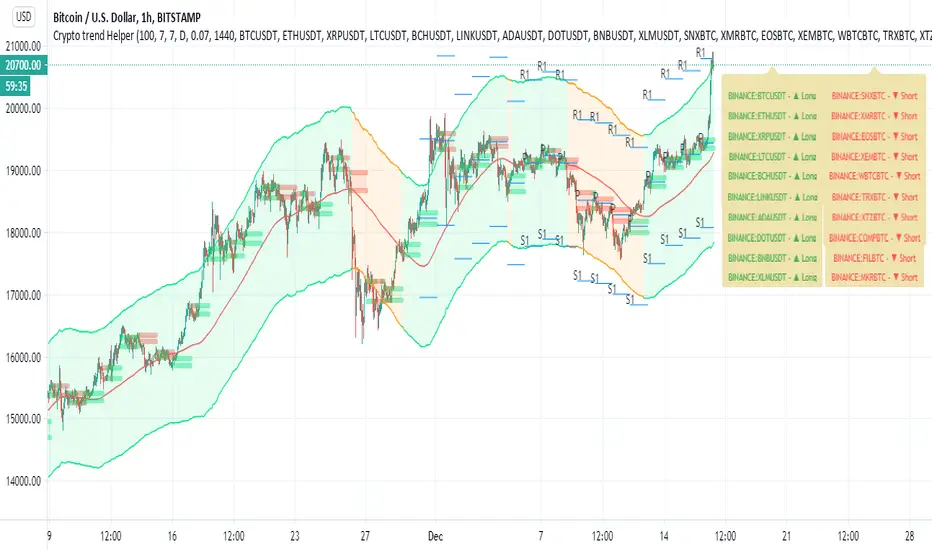
Crypto trend HelperThis is a good tool for chart 2 hours and bellow
the screener script taken from //script taken from with his consent.
long and short determine by my script Trend M version 1
it set up to daily MTF so if it above the mean it green or buy,bellow it it sell
R1 and S1 by percentage from mean set to 7 % or 0.07
the channel is percentage channel set to 7 % up or low
the color of this channel set by
it function to see long trends
you can modify the alts inside the script or in menu\
thanks for Zekis for it help in the screener
[M2J] Indicator | Turtle Atom Duck Signal Turtle Atom Duck shows potential buy and sell
It consist of 3 indicators
Turtle - Donchian Channel
- bullish when price close above previous 1 bar high
- bearish when price close below previous 1 bar low
Atom - Bollinger Band
- bullish when price close above upper band
- bearish when price close below lower band
Duck - Moving Average (Default 50-period EMA)
- bullish when price close above moving average
- bearish when price close below moving average
When all 3 are bullish, buy signal appears
When all 3 are bearish, sell signal appears
Screener Turtle Atom Duck
Example:
FBMKLCI
Technology Sector
Health Sector
TOPGLOV
BINTAI
XOX
PRLEXUS
JCY
EURUSD
XAUUSD

{PREMIUM} Support And Resistance ScriptSupport and resistance is a trading technique that has been around for decades. In simple terms, support and resistance is a measure of supply and demand. While this sounds simple, it is very difficult to identify support and resistance as they happen in real time.
Luckily, we have a solution. The script you see below is a custom software that was developed by Mike that automatically identifies the best price levels to buy (support) at and sell (resistance) at. The software uses a proprietary algorithm that identifies when stocks are undervalued and overvalued. When a stock is undervalued, a blue diamond and the word "SUPPORT" will automatically appear on your chart. Additionally, when a stock is overvalued, a black flag and the word "RESISTANCE" will automatically appear on your chart.
When you sign up for our program you have 100% full access to use the support and resistance script on all major stock exchanges, global currency pairs, worldwide indexes, 30+ crypto exchanges, and more. In addition to having completely automatic support and resistance points on your chart, you will have exclusive access to a screener that scans through 19,000 stocks every night and finds the best stocks to buy now. The screener shows stocks that have huge upside potential with minimal downside risk. The stocks on the list are in the $1 - $300 price range, so this screener is suitable for all types of traders.

Ichimoku Cloud Breakout with Candle Colors + AlertsIchimoku Cloud Breakout Indicator with Candle Coloring + Alerts
This indicator provides instant visual clarity on price position relative to the Ichimoku Cloud through intelligent candle coloring and breakout signals.
Key Features:
Smart Candle Colors: Automatically colors candles based on their position relative to the cloud (below, inside, or above), making trend identification effortless at a glance
Breakout Detection: Displays clear visual signals when price breaks above or below the Ichimoku Cloud, highlighting significant trend changes
Customizable Visuals: Choose from multiple label styles (arrows, circles, diamonds, squares) and customize colors to match your chart theme
Optional Elements: Toggle Ichimoku lines, cloud visualization, info table, and background highlighting on/off as needed
Clean Interface: Designed for minimal chart clutter while maximizing actionable information
⚡ Full Alert System: Set up three distinct alert types to never miss a breakout - alerts for breakouts above the cloud, below the cloud, or any cloud breakout
📊 Pine Screener Compatible: Scan entire watchlists or flagged lists for cloud breakout opportunities across multiple symbols simultaneously using TradingView's Pine Screener
Perfect for traders who use Ichimoku Cloud methodology and want quick visual confirmation of trend status, breakout events, and automated scanning capabilities across their watchlists.

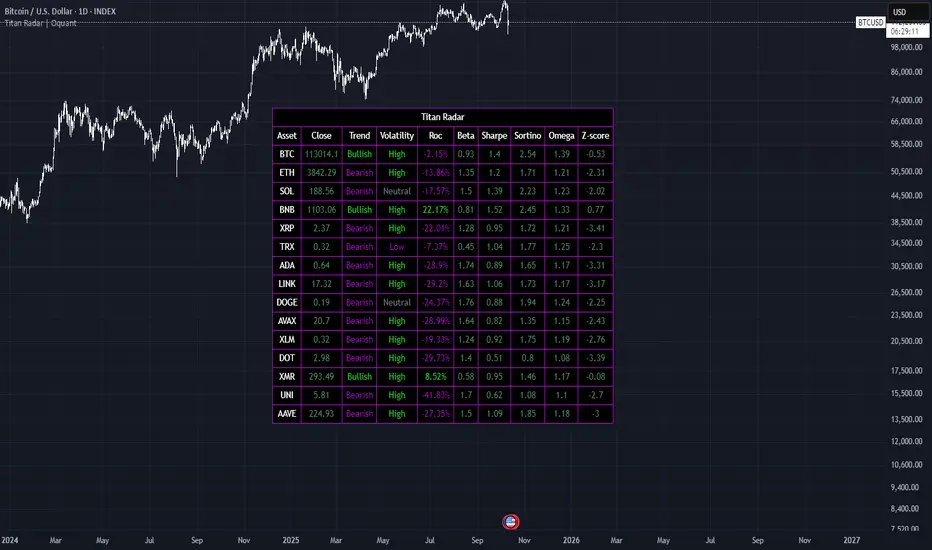
Titan Radar | OquantOverview
Titan Radar is a comprehensive multi-asset screener designed to provide traders with a view of key market dynamics across up to 15 user-selected assets. It aggregates essential metrics such as trend states, volatility levels, rate of change (ROC), beta, risk-adjusted performance ratios (Sharpe, Sortino, and Omega), and Z-scores into an table format(Remember past performance doesn’t guarantee future results). This tool helps identify potential opportunities by highlighting assets with bullish or bearish trends, high, low or neutral volatility, momentum shifts, and relative performance characteristics, all while emphasizing risk management through established financial metrics(Remember past performance doesn’t guarantee future results).
Key Components
The screener evaluates each asset across several dimensions:
Trend State: Determined by a consensus of multiple trend-detection methods to classify the asset as Bullish, Bearish, or Neutral.
Volatility State: Assesses volatility by using Z-score of standard deviation, categorizing it as High, Low, or Neutral.
Rate of Change (ROC): Measures percentage change over a specified period to gauge momentum.
Beta: Calculates the asset's volatility&correlation to a benchmark (e.g., total crypto market cap) for understanding systematic risk.
Sharpe Ratio: Evaluates risk-adjusted returns by comparing average returns to total volatility of returns, annualized for comparability.
Sortino Ratio: Like Sharpe, evaluates risk-adjusted returns by dividing average returns by volatility (annualized), but it focuses solely on downside risk by using the standard deviation of negative returns only.
Omega Ratio: Quantifies reward-to-risk by checking the total magnitude of positive returns compared to the total magnitude of negative returns(value above 1 means more positive than negative returns).
Z-Score: Normalizes the asset's price relative to its recent mean and standard deviation for spotting deviations.
Remember past performance doesn’t guarantee future results.
How It Works
The script fetches closing prices for the selected assets and applies a blend of smoothing techniques, deviation bands, normalization, and statistical measures to derive each metric. For trends, it averages signals(1 for bullish, -1 for bearish) from various filters like adaptive moving averages, percentile-based bands, and Z-score thresholds to produce a robust directional bias. Volatility is derived from standard deviation Z-score to detect expansions or contractions. Performance ratios use return series to compute annualized values, ensuring they account for timeframes without assuming constant compounding. The results are color-coded and displayed in a table for quick scanning, allowing traders to compare assets at a glance without manual calculations.
Recommended Use Cases
This tool is ideal for cryptocurrency traders managing diversified portfolios, such as swing traders seeking to rotate into high-momentum, low-risk assets during market cycles. It's particularly useful for those monitoring altcoins relative to majors like BTC or ETH, identifying volatility levels(high, low, neutral), or screening for high/low beta positions. Swing traders can use it to find positions and benefit from the risk metrics to evaluate position health(Remember past performance doesn’t guarantee future results).
It's best suited for users familiar with basic financial metrics who want an efficient way to screen multiple assets simultaneously.
Settings and Default Settings
Assets (Asset 1 to Asset 15): Select symbols like BTCUSD, ETHUSD, etc. (Defaults: BTCUSD, ETHUSD, SOLUSD, BNBUSD, XRPUSD, TRXUSD, ADAUSD, LINKUSD, DOGEUSD, AVAXUSD, XLMUSD, DOTUSD, XMRUSD, UNIUSD, AAVEUSD).
SD Length (Volatility): Period for standard deviation calculation (Default: 20).
Volatility Z-Score Period: Length for Z-score of volatility (Default: 40).
Upper/Lower Threshold of SD Z-Score: Bounds for high/low volatility classification (Defaults: 0.5 / -0.5).
ROC Length: Period for rate of change (Default: 30).
Beta Benchmark: Symbol for beta calculation (Default: CRYPTOCAP:TOTAL).
Beta Length: Period for beta computation (Default: 500).
Z-Score Period: General Z-score length (Default: 40).
Trend Settings: Includes ALMA length/offset/sigma (Defaults: 35/0.75/6), SD length/multiplier (Defaults: 25/1.4), EMA length/normalization length/thresholds (Defaults: 30/40/0.7/0.3), DEMA length/Z-score period/thresholds (Defaults: 25/30/0.4/-0.4), LSMA length/smoothing/IQR length/multiplier (Defaults: 35/25/25/1.4), RMA/MAD lengths/multiplier (Defaults: 15/20/1).
Trend Thresholds: Bullish/Bearish score thresholds (Defaults: 0.2/0).
Conclusion
Titan Radar streamlines multi-asset analysis by combining trend, momentum, volatility, and risk metrics into one dashboard, saving time. Its focus on consensus-based signals and established risk measures makes it a practical addition for traders aiming to make informed decisions in markets like crypto(remember past performance doesn’t guarantee future results).
⚠️ Disclaimer: This indicator is intended for educational and informational purposes only. Trading/investing involves risk, and past performance does not guarantee future results. Always test and evaluate indicators/strategies before applying them in live markets. Use at your own risk.
Golden Cross and Death Cross IndicatorThis screener identifies key technical signals known as the Golden Cross and Death Cross on any TradingView chart. The Golden Cross occurs when the 50-day simple moving average (SMA) crosses above the 200-day SMA, signaling a potential bullish trend or buy opportunity. Conversely, the Death Cross happens when the 50-day SMA crosses below the 200-day SMA, indicating a potential bearish trend or sell signal.
This indicator visually plots both SMAs on the price chart and marks the crossover points with clear green (buy) and red (sell) triangles. It also includes alert conditions for both signals, enabling traders to receive real-time notifications when these important trends develop.
Ideal for swing traders, investors, and technical analysts, this screener helps spot long-term trend shifts effectively, improving timing for entries and exits. It serves as a reliable tool to complement broader trading strategies focused on momentum and trend-following approaches.

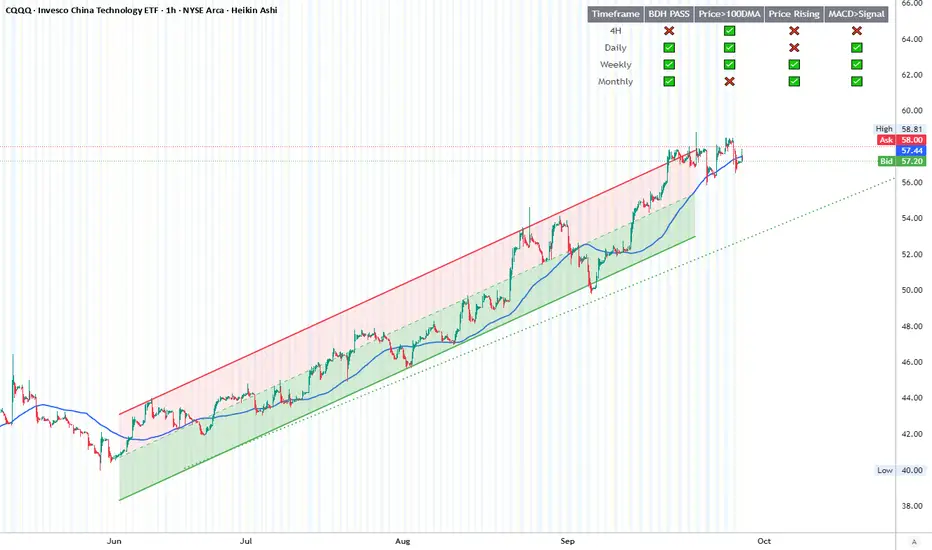
BDH Multi‑Timeframe Dashboard 📊 BDH Multi-Timeframe Dashboard (4H, D, W, M)
The Buy Don’t Hold (BDH) Screener is inspired by the book Buy—Don’t Hold by Leslie N. Masonson. It is designed to rotate into the strongest ETFs during bullish phases while stepping aside in weak markets.
✅ How It Works
The screener evaluates three filters across multiple timeframes (4H, Daily, Weekly, Monthly):
Price > 100-DMA
Price Rising (close > lookback)
MACD > Signal
Each timeframe earns a PASS if at least 2 out of 3 conditions are met.
🖥️ Features
Multi-timeframe dashboard table with green/red checks
🚀 Strategy Application
Scan for ETFs with multi-timeframe PASS signals
Buy the strongest performers
Rotate out when an ETF falls out of strength ranking
This rotation method is designed to historically outperform passive SPY holding by maintaining exposure only to strong, trending ETFs
📌 ETFs Watchlist (copy-paste ready)
Use this watch list for screening :
ARKF, ARKG, ARKK, ARKQ, ARKW, ASHR, BATT, BLCN, BLOK, CLOU, CQQQ, EEM, EMQQ, ESPO, HACK, IBUY, ICVT, IWM, IZRL, KWEB, MDY, OGIG, PBW, PRNT, QCLN, QQQ, REMX, SMH, SOCL, SPY, TAN, TLT, URA, VB, XBI, XHB, XLC, XLE, XLF, XLY, XOP, XRT
✨ With this dashboard, traders can quickly identify ETFs that meet the BDH conditions across multiple timeframes, helping them follow a disciplined rotation strategy.