cd_correlation_analys_Cxcd_correlation_analys_Cx
General:
This indicator is designed for correlation analysis by classifying stocks (487 in total) and indices (14 in total) traded on Borsa İstanbul (BIST) on a sectoral basis.
Tradingview's sector classifications (20) have been strictly adhered to for sector grouping.
Depending on user preference, the analysis can be performed within sectors, between sectors, or manually (single asset).
Let me express my gratitude to the code author, @fikira, beforehand; you will find the reason for my thanks in the context.
Details:
First, let's briefly mention how this indicator could have been prepared using the classic method before going into details.
Classically, assets could be divided into groups of forty (40), and the analysis could be performed using the built-in function:
ta.correlation(source1, source2, length) → series float.
I chose sectoral classification because I believe there would be a higher probability of assets moving together, rather than using fixed-number classes.
In this case, 21 arrays were formed with the following number of elements:
(3, 11, 21, 60, 29, 20, 12, 3, 31, 5, 10, 11, 6, 48, 73, 62, 16, 19, 13, 34 and indices (14)).
However, you might have noticed that some arrays have more than 40 elements. This is exactly where @Fikira's indicator came to the rescue. When I examined their excellent indicator, I saw that it could process 120 assets in a single operation. (I believe this was the first limit overrun; thanks again.)
It was amazing to see that data for 3 pairs could be called in a single request using a special method.
You can find the details here:
When I adapted it for BIST, I found it sufficient to call data for 2 pairs instead of 3 in a single go. Since asset prices are regular and have 2 decimal places, I used a fixed multiplier of $10^8$ and a fixed decimal count of 2 in Fikira's formulas.
With this method, the (high, low, open, close) values became accessible for each asset.
The summary up to this point is that instead of the ready-made formula + groups of 40, I used variable-sized groups and the method I will detail now.
Correlation/harmony/co-movement between assets provides advantages to market participants. Coherent assets are expected to rise or fall simultaneously.
Therefore, to convert co-movement into a mathematical value, I defined the possible movements of the current candle relative to the previous candle bar over a certain period (user-defined). These are:
Up := high > high and low > low
Down := high < high and low < low
Inside := high <= high and low >= low
Outside := high >= high and low <= low and NOT Inside.
Ignore := high = low = open = close
If both assets performed the same movement, 1 was added to the tracking counter.
If (Up-Up), (Down-Down), (Inside-Inside), or (Outside-Outside), then counter := counter + 1.
If the period length is 100 and the counter is 75, it means there is 75% co-movement.
Corr = counter / period ($75/100$)
Average = ta.sma(Corr, 100) is obtained.
The highest coefficients recorded in the array are presented to the user in a table.
From the user menu options, the user can choose to compare:
• With assets in its own sector
• With assets in the selected sector
• By activating the confirmation box and manually entering a single asset for comparison.
Table display options can be adjusted from the Settings tab.
In the attached examples:
Results for AKBNK stock from the Finance sector compared with GARAN stock from the same sector:
Timeframe: Daily, Period: 50 => Harmony 76% (They performed the same movement in 38 out of 50 bars)
Comment: Opposite movements at swing high and low levels may indicate a change in the direction of the price flow (SMT).
Looking at ASELS from the Electronic Technology sector over the last 30 daily candles, they performed the same movements by 40% with XU100, 73.3% (22/30) with XUTEK (Technology Index), and 86.9% according to the averages.
Comment: It is more appropriate to follow ASELS stock with XUTEK (Technology index) instead of the general index (XU100). Opposite movements at swing high and low levels may indicate a change in the direction of the price flow (SMT).
Again, when ASELS stock is taken on H1 instead of daily, and the length is 100 instead of 30, the harmony rate is seen to be 87%.
Please share your thoughts and criticisms regarding the indicator, which I prepared with a bit of an educational purpose specifically for BIST.
Happy trading.
Cari dalam skrip untuk "screener"

Simple BOS ScannerThis is a Break of Structure Scanner
It checks whenever there is a break of structure and can be used on the Screener screen

Relative Performance Tracker [QuantAlgo]🟢 Overview
The Relative Performance Tracker is a multi-asset comparison tool designed to monitor and rank up to 30 different tickers simultaneously based on their relative price performance. This indicator enables traders and investors to quickly identify market leaders and laggards across their watchlist, facilitating rotation strategies, strength-based trading decisions, and cross-asset momentum analysis.
🟢 Key Features
1. Multi-Asset Monitoring
Track up to 30 tickers across any market (stocks, crypto, forex, commodities, indices)
Individual enable/disable toggles for each ticker to customize your watchlist
Universal compatibility with any TradingView symbol format (EXCHANGE:TICKER)
2. Ranking Tables (Up to 3 Tables)
Each ticker's percentage change over your chosen lookback period, calculated as:
(Current Price - Past Price) / Past Price × 100
Automatic sorting from strongest to weakest performers
Rank: Position from 1-30 (1 = strongest performer)
Ticker: Symbol name with color-coded background (green for gains, red for losses)
% Change: Exact percentage with color intensity matching magnitude
For example, Rank #1 has the highest gain among all enabled tickers, Rank #30 has the lowest (or most negative) return.
3. Histogram Visualization
Adjustable bar count: Display anywhere from 1 to 30 top-ranked tickers (user customizable)
Bar height = magnitude of percentage change.
Bars extend upward for gains, downward for losses. Taller bars = larger moves.
Green bars for positive returns, red for negative returns.
4. Customizable Color Schemes
Classic: Traditional green/red for intuitive interpretation
Aqua: Blue/orange combination for reduced eye strain
Cosmic: Vibrant aqua/purple optimized for dark mode
Custom: Full personalization of positive and negative colors
5. Built-In Ranking Alerts
Six alert conditions detect when rankings change:
Top 1 Changed: New #1 leader emerges
Top 3/5/10/15/20 Changed: Shifts within those tiers
🟢 Practical Applications
→ Momentum Trading: Focus on top-ranked assets (Rank 1-10) that show strongest relative strength for trend-following strategies
→ Market Breadth Analysis: Monitor how many tickers are above vs. below zero on the histogram to gauge overall market health
→ Divergence Spotting: Identify when previously leading assets lose momentum (drop out of top ranks) as potential trend reversal signals
→ Multi-Timeframe Analysis: Use different lookback periods on different charts to align short-term and long-term relative strength
→ Customized Focus: Adjust histogram bars to show only top 5-10 strongest movers for concentrated analysis, or expand to 20-30 for comprehensive overview

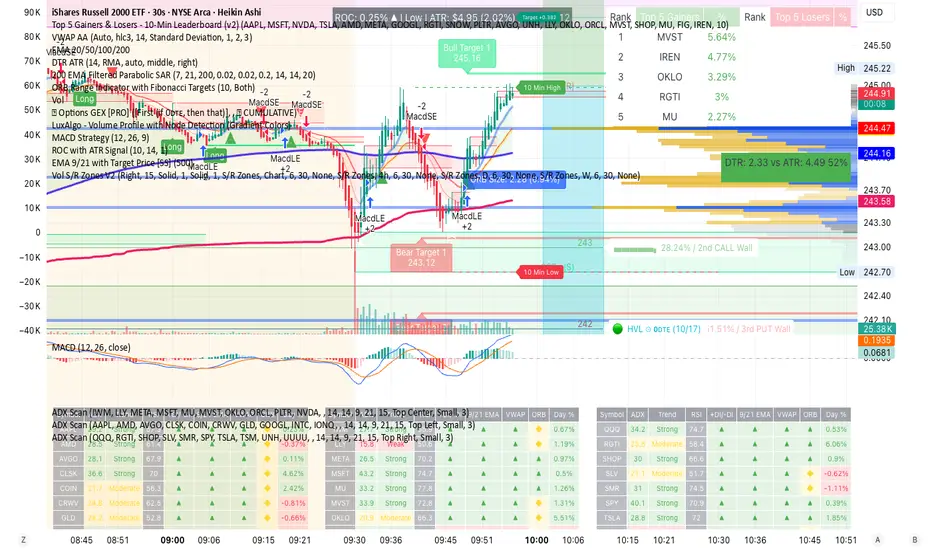
ADX Scanner with IndicatorsA screener that will allow you to enter up to 10 stocks. The goal is to see clearly in front of you what stocks are moving and the momentum leveraging the ADX and RSI. The return for the day shows the growth or loss of those moves.
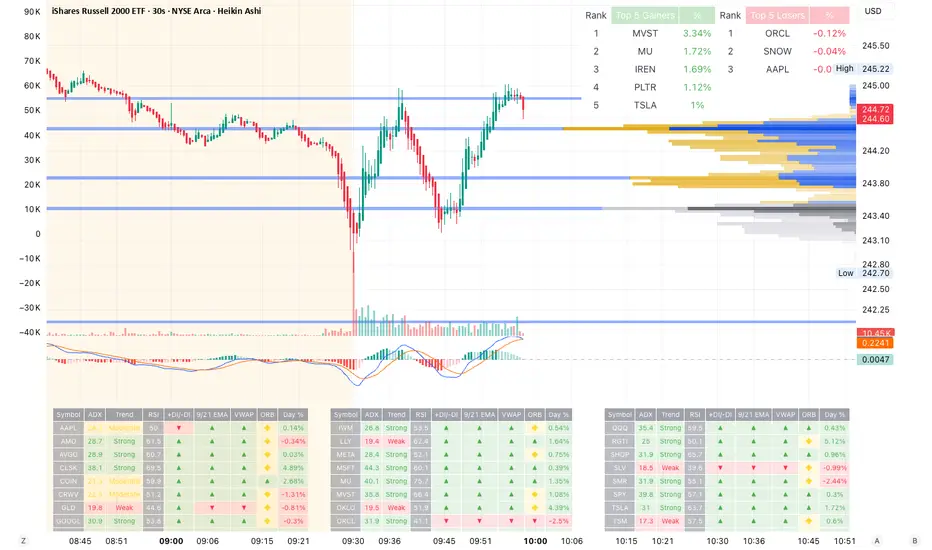
ADX Scanner with IndicatorsA screener that will allow you to enter up to 10 stocks. The goal is to see clearly in front of you what stocks are moving and the momentum leveraging the ADX and RSI. The return for the day shows the growth or loss of those moves.
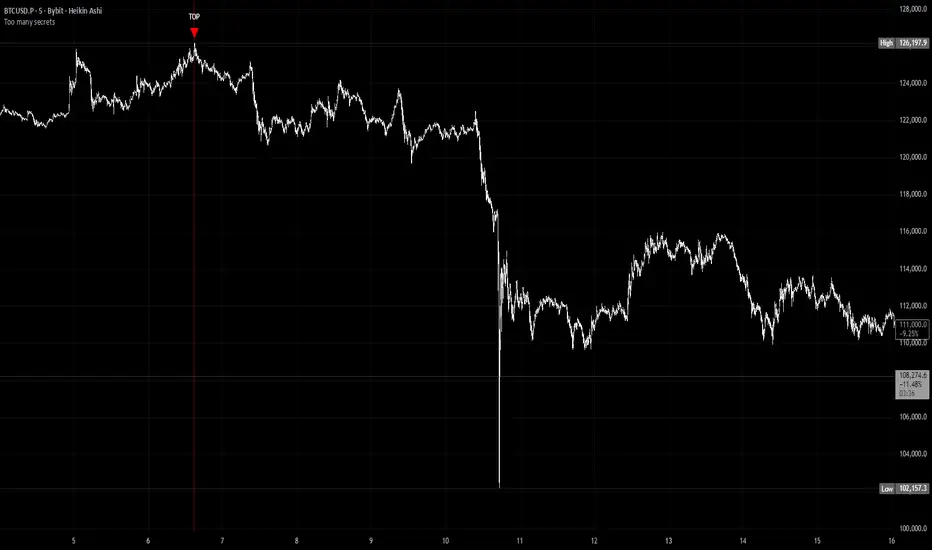
Too many secretsTOO MANY SECRETS - Extreme Condition Signal Detector
This indicator identifies extreme market conditions and provides clear TOP and BOTTOM signals when specific criteria are met. Designed for traders who want reliable entry points without the noise.
KEY FEATURES:
No Repaint - Once a signal prints, it's locked in and will not disappear or change
Smart Filtering - The Blackbox and other proprietary modules prevent signal spam, ensuring only high-quality setups trigger alerts
Customizable Alerts - Use as a multi-symbol screener across different timeframes
Visual Strike Lines - Optional vertical lines mark exact signal locations with adjustable transparency
Clean Interface - Minimal chart clutter with maximum information
CLASSIFIED METHODOLOGY:
The internal workings of this indicator, including the Blackbox module and other signal processing components, are intentionally classified. The specific calculations, timeframes, and confluence requirements remain undisclosed.
RECOMMENDED USAGE:
Best viewed on 5 minute charts
Configure alerts to monitor multiple symbols simultaneously
Adjustable Blackbox parameter allows fine-tuning for your trading style
IMPORTANT NOTES:
Bar Replay: Signals only appear on 5x or faster speeds during replay. In live trading, signals appear instantly in real-time.
This is highly experimental. Not financial advice - trade at your own risk.
WHAT YOU GET:
TOP signals (red triangles) for potential bearish reversals
BOTTOM signals (green triangles) for potential bullish reversals
Alert conditions for automated notifications
Splash screen with setup guidance (can be toggled off)
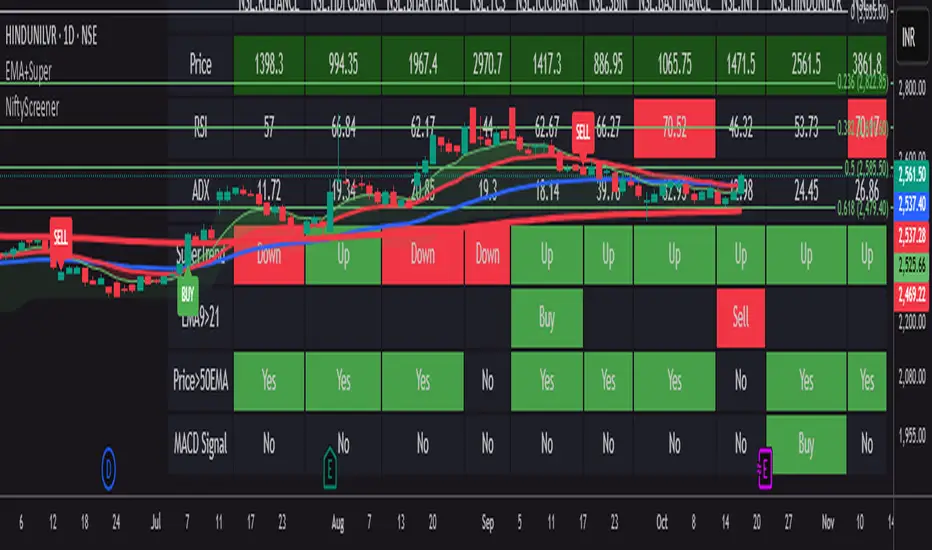
NiftyScreenerNifty 50 stock screener that displays real-time technical signals for the top 10 weighted stocks. It shows key indicators like RSI, ADX, SuperTrend, EMA crossovers, price position, and MACD signals in a tabular format on the chart. Users can customize stock visibility, display position, and text size, making it a handy tool for quick, multi-indicator analysis of Indian blue-chip stocks. Perfect for intraday and swing trading, it helps identify trend strength, momentum shifts, and buy or sell signals efficiently.
Koncorde Crossing Screener (UP/DOWN) AlertThis indicators works on Koncorde Crossing Pattern, generating alerts when Cross is Up (buy) and Down (sell).

Premarket Gapper Swing Filter (Long) – v6here’s a plug-and-play Pine Script v5 “screener” you can drop on any chart to flag pre-market gainers that also meet swing-friendly trend/liquidity filters. It works as a chart-level scanner (since Pine can’t screen the whole market by itself): add it to a watchlist; symbols that qualify will light up and you can set alerts to ping you right at the opening bell.

Weekly Breakout Screenermencari harga saham yang kuat breakout harga mingguan. potensi swing trading

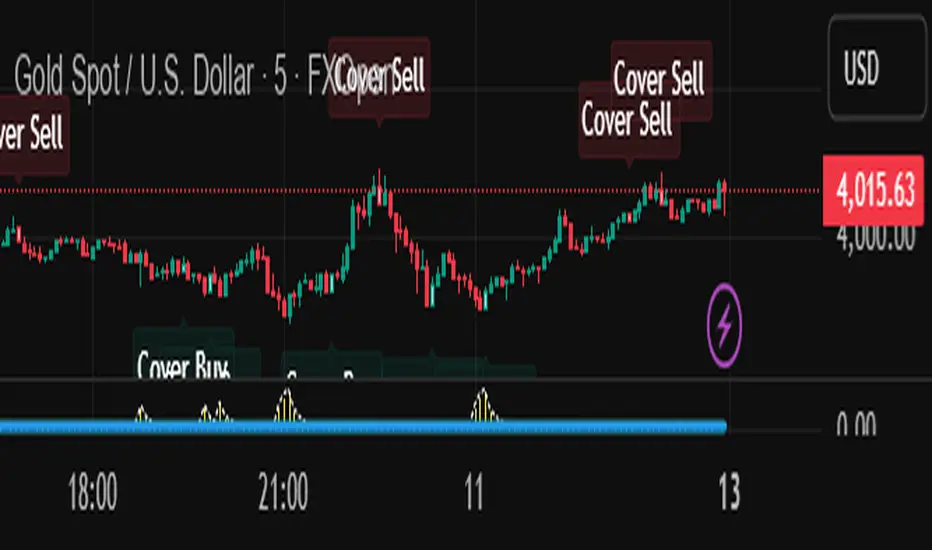
[NBK] Cover Buy Sell Cover Buy Sell — Engulfing Reversals with EMA/ATR Trend & Quality Filters
What it does
This indicator flags high-quality bullish/bearish reversal candles only when they align with a short-term trend and pass several objective quality filters. It is not a simple mashup: each component serves a distinct role and they work together to keep early/low-quality signals out.
How it works (components & interaction)
Pattern engine (entry candidates)
Bullish side (Cover Buy):
Body Engulf: current green body fully covers the prior red body, or
Piercing (relaxed): prior red → current green closes above the prior body’s midpoint (not beyond prior open).
Bearish side (Cover Sell):
Full-candle Engulf: current red candle (body + wicks) covers the entire prior candle, or
Body Engulf: current red body fully covers the prior body, or
Dark-Cloud (relaxed): prior green → current red closes below the prior body’s midpoint.
Short-term trend gate (non-repainting)
Trend is defined by the EMA slope between bar-1 and bar-2, scaled by ATR to require minimum strength.
Slope < 0 → only bullish candidates pass. Slope > 0 → only bearish candidates pass.
Body-size filter (noise control)
Rejects tiny candles: each body is compared with the lookback average body size.
For bearish candidates an additional ratio check requires current body ≥ a fraction of the prior body (to avoid weak top-ticks).
Peak filters for bearish signals (late, cleaner tops)
Distance above EMA: the high must be at least X × ATR above EMA (avoids mid-range noise).
Near local high: the high of the current bar (or bar-1) must be close to the highest high in a recent window.
Break confirmation: close must break low by at least Y × ATR (filters shallow dark-clouds).
Only when a candidate satisfies the pattern ➝ trend ➝ size ➝ peak sequence is a signal printed/alerted.
Inputs (key parameters)
EMA length, Min EMA slope vs ATR, ATR length: trend strength.
Lookback for average body, Min body vs average, Bear body ratio: body-quality filters.
High distance above EMA (×ATR), Local high lookback, Tolerance to local high (×ATR), Min break of low (×ATR): bearish peak confirmation.
Alerts
Built-in alerts fire on bar close for both Cover Buy and Cover Sell.
How to use
Increase High distance above EMA / Local high lookback / Min break of low to reduce early Cover Sell in ranges.
If you miss good tops, ease those thresholds slightly.
Works across symbols/timeframes; evaluated on bar close; no repaint from the trend gate.
Notes
This tool is a signal screener, not financial advice. For best results, combine with your structure/SR zones, risk management, and execution rules.
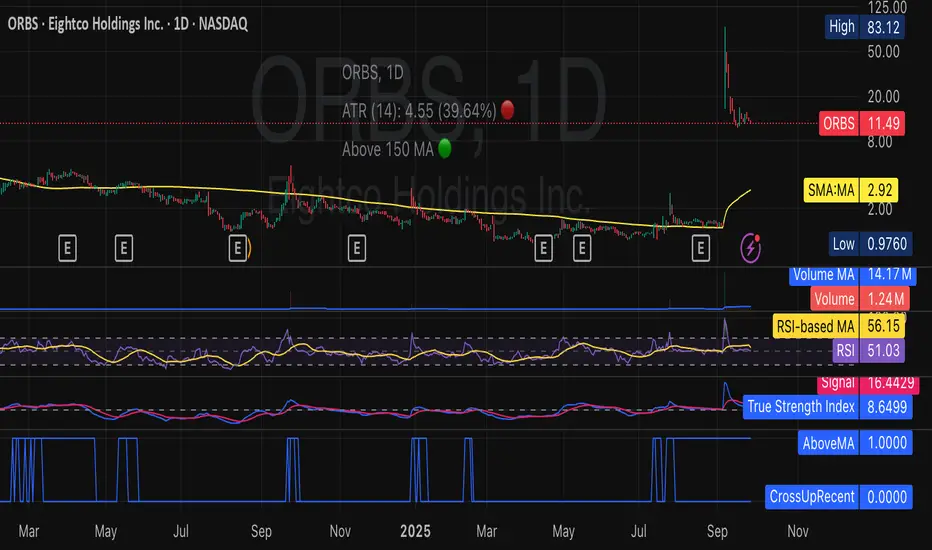
No Supply (Low-Volume Down Bars) — IdoThis indicator flags classic Wyckoff/VSA “No Supply (NS)” events—down bars that print on unusually low volume, suggesting a lack of sellers rather than strong selling pressure. NS often appears near support, LPS, or within re-accumulation ranges as a test before continuation higher.
Signal definition (configurable):
Down bar: choose Close < PrevClose or Close < Open.
Low volume: Volume < SMA(Volume, len) × threshold (e.g., 0.7).
Optional volume lower than the prior two bars (reduces noise).
Optional narrow spread: range (H–L) below its average.
Optional close position: close in the upper half of the bar.
Optional trend filter: only mark NS above or below an EMA (or any).
Optional wide-bar exclusion: skip unusually wide bars.
Visuals & outputs
Blue dot below each NS bar (optional bar tint).
Separate pane showing Relative Volume (vol / volSMA) to gauge effort.
Built-in alertcondition to trigger notifications when NS prints.
Inputs (high level)
lenVol: Volume SMA length.
ratioVol: Volume threshold vs. average (e.g., 0.7 = 70%).
usePrev2: Require volume below each of the prior two bars.
useNarrow + lenRange + ratioRange: Narrow-bar filter.
useClosePos + minClosePos: Close in upper portion of the bar.
downBarMode: Define “down bar” logic.
trendFiltOn, trendLen, trendSide: EMA trend filter.
useWideFilter, lenRangeWide, wideThreshold: Skip wide bars.
How to use (Wyckoff/VSA context)
Treat NS as a test of supply: price dips, but volume is light and close holds up.
Stronger when it prints near support/LPS within a re-accumulation structure.
Confirmation (recommended): within 1–3 bars, see demand—e.g., break above the NS high with expanding volume (above average or above the prior two bars). Many traders place a buy-stop just above the NS high; common stops are below the NS low or the most recent swing low.
Scanning tip
TradingView’s stock screener can’t consume Pine directly.
Use a Watchlist Custom Column that reports “bars since NS” to sort symbols (0 = NS on the latest bar). A companion column script is provided separately.
Notes & limitations
Works on any timeframe (intraday/daily/weekly), but context matters.
Expect false positives around news, gaps, or illiquid symbols—combine with structure (trend, S/R, phases) and risk management.
© moshel — Educational use only; not financial advice.

LBR Oscillator with Signals & AlertsLinda Bradford Raschke MacD indicator. Has alerts and can be used in the pine screener on different timeframes.

Crypto Early Momentum — Screener v6 (robust)Screens Crypto Pairs for momentum and assigns a momentum score.

BNF 25/50 MA Pullback Screener (Uptrend-Below / Downtrend-Above)Buy candidates: stocks in an uptrend (25MA > 50MA, optional rising slopes) that are currently pulled back below the MAs.
• Sell/short candidates: stocks in a downtrend (25MA < 50MA, optional falling slopes) that are currently pushed above the MAs.
It plots the MAs, paints the background for trend context, drops signals on the chart, shows a status panel, and exposes alert conditions so you can screen your watchlist via alerts.

MA Compression / Launchpad Zones v6MA Compression / Launchpad Zones (v6 • strict • screener defaults)
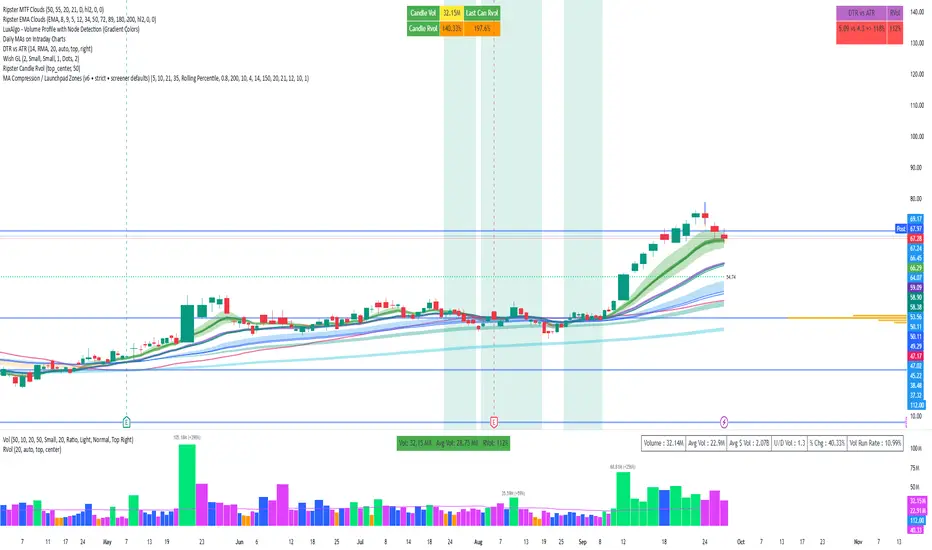
Scenario Screener — Consolidation → Bullish SetupThe script combines multiple indicators to filter out false signals and only highlight strong conditions:
Consolidation Check
Uses ATR % of price → filters out stocks in tight ranges.
Uses Choppiness Index → confirms sideways/non-trending behavior.
Momentum Shift (Bullish Bias)
MACD Histogram > 0 → bullish momentum starting.
RSI between 55–70 → strength without being overbought.
Stochastic %K & %D > 70 → confirms strong momentum.
Volume & Accumulation
Chaikin Money Flow (CMF > 0) → buying pressure.
Chaikin Oscillator > 0 (debug only) → accumulation phase.
Trend Direction
+DI > -DI (from DMI) → buyers stronger than sellers.
ADX between 18–40 → healthy trend strength (not too weak, not overheated).
Breakout Filter (Optional)
If enabled, requires price to cross above 20 SMA before signal confirmation.
📈 Outputs
✅ Green label (“MATCH”) below the bar when all bullish conditions align.
✅ Background highlight (light green) when signal appears.
✅ Info Table (top-right) summarizing key values:
Signal = True/False
MACD, CMF, Chaikin values


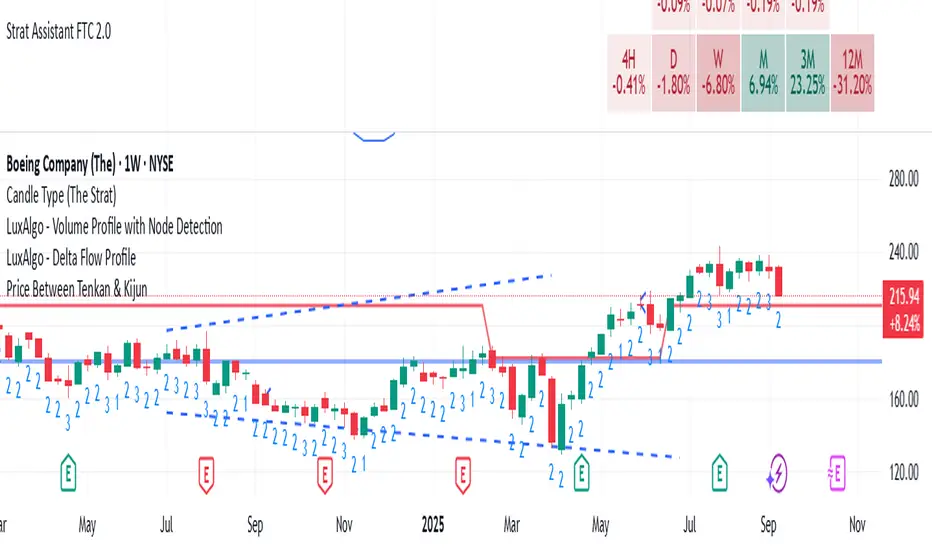
Price Between Tenkan & KijunThis is to find stocks that either breaking up or down from a large screener list
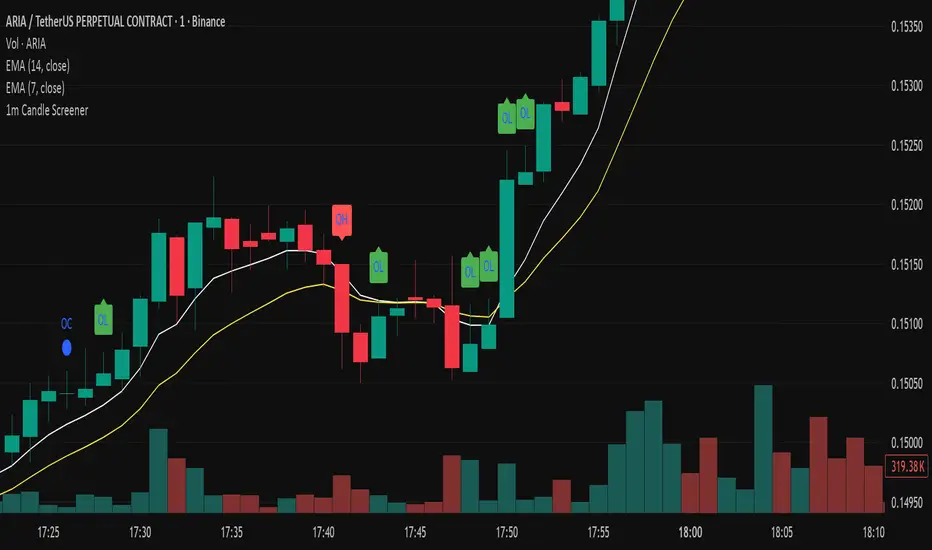
Precision Candle Marker – OL/OH/OC ScreenerThis indicator highlights high-probability precision candles on any perpetual contract, designed especially for scalpers and short-term traders.
It marks three unique candle setups on the 1-minute chart (works on other timeframes too):
🟢 Open = Low (OL) → Strong bullish momentum, buyers took control instantly.
🔴 Open = High (OH) → Strong bearish momentum, sellers took control instantly.
🔵 Open = Close (OC) → Doji / indecision candle, potential reversal or continuation signal.
Use cases:
Identify breakout entry points in uptrend/downtrend.
Filter noise and focus on precision candles.
Combine with trend indicators (EMA, VWAP, RSI) for confirmation.
This tool is best suited for scalping perpetual contracts (e.g., BTCUSDT, ETHUSDT) but works on any symbol and timeframe.
Multi-indicator trading screener with visual overlays V2Special Thanks to community out there.
I just combined famous scripts from different authors.
------------------
More advance and with more protection with indicator priority system which to use under which condition while buying and selling. long or short
------------------
Main Components
1. Order Block Detection
2. Trend Analysis
3. Signal Generators
4. Visual Overlays

MA20 & MA50 RisingMA20 & MA50 Rising Scanner
Detects when both the 20-period and 50-period simple moving averages turn upward on the most recent bar. Designed as a lightweight screener column for TradingView’s watchlists.
Overview
This indicator plots a binary flag (0 or 1) per symbol, where
- 1 means SMA(20) > SMA(20) and SMA(50) > SMA(50)
- 0 means one or both moving averages did not rise
Add it as a custom column in your watchlist to instantly surface stocks with both short- and medium-term trend acceleration.
How It Works
- Calculates ma20 = simple moving average of the last 20 closes
- Calculates ma50 = simple moving average of the last 50 closes
- Compares each with its prior value (ma20 and ma50 )
- Sets flag to 1 only when both are higher than yesterday’s values
When you filter your watchlist for flag == 1, you see only symbols whose 20- and 50-period SMAs both rose on the latest bar.
