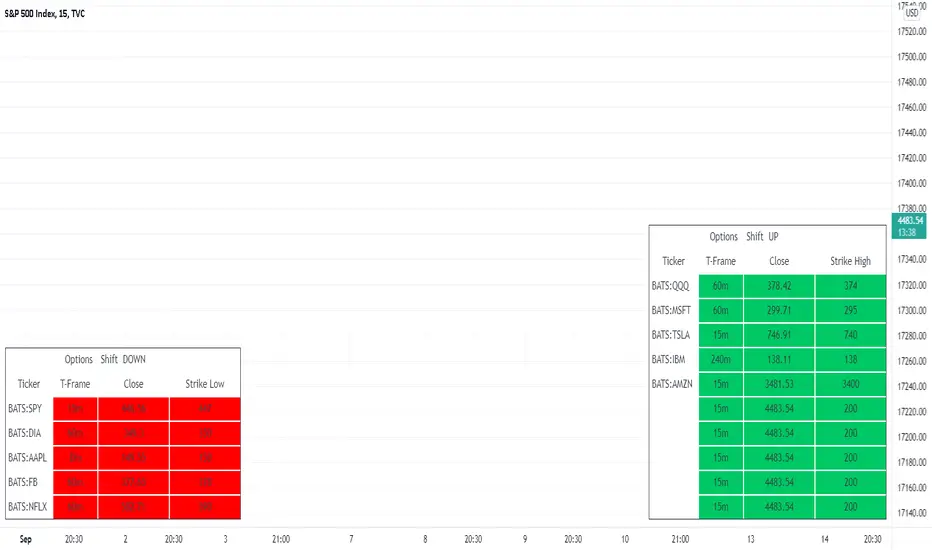
MTF - Options Strike Price - Screener & AlertsHi fellow traders ,
Pleased to share an MTF – Option Strike Price Screener.
It Screens 15 tickers for your set Strike Prices in the input column or you can also set the Stop Loss/target prices for your portfolio watch list in a single input window.
All you need to do is attach to any chart and set the periodicity of the to your desired alert() frequency requirement.
Now go to the input settings icon of the script and set your tickers, timeframe and option strike prices or if you would like to track your individual ticker stop loss or target prices!
Set the alert from the menu as usual click - Any alert() function call and bingo you are done!!
In all of 2-3 minutes you can set your Option Strike Alerts or TP’s or SL’s for 15 stocks of your portfolio..
Only a single alert() will track 15 tickers across multiple time frames..
Once your Alert is hit you may need to change the input settings and save as default and again set an alert() and delete the last alert()..
No more opening multiple charts and setting individual time consuming alerts().
Happy trading with TV..
Cari dalam skrip untuk "screener"
Golden Cross Screener [Pineify]Golden Cross Screener Pineify – Multi-Symbol Trend Detection Screener for TradingView
Discover the Golden Cross Screener Pineify for TradingView: a multi-symbol, multi-timeframe indicator for crypto and other assets. Customizable Golden Cross detection, robust algorithm, and intuitive screener design for smarter portfolio trend analysis.
Key Features
Multi-symbol screening across major cryptocurrencies or assets – BTCUSD, ETHUSD, XRPUSD, USDT, BNB, SOLUSD, DOGEUSD, TRXUSD (fully customizable).
Multi-timeframe analysis (e.g., 1m, 5m, 10m, 30m), enabling robust trend detection from scalp to swing.
Customizable Moving Average settings for both Fast and Slow MA (source and length).
Efficient screener table, highlighting Golden Cross events and current asset trends in one panel.
Visual cues for bullish, bearish, and cross states using intuitive color-coding and labels.
Flexible symbol and timeframe inputs to tailor the screener to any portfolio or watchlist.
How It Works
The Golden Cross Screener Pineify leverages the classic Golden Cross methodology—a bullish trend signal triggered when a shorter-term moving average crosses above a longer-term moving average. To improve robustness, you are empowered to configure both Fast MA and Slow MA periods and sources, making the detection logic applicable to any symbol, timeframe, or asset class.
Internally, the script runs dedicated calculations on each chosen symbol and timeframe, generating independent signals using exponential moving averages (EMA). Using the TradingView `request.security` function, it fetches and processes price data for up to eight portfolio assets on four timeframes, displaying the detected Golden Cross, Bullish, or Bearish states in a central screener table.
Trading Ideas and Insights
Spot emerging bullish or bearish trends across your favorite crypto pairs or trading assets in real time.
Capture prime opportunities when multiple assets align with Golden Cross signals—ideal for portfolio rebalancing or rotational strategies.
Analyze trend consistency by monitoring cross events at multiple timeframes for a given asset.
Swiftly identify when short-term and long-term momentum diverge—flagging potential reversals or trend initiations.
The Golden Cross Screener Pineify is not just a trend signal; it’s a holistic multi-asset scanner built for traders who know the power of combining technical breadth with agile timing.
How Multiple Indicators Work Together
This screener stands out with its modular approach: each asset/timeframe pair is monitored in isolation, yet displayed collectively for multidimensional market insight. Each symbol’s price action is processed through independently configured EMAs—Fast and Slow—whose crossovers are analyzed for directional bias. The implementation’s real innovation is in its screener table engine: it aggregates signals, synchronizes timeframes, and color-codes market states, allowing users to see confluences, divergences, and sector trends at a glance.
Combining Golden Cross detection with customizable moving averages and flexible multi-timeframe, multi-symbol scanning means users can fine-tune sensitivity, focus on specific signals, and adapt screener logic for scalping, swing trading, or investing.
Unique Aspects
True multi-symbol screener within the TradingView indicator framework.
Full customization of screener assets, timeframes, and moving averages.
Advanced, efficient use of TradingView table for clear, actionable visualization.
No dependency on standard, static MA settings—adjust everything to match your strategy.
Big-picture and granular trend detection in one tool, designed for both active traders and portfolio managers.
How to Use
Add the Golden Cross Screener Pineify to your TradingView chart.
Choose up to eight symbols—crypto, stock, forex, or custom assets.
Set four timeframes for screening, from lower to higher intervals.
Adjust moving average sources (price, close, etc.) and period lengths for both Fast and Slow MAs to suit your trading style.
Interpret table cells: clear labels and color indicate Golden Cross (trend shift), Bullish (uptrend), Bearish (downtrend) states for each symbol/timeframe.
React to signal alignments—deploy or rebalance positions, increase alert sensitivity, or backtest sequence confluences.
Customization
The indicator’s inputs panel gives full control:
Select which symbols to screen, making it perfect for any asset watchlist.
Pick the desired timeframes—mix daily, hourly, or minute-based intervals.
Adjust Fast and Slow MA settings: switch source type, change period length, and fine-tune detection logic as needed.
Style your screener table via TradingView settings (colors, font sizes, alignment).
Every element is customizable—adapt the Golden Cross Screener Pineify for your specific portfolio, trading timeframe, and strategy focus.
Conclusion
The Golden Cross Screener Pineify elevates multi-symbol trend detection to a new level on TradingView. By combining configurable Golden Cross logic with a powerful screener engine, it serves both precision and broad market insight—crucial for agile traders and strategic portfolio managers. Whether you’re tracking crypto pairs, stocks, forex, or a mix, this tool transforms static trend analysis into an active, multi-dimensional trading edge.

Free Stock ScreenerMissing great trade opportunities is annoying, and unless you have 12 screens or only trade one market, you are missing a lot of trades. To fix that, we created this free stock screener so you get notified instantly of potential great trading conditions in real time, right on your chart.
You get notified of trading benchmarks being met by the value being displayed on the scanner as well as a color change so that it grabs your attention and makes you aware that you should take a look at the other market and look for a potential trade. It also has built in alerts so you can have an alert notification go off when any of your trading conditions are met instead of needing to watch the scanner for color changes.
The screener will change the ticker symbol background color to red green when price is above or below the previous daily range and above or below both VWAPs. This signals that the ticker is trending, which typically means it is a great time to trade that market and follow the trend.
This free stock screener allows you to scan up to 10 different markets at the same time for various different conditions so you always know what is going on with your favorite trading symbols. If you want to scan more tickers, just add the indicator to your chart again and change the table position to the other side of the screen and update the tickers on the 2nd screener, allowing you to have 20 tickers at a time.
The scanner can be fully customized by changing the markets that it screens and turning on or off as many of them as you would like. You can also turn on or off any of the different data sets so that you only get information about trading conditions that matter to you.
The screener can provide data on any type of market, such as stocks, crypto, futures, forex and more. Each ticker can be adjusted to whatever market you would like it to scan for data in the settings panel, the only limitation is that it will not provide data for the VWAP and volume trend score if the ticker you are screening does not provide volume data.
Screener Features
The scanner will provide the following types of data for each ticker that is turned on:
Volume - Provides a volume score compared to the average volume and notifies you of higher than normal volume and volume spikes on individual bars by changing colors.
Volatility - Provides a volatility score compared to the average volatility and notifies you of higher than normal volatility by changing colors.
Oscillator - Choose between the RSI or CCI. The value of that oscillator will be displayed and will notify you when values are in extreme ranges such as overbought or oversold conditions according to the threshold values you enter in the settings panel. When those thresholds have been breached, you will be notified by it changing color.
Big Candles - Compares the current candle to average previous candle sizes, and changes color to notify you of big candles including a big top wick, big bottom wick, big candle body and big candle high to low range.
Daily Level Touches & Trends - Calculates and displays various daily candle and intraday open price levels that act as support and resistance. Notifies you when price is touching any of the daily levels that are turned on. The levels you can have on are as follows: previous day high, previous day low or previous day open. It also will notify you when price is touching the current day’s open, NY 930am open, Asia 8pm open, London 2am open and NY midnight 12am open. It will also say “Above” if price is above the previous day’s high or it will say “Below” if price is below the previous day’s low. The color of the cell will also change when a level touch is happening or price is above the previous day high or below the previous day low.
VWAP - Choose from 2 different VWAP lengths, default settings are daily and weekly VWAPs. You will get notified if price touches either of the VWAPs and they will also say “Above” or “Below” if price is currently above or below each VWAP.
How To Use The Screener To Help You Trade
The main purpose of the screener is to scan other markets and notify you of potential good trading opportunities such as price bouncing off of the daily levels or VWAPs. It can also be used to know when price is trending according to the VWAPs and daily levels. Lastly, you can use it to know how the volume and volatility trends are currently which gives you more confidence in taking a trade with this data when volume and volatility are present.
Volume Score
When volume is high, this represents a good time to trade because there are many market participants and price is likely to be volatile while there is high volume which can present a lot of good trade setups for you to take.
The volume score shown on the screener measures the current volume trend compared to previous volume trends and calculates that into a score based on 100 being the same as the previous volume trend. So any value above 100 means it is high volume and any value less than 100 means it is lower volume than normal.
In the settings panel, you can adjust the volume threshold that needs to be met for a volume notification to show up. The default setting is at 120, so you will get notified when the current volume trend score is 120 or higher or you can adjust that threshold value to whatever value you prefer.
It also will notify you when there is a volume spike on the current bar. This is determined by calculating an average of the recent volume totals and then checking to see if the current bar is greater than or equal to that average multiplied by 3. So if a single bar has volume that is greater than 3 times what the average volume is, then you will get a notification that says “Spike” to make you aware of that volume spike.
The volume trend threshold, volume spike multiplier and lookback length for the average volume used in volume spike calculations can all be adjusted in the settings panel to fit your desired preferences.
Volatility Score
High volatility can mean it is a great time to trade because the market is moving quickly and providing large enough movements that you can get in and out in a short amount of time, while still accruing decent sized trade PnL.
The volatility score will calculate the current volatility for each market compared to previous conditions and then divide the current volatility by the average volatility to give you a volatility score. Anything over 100 means the market is decently volatile and you should look at that market to find potential trade setups to execute on. Anything below 100 means the market is not very volatile and it is usually best to just wait until volatility returns before you start trading again.
The screener will notify you when the volatility score is above the threshold you set. The default value is set to 90, but can be adjusted to your preference. Pay attention to any market that shows an alert and take a look at that chart because the high volatility may present a good trade setup for you in the near future.
Oscillator Score
The oscillator data can be switched between Relative Strength Index(RSI) and Commodity Channel Index(CCI).
The RSI provides a value between 0 and 100 that indicates the momentum and strength of the recent price action. Many traders use the extremes of the 0-100 range to signal overbought or oversold conditions and use that as a sign to look for price to reverse in the near future. The typical values used for this and the default settings to provide notifications are: 70 for overbought and 30 for oversold. The scanner will notify you when the RSI value is considered overbought or oversold so you know to take a look at the chart and analyze if it is ready for a trade to be taken.
The CCI provides a value that can be used to determine the trend strength of the underlying asset when the oscillator moves above 100 or below -100. These extreme values are outside of the normal accumulation range and signify that price is moving strongly in that direction so it may be a good time to take a trade in the direction of the trend. The scanner will show you the value of the CCI for each market and notify you if that value is above 100 or below -100.
Both RSI and CCI settings can be adjusted in the settings panel to your desired settings so you have the exact oscillator settings you prefer to use as well as the exact values that you want to use for being notified.
Big Candles
Big candles can mean that many traders are buying or selling at the same time and many times indicate a good signal to trade in that same direction. That is why we included this calculation in the screener, so you are always aware when a large candle prints.
It calculates the average size of the recent candles and then uses that average as the benchmark to determine if the current candle is considered big and worthy of notifying you to take a look at that chart.
You can adjust the multiplier used for the big candle threshold to whatever you desire, but the default setting is 3 which means the candle will be considered big and notify you if it is 3 times as large as an average candle.
The big candles data will track the following candle values and notify you with these labels:
High to Low candle size = HL
Candle Body from open to close candle size = OC
Top Wick size = TW
Bottom Wick size = BW
Daily Level Touches & Trend
Daily level touches are excellent levels to watch for price to bounce because they often act as support and resistance levels for intraday trading. The scanner will track each market and notify you when the current candle is touching any of the daily levels that you have turned on in the settings panel.
The main levels that are turned on by default and are useful for all markets and how they will be labeled on the scanner are as follows:
Previous Day High = High
Previous Day Low = Low
Previous Day Open = < Open
Previous Day Close = Close
Current Day Open = Open
We also included some extra levels that are useful for futures traders. They are as follows:
NY 930am Open = 930am
NY 12am Midnight Open = 12am
Asia Open at 8pm NY time = Asia
London Open at 2am NY Time = London
Watch how price reacts to these levels and then trade the bounces off of these levels if the price action confirms that it is going to respect that level.
When price is currently above the previous day high, the scanner will say “Above” and show a green color, indicating a bullish trend and that price is above the previous daily candle’s high.
When price is currently below the previous day low, the scanner will say “Below” and show a red color, indicating a bearish trend and that price is below the previous daily candle’s low.
Pay attention to when price is trending above or below the previous daily candle as those trends can provide excellent trend trading opportunities.
The daily levels that you have turned on in the settings will also show as lines on the chart and include a label next to them, identifying each level so you know what each line represents. You can turn on or off all of the lines shown on the chart in the main settings or turn them off one by one in the style panel of the settings. Labels can also be turned on or off for all of the lines in the main settings panel. You can adjust the label positioning in the Label Offset section of the settings panel.
VWAP Touches & Trend
VWAP stands for volume weighted average price and is a very popular tool that traders use to determine trend direction based on volume as well as an excellent level to trade price bounces off of.
The typical VWAP time period used is Daily, which means the volume weighted average price will reset at the beginning of a new day. We set the first VWAP to be the daily VWAP by default and the second one to be the weekly VWAP. You can adjust both of the time periods to be any of the provided time lengths that you choose.
The screener will show “Above” with a green background color when price is above the VWAP, indicating a bullish trend. It will show “Below” with a red background color when price is below the VWAP, indicating a bearish trend. When both VWAPs are showing Above or Below, you can expect price to trend in that direction, so look for pullbacks you can trade in the direction of the trend. If the VWAPs are showing different directions, then you should expect to bounce back and forth between the VWAPs, but be careful and watch out for price to break beyond either one and start a trend.
When the current candle is touching the VWAP, the scanner will change colors and say VWAP to notify you that price is touching the VWAP and you should look at that chart and analyze the market for a potential bounce off of the VWAP to trade.
Trending Market Signals
Strong trends are excellent markets to trade and can many times provide excellent trading opportunities that don’t require expert price action reading skills to be able to take winning trades from. That is why we included a signal to notify you of a strong trending market.
The strong trending market will show up as a green or red background color for the ticker name. If the color of the ticker name is green, it is notifying you that the price is above the previous daily high, above VWAP 1 and above VWAP 2 and is a good market to look for bullish trend trades. If the color of the ticker name is red, it is notifying you that the price is below the previous daily low, below VWAP 1 and below VWAP 2 and is a good market to look for bearish trend trades.
Changing The Tickers It Scans
To change the tickers that the indicator scans, scroll near the bottom of the settings panel and select the ticker symbol you want to update and then search for the exact symbol you want to use. If you want to scan less tickers, then just turn some of the tickers off that you don’t need.
Scanning More Than 10 Tickers
If you want to scan more than 10 tickers, you can add the scanner to your chart again and then just change the table position to the other side of the screen. This will allow you to scan 10 more tickers that will show up separately. Then if you want even more, just add the indicator to your chart again and update the table position until you have as many markets as you want. The table position setting can be found at the bottom of the main settings panel.
Alerts
The screener has alerts that can be used to notify you when any of the data set thresholds have been met or if price is touching one of the levels. You can set alerts for the following events:
Bullish Trend Alert - Price is above the previous daily high and above both VWAPs.
Bearish Trend Alert - Price is below the previous daily low and below both VWAPs.
High Volume Alert - Volume is higher than the threshold or a volume spike is detected.
High Volatility Alert - Volatility is higher than the threshold.
Oscillator Is Extended Alert - Oscillator value has exceeded the upper or lower threshold.
Big Candle Alert - A big candle has been detected.
Daily Level Touch Alert - One of the daily levels that is turned on is being touched.
VWAP Touch Alert - One of the 2 VWAPs are being touched.
An alert will trigger when any one of tickers on your scanner meets the alert conditions, so when you see the alert, you will need to go to your chart and look at the scanner to see which ticker it was and then navigate to that chart to look for potential trade setups.
The alerts will use the exact same settings you have configured in the settings panel to send you alert notifications. With normal settings, this could give you a lot of alerts, so if you only want alerts to fire when abnormal conditions are being met, try setting up a second screener on your chart that has very high threshold values and only has the most important level touches on. Then turn the setting "Do Not Show The Screener On The Chart" to off so the calculations will still run and fire alerts, but won't clog up your charts. This way you can only get alert notifications when major events happen but still have your normal screener settings available on your chart.
Markets This Can Be Used On
This screener uses the price action and volume data so you can use it to scan any type of market you would like as long as the ticker you are scanning has price and volume data feeds. If a market does not have volume data, then it will just show NaN in the volume row and the VWAP rows will not show anything.

Ichimoku Screener [Pineify]Advanced Multi-Timeframe Ichimoku Screener - Complete Market Analysis Tool
This sophisticated Ichimoku Screener represents a comprehensive approach to multi-timeframe market analysis, combining four distinct Ichimoku-based indicators into a unified screening system. Unlike traditional single-symbol indicators, this screener provides simultaneous analysis across multiple assets and timeframes, enabling traders to identify optimal trading opportunities with enhanced precision and efficiency.
Key Features
Multi-asset screening capability for up to 10 symbols simultaneously
Four customizable timeframes per symbol for comprehensive analysis
Four integrated Ichimoku-based indicators working in harmony
Real-time visual feedback with color-coded signals
Customizable Ichimoku parameters for personalized analysis
Clean, organized table display for easy interpretation
Automated signal strength assessment and timing
How It Works
The screener employs the traditional Ichimoku Kinko Hyo methodology, utilizing five core components: Conversion Line (Tenkan-sen), Base Line (Kijun-sen), Leading Span A (Senkou Span A), Leading Span B (Senkou Span B), and displacement calculations. Each component is mathematically calculated using specific period lengths:
Conversion Line = (Highest High + Lowest Low) / 2 over conversion period
Base Line = (Highest High + Lowest Low) / 2 over base period
Leading Span A = (Conversion Line + Base Line) / 2
Leading Span B = (Highest High + Lowest Low) / 2 over lagging span period
The screener processes these calculations across multiple securities simultaneously using TradingView's security() function, enabling real-time cross-asset analysis. The system tracks state changes using barssince() functions to provide precise timing information for each signal type.
Trading Ideas and Insights
This screener excels in identifying momentum convergence patterns where multiple Ichimoku components align across different timeframes. The most powerful signals occur when:
Cloud color aligns with price position relative to the cloud
Conversion Line crosses above/below Base Line in the same direction as cloud bias
Multiple timeframes show consistent directional bias
Entry signals appear with minimal bars since formation (indicating fresh momentum)
For trend following strategies , focus on symbols where the cloud maintains consistent color across higher timeframes while showing recent entry signals on lower timeframes. For reversal opportunities , identify assets where cloud color changes coincide with price re-entering the cloud after extended periods above or below.
The screener particularly excels in cryptocurrency and forex markets where momentum shifts can be dramatic and sustained. By monitoring multiple timeframes simultaneously, traders can identify when short-term signals align with longer-term trends, significantly improving trade success probability.
How Multiple Indicators Work Together
The four integrated indicators create a comprehensive analytical framework through synergistic interaction:
Ichimoku Cloud (IchiCld) establishes the primary trend bias by comparing Leading Span A with Leading Span B. When Span A > Span B, the cloud displays bullish characteristics; when Span A < Span B, bearish characteristics emerge. The indicator tracks duration since the last cloud color change, providing momentum persistence insight.
Ichimoku Lagging Cloud (IchiLagCld) determines price position relative to the displaced cloud formation. This indicator identifies whether current price action occurs above, below, or within the cloud structure, revealing support/resistance dynamics and trend confirmation signals.
Conversion vs Base (IchiC>Base) monitors the relationship between short-term (Conversion Line) and medium-term (Base Line) momentum. Crossovers in this relationship often precede significant price movements and provide early trend change warnings.
Ichimoku Entry (IchiEnt) synthesizes all components into actionable signals by requiring alignment between cloud bias, price position, and conversion/base relationship. This multi-factor confirmation approach significantly reduces false signals while maintaining sensitivity to genuine momentum shifts.
The mathematical foundation ensures that each indicator contributes unique information while maintaining logical consistency. The system's strength lies in requiring multiple confirmations before generating entry signals, following Ichimoku's original philosophy of comprehensive market analysis.
Unique Aspects
This implementation distinguishes itself through several innovative features:
Advanced State Tracking : Unlike standard Ichimoku indicators that show current values, this screener tracks duration since state changes , providing crucial timing information for signal freshness and momentum strength assessment.
Multi-Asset Efficiency : The screener eliminates the need to manually check multiple charts by presenting comparative analysis across assets and timeframes in a single view, dramatically improving analytical efficiency.
Customizable Visual Feedback : The color-coding system adapts to different signal types and strengths, with recent signals receiving enhanced visual prominence to draw attention to fresh opportunities.
Professional Table Architecture : The organized display accommodates up to 40 symbol-timeframe combinations (10 symbols × 4 timeframes), with intelligent pagination for optimal screen utilization.
Signal Correlation Analysis : By displaying multiple timeframes for each symbol, traders can quickly identify timeframe confluence and divergence patterns that would otherwise require extensive manual analysis.
How to Use
Symbol Configuration : Enter up to 10 symbols in the Symbol input group. Use full exchange:ticker format for optimal compatibility (e.g., "BINANCE:BTCUSDT").
Timeframe Selection : Configure four timeframes in ascending order for logical analysis progression. Recommended combinations include 1m/5m/15m/1h for intraday analysis or 1h/4h/1D/1W for swing trading.
Ichimoku Parameters : Adjust the four core parameters based on your trading style:
Conversion Line Length (default: 9) - Controls short-term momentum sensitivity
Base Line Length (default: 26) - Determines medium-term trend identification
Leading Span B Length (default: 52) - Sets long-term trend calculation period
Displacement (default: 26) - Controls forward projection of cloud structure
Signal Interpretation :
Green backgrounds indicate bullish conditions
Red backgrounds indicate bearish conditions
Numerical values show bars since last state change
"L:" prefix indicates long entry signals
"S:" prefix indicates short entry signals
"N/A" indicates neutral/transitional states
Trading Workflow : Scan for symbols showing consistent signals across multiple timeframes, prioritize fresh signals (low bar counts), and use individual charts for precise entry timing and risk management.
Customization
The screener accommodates various trading approaches through parameter adjustment:
Scalping Configuration : Use shorter periods (Conversion: 5, Base: 13, Span B: 26) with 1m/3m/5m/15m timeframes for high-frequency opportunities.
Swing Trading Setup : Employ standard parameters with 4h/1D/3D/1W timeframes for position trading across days or weeks.
Cryptocurrency Optimization : Given crypto's 24/7 nature, consider using 4h/8h/1D/3D combinations for optimal signal timing.
Symbol selection can focus on correlated assets (e.g., major cryptocurrencies) for sector analysis or diverse assets for portfolio opportunity identification. The flexible timeframe configuration allows adaptation to any market's characteristic volatility and trading patterns.
Conclusion
This Advanced Multi-Timeframe Ichimoku Screener transforms traditional single-chart analysis into a comprehensive market monitoring system. By integrating multiple Ichimoku components across various timeframes and assets, it provides traders with unprecedented analytical efficiency and signal reliability.
The mathematical rigor of traditional Ichimoku analysis combines with modern Pine Script capabilities to deliver a professional-grade screening tool. Whether used for identifying trend continuation opportunities, spotting potential reversals, or conducting broad market analysis, this screener offers the analytical depth and practical functionality required for serious trading applications.
The system's emphasis on signal confluence across multiple timeframes and indicators significantly improves trade selection quality while reducing analysis time. For traders seeking to leverage Ichimoku's proven methodology across multiple markets simultaneously, this screener represents an essential analytical upgrade to traditional single-symbol approaches.

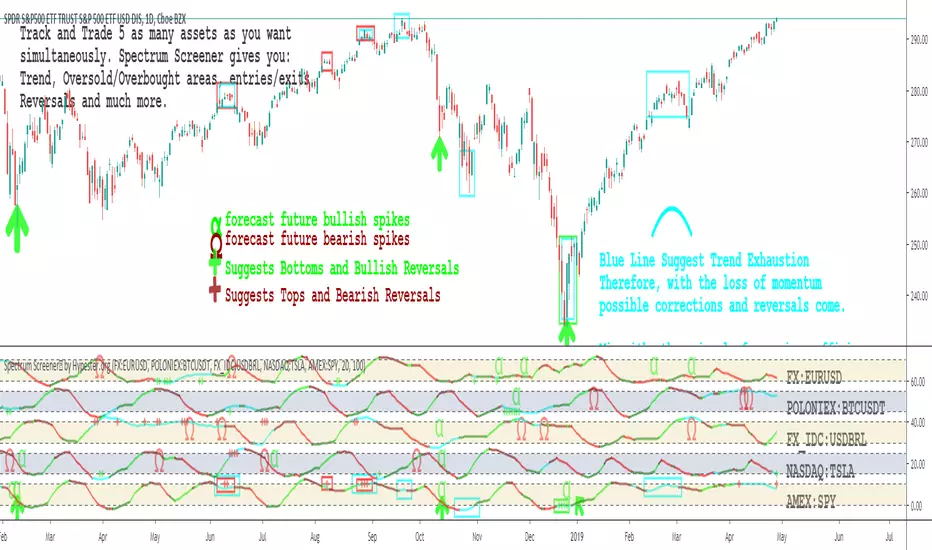
Altcoins Screener [SwissAlgo]Introduction: The Altcoins Screener at a Glance
The Altcoins Screener is a cryptocurrency analysis tool designed to provide an overview of potential trading opportunities across multiple crypto coins/tokens and categories. By combining technical analysis, price action assessment, and social metrics (via LunarCrush data), it presents market information and trading signals for a broad range of altcoins (approx. 300 USDT.P pairs of 9 crypto categories).
The screener is designed to consolidate market information onto a single chart , aiming to streamline the analysis of market conditions. It provides a consolidated market overview, which can simplify the assessment of market conditions, compared to monitoring individual charts with several layered indicators.
Key Features:
🔹 Multi-category analysis covering 300 crypto pairs of 9 categories on a single chart (Layer 1 & Top Coins, Layer2 & Scaling, Defi & Landing, Gaming & Metaverse, AI & Data, Exchanges & Trading, NFT & Social, Memes & Community, Other, User's Custom Portfolio).
🔹 Technical analysis with trade signals (Long/Short) based on an aggregated view of technical and social data points
🔹 Social sentiment integration through LunarCrush metrics (GalaxyScore, AltRank, Social Sentiment)
🔹 Real-time market scanning provides automated alerts when market conditions for specified coins/tokens potentially change.
🔹 Custom watchlist support for personalized monitoring (users can define a custom category containing a set of specific cryptocurrencies, i.e. own portfolio).
The screener presents data in a table format, using color-coded indicators to aid visual analysis. Detailed technical information is also provided. The assessments/trade signals provided by this indicator should be considered as one input among many when forming your trading strategy.
--------------------------------------
What It Does
The Altcoins Screener is a cryptocurrency analysis tool that offers:
Data Display and Analysis (Technical/Social):
🔹 Technical Metrics
* Technical Raw Data : Displays raw values for a range of technical indicators, including RSI, Stochastic RSI, DMI/ADX, RVI, ATR, OBV, and Hull Moving Averages (including their recent trends and potential significance).
Detailed view of key technical indicators, for further analysis and evaluation:
* Technical Analysis (Summary) : Provides a summarized interpretation of technical conditions based on aggregated parameters:
* Price Action
* Trend
* Momentum
* Volatility
* Volume
Summarized view of confluences for potential long/short bias:
🔹 Social Metrics (LunarCrush) : Presents data from LunarCrush®, including Galaxy Score®, AltRank®, and Social Sentiment® (including their recent trends and potential significance).
Lunarcrush data for the top 10 coins for each crypto category:
🔹 PVSRA (Price Volume & Market Makers Activity) Candles : Shows special candles highlighting potential market maker activity and volume anomalies, helping identify possible manipulation zones (including imbalance zones, i.e. price areas that market makers may revisit)
--------------------------------------
Key Features:
Automated trade signals (Long/Short) are generated based on algorithmic calculations and signal confidence levels across technical and social data points. These signals are intended to be used as one component of a broader trading strategy.
Custom sensitivity settings allow users to adjust the analysis timeframe (options: 1D, 2D, or 1W). Higher timeframes may provide a broader perspective, while the 2D setting is the default configuration.
Multi-category analysis covering a selection of approximately 300 crypto pairs across 9 predefined crypto categories.
Custom symbol selection: Users can define a custom list of up to 10 symbols for focused monitoring.
Automated Alerts to track potential trend changes across crypto categories (Long to Short to Neutral, or vice versa)
Visual Interface:
Organized table display with color-coded indicators to aid interpretation.
Clear and efficient format for scanning market information.
--------------------------------------
Target Audience
🔹 The screener is designed for cryptocurrency traders who:
Need to efficiently monitor multiple USDT perpetual futures markets
Use technical analysis in their trading decisions
Want to track sector-wide movements across crypto categories
🔹 Suitable for different trading styles:
Scalpers requiring quick market assessment
Swing traders analyzing multi-day trends
Position traders monitoring longer-term setups
The color-coded interface makes it accessible for intermediate traders while providing detailed metrics for advanced users. A basic understanding of technical analysis and crypto trading is recommended.
--------------------------------------
How It Works
The Altcoins Screener evaluates cryptocurrencies through a multi-layered analysis:
🔹 Core Analysis Components
Each parameter combines multiple indicators for comprehensive evaluation:
Price Action
EMA crossovers and momentum
Support/resistance zones
Candlestick patterns
Trend
Hull Moving Average system
DMI/ADX trend strength
Multi-timeframe confirmation
Momentum
RSI/Stochastic RSI readings
MACD convergence/divergence
Oscillator confirmations
Volatility
RVI/ATR measurements
Bollinger Bands behavior
Historical volatility trends
Volume
OBV trend analysis
Volume/price correlations
Volume profile assessment
🔹 Signal Generation Process
1. Real-time data collection across timeframes
2. Weighted indicator calculations
3. Parameter aggregation and analysis
4. Signal strength determination
5. Color-coding and alert generation
--------------------------------------
How to Use
🔹 Initial Setup:
Add the indicator to a chart (use the 1D timeframe)
Select your preferred crypto category or create a custom list
Choose between Technical Analysis or Technical Metrics view
Set data sensitivity based on your trading style
🔹 Using the Technical Analysis View:
Monitor color-coded dots for quick market assessment
Green: bullish conditions
Red: bearish conditions
Gray: neutral conditions
Check the "Trade Signal" column for potential Long/Short entries signaled by confluences among technical and/or social data points
🔹 Using the Technical Metrics View:
Review detailed numerical values
Monitor slopes (↑↓ arrows) for the most recent trend direction of each data point
Watch for pivotal points (highlighted cells): these are data points that suggest potential trend reversals
Focus on the confluence of multiple indicators
The technical metrics view corroborates the conclusions shown in the Technical Analysis View, providing more details about some critical data points.
🔹 Alert Configuration:
Enable Technical Alerts for signal notifications (which coin/token seems most suited for Long or Short trades, and which coin/token is in a neutral/uncertain state for trading = "No Trade")
Configure alert conditions based on trading style
Set timeframe-appropriate sensitivity
Monitor alert messages for trade signals
Instructions on how to set alerts are provided in the script (enable "Signals Setup Instructions" in User Interface to get a step-by-step guide about setting up alerts)
Best Practices:
Confirm signals across multiple timeframes
Use appropriate sensitivity for your trading style
Monitor multiple categories for sector rotation
Combine signals with your trading strategy
Verify signals with price action confirmation and deep dive into the charts of your potential targets
--------------------------------------
About the Settings
🔹 Crypto Category Selection
Layer 1 & Major: Top market cap coins (BTC, ETH, XRP,...), established protocols
Layer 2 & Scaling: ETH L2s, scaling solutions
DeFi & Lending: Decentralized finance protocols
Gaming & Metaverse: Gaming and virtual world tokens
AI & Data: Artificial intelligence and data projects
Exchange & Trading: Exchange tokens, trading protocols
NFT & Social: NFT platforms, social tokens
Memes & Community: Community-driven tokens
Others & Misc: Other categories
Custom Category: User-defined list (up to 10 symbols)
Data Type Options
Technical Analysis: Color-coded summary view
Technical Metrics: Detailed numerical values of some key technical data points
Sensitivity Settings
Higher: Shorter timeframe, more frequent signals
Default: Balanced timeframe, standard signals
Lower: Longer timeframe, stronger signals
Alert Settings
Technical Alerts: Trade signal notifications
Data Timeframe: Minimum 1D required
Theme: Dark/Light mode options
Note: All analysis is performed on USDT Perpetual Futures pairs from Binance
--------------------------------------
FAQ
Q: Does the screener work on other exchanges besides Binance?
A: No, it's designed specifically for Binance USDT Perpetual Futures pairs. Binance offers the highest liquidity and trading volume in the crypto derivatives market, making it ideal for technical analysis. The extensive range of trading pairs and reliable data streams help ensure more accurate signals and analysis. Using a single high-liquidity exchange also helps avoid inconsistencies that could arise from aggregating data across multiple platforms with varying liquidity levels.
Q: What's the minimum timeframe required?
A: The screener requires a minimum 1D (daily) timeframe. This requirement ensures that the technical analysis has sufficient data points for reliable signal generation. Lower timeframes can produce more noise and false signals, while daily timeframes help filter out market noise and identify stronger trends.
Q: Why are some social metrics showing "NaN"?
A: "NaN" (Not a Number) appears when cryptocurrencies don't have associated LunarCrush data. This typically occurs with newer tokens or those with lower market caps. The technical analysis remains fully functional regardless of social metric availability, as these are complementary data points.
Q: How often are signals updated?
A: Signals update with each new candle on the selected timeframe (1D, 2D, or 1W). For example, on the default 2D setting, signals are recalculated every two days as new candles form. This helps reduce noise while maintaining timely analysis of market conditions.
Q: Can I add spot trading pairs?
A: No, the screener is optimized for Binance USDT perpetual futures pairs for data consistency and analysis purposes. While spot and perpetual prices typically align closely due to arbitrage, using a single data source (Binance) and contract type (USDT perpetual) ensures uniform data quality and analysis across all pairs. This standardization helps maintain reliable technical analysis and signal generation.
Q: How many coins can I add to my custom list?
A: Users can add up to 10 custom symbols to their watchlist. This limit is designed to maintain optimal performance while allowing focused monitoring of specific assets. The custom list complements the predefined categories that cover over 300 pairs.
Q: What determines signal confidence levels?
A: Signal confidence is calculated through a weighted algorithm that considers multiple factors: trend strength (Hull MA, DMI/ADX), momentum indicators (RSI, SRSI), volatility measurements (RVI, ATR, BB), volume analysis (OBV, volume trends), and price action patterns. Higher confidence levels indicate stronger alignment across these factors.
Q: Are signals guaranteed to work?
A: No. Signals are analytical tools based on historical and current market data, not guaranteed predictions. They should be used as one component of a comprehensive trading strategy that includes proper risk management, position sizing, and additional confirmation factors. Past performance does not guarantee future results.
Q: Why does the screener need higher timeframes?
A: Higher timeframes (1D minimum) provide several benefits: reduced market noise, more reliable technical signals, better trend identification, and lower likelihood of false signals. They also align better with institutional trading patterns and allow for a more thorough analysis of market conditions across multiple indicators.
--------------------------------------
Conclusion
The Altcoins Screener is a comprehensive crypto market analysis tool that:
Scans 300+ cryptocurrencies across 9 sectors on a single chart
Combines technical indicators and social metrics for signal generation
Identifies potential trading opportunities through color-coded visuals
Saves time by eliminating the need to monitor multiple charts
The tool is suited for:
Market overview and sector rotation analysis
Quick assessment of market conditions
Technical and social sentiment tracking
Systematic trading approach with alerts
Use this screener with caution and as a complement to any other tool you use to define your trading strategy.
--------------------------------------
Disclaimer
This indicator is for informational and educational purposes only:
Not financial advice: This indicator should not be considered investment advice.
No guarantee of accuracy: The indicator's calculations and signals are based on specific algorithms and data sources, but accuracy cannot be guaranteed. Market conditions can change rapidly.
Past performance is not predictive: Past performance of the indicator's signals or any specific asset is not indicative of future results.
Substantial risk of loss: Trading cryptocurrencies involves a substantial risk of loss. You can lose money trading these assets.
User responsibility: Users are solely responsible for their own trading decisions and should exercise caution.
Independent research required: Always conduct thorough independent research (DYOR) before making any trading decisions.
Technical analysis is one of many tools: Technical analysis, including the output of this indicator, is just one tool among many and should not be relied upon exclusively.
Risk management is essential: Use proper risk management techniques, including position sizing and stop-loss orders.
Comprehensive strategy: Use this tool as part of a comprehensive trading strategy, not as a standalone solution.
No liability for trading results: The Author assumes no responsibility or liability for any trading results or losses incurred as a result of using this indicator.
No TradingView affiliation: SwissAlgo is an independent entity and is not affiliated with or endorsed by TradingView.
LunarCrush data: The indicator utilizes publicly available data from LunarCrush. LunarCrush data and trademarks are the property of LunarCrush.
Consult a financial advisor: Consult with a qualified financial advisor before making any investment decisions.
By using this indicator, you acknowledge and agree to these terms. If you do not agree with these terms, please refrain from using this indicator.

Enhanced Pressure MTF ScreenerEnhanced Pressure Multi-Timeframe (MTF) Screener Indicator
Overview
The Enhanced Pressure MTF Screener is an add-on that extends the capabilities of the Enhanced Buy/Sell Pressure, Volume, and Trend Bar Analysis . It provides a clear and consolidated view of buy/sell pressure across multiple timeframes. This indicator allows traders to determine when different timeframes are synchronized in the same trend direction, which is particularly useful for making high-confidence trading decisions.
Image below: is the Enhanced Buy/Sell Pressure, Volume, and Trend Bar Analysis with the Enhanced Pressure MTF Screener indicator both active together.
Key Features
1.Multi-Timeframe Analysis
The indicator screens various predefined timeframes (from 1 week down to 10 minutes).
It offers a table view that shows buy or sell ratings for each timeframe, making it easy to see which timeframes are aligned.
Traders can choose which timeframes to include based on their trading strategies (e.g., higher timeframes for position trading, lower timeframes for scalping).
2.Pressure and Trend Calculation
Uses Buy and Sell Pressure calculations from the Enhanced Buy/Sell Pressure indicator to determine whether buying or selling is dominant in each timeframe.
By analyzing pressures on multiple timeframes, the indicator gives a comprehensive perspective of the current market sentiment.
The indicator calculates whether a move is strong based on user-defined thresholds, which are displayed in the form of additional signals.
3.Heikin Ashi Option
The Heikin Ashi candle type can be toggled on or off. Using Heikin Ashi helps smooth out market noise and provides a clearer indication of trend direction.
This is particularly helpful for traders who want to filter out market noise and focus on the primary trend.
4.Table Customization
Table Positioning: The table showing timeframe data can be positioned at different locations on the chart—top, middle, or bottom.
Text and Alignment: The alignment and text size of the table can be customized for better visual clarity.
Color Settings: Users can choose specific colors to indicate buying and selling pressure across timeframes, making it easy to interpret.
5.Strong Movement Indicators
The screener provides an additional visual cue (🔥) for timeframes where the movement is deemed strong, based on a user-defined threshold.
This helps highlight timeframes where significant buying or selling pressure is present, which could signal potential trading opportunities.
How the Screener Works
1.Pressure Calculation
For each selected timeframe, the indicator retrieves the Open, High, Low, and Close (OHLC) values.
It calculates buy pressure (the range between high and low when the closing price is higher than the opening) and sell pressure (the range between high and low when the closing price is equal to or lower than the opening).
The screener computes the pressure ratio, which represents the difference between buying and selling pressure, to determine which side is dominant.
2.Trend Rating and Signal Generation
Based on the calculated pressure, the screener determines a trend rating for each timeframe: "Buy," "Sell," or "Neutral." (▲ ,▼ or •)
Additionally, it generates a signal (▲ or ▼) to indicate the current trend direction and whether the move is strong (based on the user-defined threshold).
If the movement is strong, a fire icon (🔥) is added to indicate that there is significant pressure on that timeframe, signaling a higher confidence in the trend.
3.Customizable Strong Move Thresholds
Strong Move Threshold: The screener uses this value to decide whether a trend is significantly strong. A higher value makes it more selective in determining strong moves.
Strong Movement Threshold: Helps determine when an additional strong signal should be displayed, offering further insight into the strength of market movement.
Inputs and Customization
The Enhanced Pressure MTF Screener is highly customizable to fit the needs of individual traders:
General Settings:
Use Heikin Ashi: Toggle this setting to use Heikin Ashi for a smoother trend representation.
Strong Move Threshold: Defines how strong a move should be to be considered significant.
Strong Movement Threshold: Specifies the level of pressure required to highlight a move with the fire icon.
Table Settings:
Position: Choose the vertical position of the screener table (top, middle, or bottom of the chart).
Alignment: Align the table (left, center, or right) to best suit your chart layout.
Text Size: Adjust the text size in the table for better readability.
Table Color Settings:
Users can set different colors to represent buying and selling signals for better visual clarity, particularly when scanning multiple timeframes.
Timeframe Settings:
The screener provides options to include up to ten different timeframes. Traders can select and customize each timeframe to match their strategy.
Examples of available timeframes include 1 Week, 1 Day, 12 Hours, down to 10 Minutes, allowing for both broad and detailed analysis.
Practical Use Case
Identifying Trend Alignment Across Timeframes:
Imagine you are about to take a long trade but want to make sure that the trend direction is aligned across multiple timeframes.
The screener displays "Buy" ratings across the 4H, 1H, 30M, and 10M timeframes, while higher timeframes (like 1W and 1D) also show "Buy" with strong signals (🔥). This indicates that buying pressure is strong across the board, adding confidence to your trade.
Spotting Reversal Opportunities:
If a downtrend is evident across most timeframes but suddenly a higher timeframe, such as 12H, changes to "Buy" while showing a strong move (🔥), this could indicate a potential reversal.
The screener allows you to spot these discrepancies and consider taking early action.
Benefits for Traders
1.Synchronization Across Timeframes:
One of the main strengths of this screener is its ability to show synchronized buy/sell signals across different timeframes. This makes it easy to confirm the strength and consistency of a trend.
For example, if you see that all the selected timeframes display "Buy," this implies that both short-term and long-term traders are favoring the upside, giving additional confidence to go long.
2.Quick and Visual Trend Overview:
The table offers an at-a-glance summary, reducing the time required to manually inspect each timeframe.
This makes it particularly useful for traders who want to make quick decisions, such as day traders or scalpers.
3.Strong Move Indicator:
The use of fire icons (🔥) provides an easy way to identify significant movements. This is particularly helpful for traders looking for breakouts or strong market conditions that could lead to high probability trades.
To put it short or to summarize
The Enhanced Pressure MTF Screener is a powerful add-on for traders looking to understand how buy and sell pressure aligns across multiple timeframes. It offers:
A clear summary of buying or selling pressure across different timeframes.
Heikin Ashi smoothing, providing an option to reduce market noise.
Strong movement signals to highlight significant trading opportunities.
Customizable settings to fit any trading strategy or style.
The screener and the main indicator are best used together, as the screener provides the multi-timeframe overview, while the main indicator provides an in-depth look at each individual bar and trend.
I hope my indicator helps with your trading, if you guys have any ideas or questions there is the comment section :D

TTM Squeeze Screener [Pineify]TTM Squeeze Screener for Multiple Crypto Assets and Timeframes
This advanced TradingView Pine script, TTM Squeeze Screener, helps traders scan multiple crypto symbols and timeframes simultaneously, unlocking new dimensions in momentum and volatility analysis.
Key Features
Screen up to 8 crypto symbols across 4 different timeframes in one pane
TTM Squeeze indicator detects volatility contraction and expansion (“squeeze”) phases
Momentum filter reveals potential breakout direction and strength
Visual screener table for intuitive multi-asset monitoring
Fully customizable for symbols and timeframes
How It Works
The heart of this screener is the TTM Squeeze algorithm—a hybrid volatility and momentum indicator leveraging Bollinger Bands, Keltner Channels, and linear momentum analysis. The script checks whether Bollinger Bands are “squeezed” inside Keltner Channels, flagging periods of low volatility primed for expansion. Once a squeeze is released, the included momentum calculation suggests the likely breakout direction.
For each selected symbol and timeframe, the screener runs the TTM Squeeze logic, outputs “SQUEEZE” or “NO SQZ”, and tags momentum values. A table layout organizes the results, allowing rapid pattern recognition across symbols.
Trading Ideas and Insights
Spot multi-symbol volatility clusters—ideal for finding synchronized market moves
Assess breakout potential and direction before entering trades
Scalping and swing trading decisions are enhanced by cross-timeframe momentum filtering
Portfolio managers can quickly identify which assets are about to move
How Multiple Indicators Work Together
This screener unites three essential concepts:
Bollinger Bands : Measure volatility using standard deviation of price
Keltner Channels : Define expected price range based on average true range (ATR)
Momentum : Linear regression calculation to evaluate the direction and intensity after a squeeze
By combining these, the indicator not only signals when volatility compresses and releases, but also adds directional context—filtering false signals and helping traders time entries and exits more precisely.
Unique Aspects
Multi-symbol, multi-timeframe architecture—optimized for crypto traders and market scanners
Advanced table visualization—see all signals at a glance, minimizing cognitive overload
Modular calculation functions—easy to adapt and extend for other asset classes or strategies
Real-time, low-latency screening—built for actionable alerts on fast-moving markets
How to Use
Add the script to a TradingView chart (works on custom layouts)
Select up to 8 symbols and 4 timeframes using input fields (defaults to BTCUSD, ETHUSD, etc.)
Monitor the screener table; “SQUEEZE” highlights assets in potential breakout phase
Use momentum values to judge if the squeeze is likely bullish or bearish
Combine screener insights with manual chart analysis for optimal results
Customization
Symbols: Easily set any ticker for deep market scanning
Timeframes: Adjust to match your trading horizon (scalping, swing, long-term)
Indicator parameters: Refine Bollinger/Keltner/Momentum settings for sensitivity
Visuals: Personalize table layout, color codes, and formatting for clarity
Conclusion
In summary, the TTM Squeeze Screener is a robust, original TradingView indicator designed for crypto traders who demand a sophisticated multi-symbol, multi-timeframe edge. Its combination of volatility and momentum analytics makes it ideal for catching explosive breakouts, managing risk, and scanning the market efficiently. Whether you’re a scalper or swing trader, this screener provides the insights needed to stay ahead of the curve.

Ultimate UT Bot ScreenerWhat Does the Ultimate UT Bot Screener Do?
Ultimate UT Bot Screener will help you navigate UT Bot signals and backtest results for up to 40 instruments simultaneously. It scans the market for provided UT Bot indicator parameters, calculates essential metrics, and displays the information in 1 fully customizable table.
How Does It Work?
Market Scanning : The screener scans multiple instruments for the selected timeframe, ensuring you never miss an opportunity.
Customizable Parameters : Adjust the UT Bot parameters to fit your unique trading style and risk tolerance.
Filtering and Sorting : Use advanced filtering and sorting options to narrow down the results based on your specific criteria.
Alerts and Notifications : Set up custom alerts to stay updated on important market movements and potential trades.
Visual Customization : Tailor the screener's visual appearance to suit your preferences, making data interpretation effortless.
Currently, Ultimate UT Bot Screener Supports 13 columns:
Price - the last price of the instrument
UT Signal - last UT bot signal. Value in the square brackets ( for ex.) means how many bars ago the last signal fired.
Move To Revert —We have to observe the price move for the current bar to see the UT Bot signal change.
Revert Prob - probability estimation for UT Bot to revert for the current bar.
Trade History - the last five trade outcomes are coded as green(profit)/red(loss) squares.
Total Trades - total trades number for UT Bot strategy for the entire available history.
Current P&L - P&L for the open trade
Trade Avg P&L - Average P&L for the last X trades
Trade Prof - percent profitable trades from the last X trades
Profit Factor - profit factor the last X trades
Net Profit - total net Profit for the last X trades
Max DD - maximum drawdown for the last X trades Avg Bars in Trades - average trade duration for the last X trades
How to Use the Ultimate UT Bot Screener
Using the Ultimate UT Bot Screener is straightforward:
Set Up Your Screener : Choose the instruments you want to monitor and configure the columns to display the data most relevant to you.
Customize Parameters : Fine-tune the UT Bot parameters to align with your trading strategy. Filter and Sort: Apply filters to isolate the most promising trading opportunities and sort the results based on your priorities.
Monitor and Act: Keep an eye on the screener and act on the high-probability signals it generates. Set up alerts to ensure you never miss a critical trade.
Why Is the Ultimate UT Bot Screener Original and Worth Paying For?
Highly Customizable : our tool allows you to configure almost every element, from the set of columns and instruments to the UT Bot parameters and visual appearance.
User-Friendly Interface : Designed with traders in mind, the screener offers an intuitive interface that makes complex data easy to understand and act upon.
Time-Saving : By automating the market scanning and analysis process, it saves you valuable time and effort, allowing you to focus on executing your trades.
Real-Time Alerts : Stay ahead of the market with customizable alerts that notify you of important events and potential trades.
Disclaimer : Please remember that past performance may not be indicative of future results. Due to various factors, including changing market conditions, the strategy may no longer perform as well as in historical backtesting. This post and the script don't provide any financial advice.

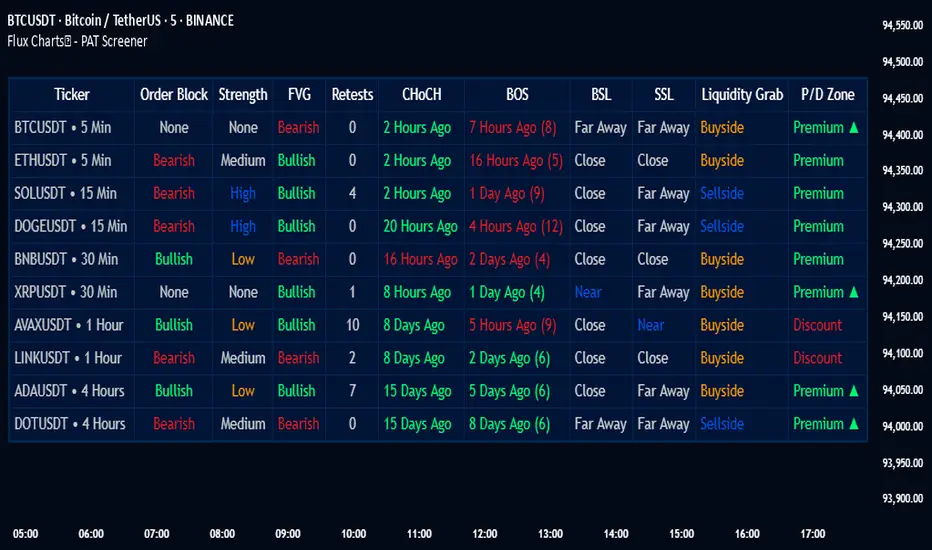
PAT Screener | Flux Charts💎 GENERAL OVERVIEW
Introducing our new Price Action Toolkit (PAT) Screener! This screener can spot trading opportunities that Price Action Toolkit offers across 8 different tickers! We believe that this screener will help you take a glimpse of the current state of the market much easier.
Features of the new Price Action Toolkit (PAT) Screener :
Finds Latest Across 8 Tickers:
Order Blocks
Breaker Blocks
Fair Value Gaps (FVG)
Inversion FVGs
Market Structures (BOS, CHoCH, CHoCH+)
Liquidity Zones
Liquidity Grabs
Premium / Discount Zones
Shows Additional Information Like :
Strength
Retests
(Bullish & Bearish) Volume
Consumption
Also :
All Features Support Tuning
Customizable Theme
📌 HOW DOES IT WORK ?
1. Order Blocks
Order blocks occur when there is a high amount of market orders exist on a price range. It is possible to find order blocks using specific formations on the chart.
The high & low volume of order blocks should be taken into consideration while determining their strengths. The determination of the high & low volume of order blocks are similar to FVGs, in a bullish order block, the high volume is the last 2 bars' total volume, while the low volume is the oldest bar's volume. In a bearish order block scenario, the low volume becomes the last 2 bars' total volume.
2. Breaker Blocks
Breaker blocks form when an order block fails, or "breaks". It is often associated with market going in the opposite direction of the broken order block, and they can be spotted by following order blocks and finding the point they get broken, i.e. price goes below a bullish order block.
The volume of a breaker block is simply the total volume of the bar that the original order block is broken. Often the higher the breaking bar's volume, the stronger the breaker block is.
The strength of Order & Breaker Blocks are calculated by the size of the block to the Average True Range (ATR) of the chart.
3. Fair Value Gaps
Fair value gaps often occur when there is an imbalance in the market, and can be spotted with a specific formation on the chart.
The volume when the FVG occurs plays an important role when determining the strength of it, so we've placed two bars on the FVG zone, indicating the high & low volumes of the FVG. The high volume is the total volume of the last two bars on a bullish FVG, while the low volume is - of the FVG. For a bearish FVG, the total volume of the last two bars is the low volume. The indicator can also detect FVGs that exist in other timeframes than the current chart.
4. Inversion Fair Value Gaps
A Fair Value Gap generally occur when there is an imbalance in the market. They can be detected by specific formations within the chart. An Inverse Fair Value Gap is when a FVG becomes invalidated, thus reversing the direction of the FVG.
IFVGs get consumed when a Close / Wick enters the IFVG zone. Check this example:
5. Market Structures
Sometimes specific market structures form and break as the market fills buy & sell orders. Formed Change of Character (CHoCH) and Break of Structure (BOS) often mean that market will change direction, and they can be spotted by inspecting low & high pivot points of the chart.
The number of times the chart recently had a BOS is displayed between brackets, Ex : (3)
6. Liquidity Zones
Buyside & Sellside Liquidity zones are where most traders place their take-profits and stop-losses in their long / short positions. They are spotted by using high & low pivot points on the chart.
7. Liquidity Grabs
Liquidity grabs occur when one of the latest pivots has a false breakout. Then, if the wick to body ratio of the bar is higher than 0.5 (can be changed from the settings) a liquidity grab has occurred.
8. Premium & Discount Zones
The premium zone is a zone that is over the fair value of the asset's price, and the discount zone is the opposite. They are formed by the latest high & low pivot points.
If the latest close price is outside the Premium or Discount zone, you will see "Premium ⬆️" or "Discount ⬇️". These mean that the price is currently higher than the premium zone or lower than the discount zone.
🚩UNIQUENESS
This screener offers a comprehensive dashboard for traders, combining multiple analytical elements with customizable settings to aid in decision-making across different tickers and timeframes. We believe that this will help traders spot trading opportunities much easier by providing crucial information in a single dashboard. Our new screener contains of common elements like Order & Breaker Blocks, Fair Value Gaps & IFVGs as well as rather unique elements like Liquidity Grabs . With the use of up to 8 tickers & timeframes , you can easily take a look at the bigger picture of the market. We recommend reading the "How Does It Work" section of the description to get a better understanding about how this indicator is unique to others.
⚙️SETTINGS
1. Tickers
You can set up to 8 tickers for the screener to scan here. You can also enable / disable them and set their individual timeframes.
You can enable / disable Retests, Strength, Consumption and (Bullish & Bearish) Volume for :
Order Blocks (Retests, Strength, Bullish & Bearish Volume)
Breaker Blocks (Retests, Strength, Volume)
Fair Value Gaps (Retests, Consumption, Strength, Bullish & Bearish Volume)
Inversion Fair Value Gaps (Retests, Consumption, Strength, Volume)
2. Order Blocks
Enabled -> Enables / Disables Order Blocks
Zone Invalidation -> Select between Wick & Close price for Order Block Invalidation.
Swing Length -> Swing length is used when finding order block formations. Smaller values will result in finding smaller order blocks.
3. Breaker Blocks
Enabled -> Enables / Disables Breaker Blocks
Zone Invalidation -> Select between Wick & Close price for Breaker Block Invalidation.
4. Fair Value Gaps
Enabled -> Enables / Disables Fair Value Gaps
Zone Invalidation -> Select between Wick & Close price for FVG Zone Invalidation.
Zone Filtering -> With "Average Range" selected, algorithm will find FVG zones in comparison with average range of last bars in the chart. With the "Volume Threshold" option, you may select a Volume Threshold % to spot FVGs with a larger total volume than average.
FVG Detection -> With the "Same Type" option, all 3 bars that formed the FVG should be the same type. (Bullish / Bearish). If the "All" option is selected, bar types may vary between Bullish / Bearish.
Detection Sensitivity -> You may select between Low, Normal or High FVG detection sensitivity. This will essentially determine the size of the spotted FVGs, with lower sensitivities resulting in spotting bigger FVGs, and higher sensitivities resulting in spotting all sizes of FVGs.
5. Inversion Fair Value Gaps
Zone Invalidation -> Select between Wick & Close price for IFVG Zone Invalidation. This setting also switches the type for IFVG consumption.
6. Market Structures
Break Of Structure (BOS) -> If the current structure of the market is broken in a bullish or bearish direction, it will be displayed.
Change Of Character (CHoCH) -> If the market shifts into another direction, it will be displayed.
Change Of Character+ (CHoCH+) -> This will display Change Of Characters detected with higher sensitivity if enabled.
7. Liquidity Zones
Buyside Liquidity -> Enables / Disables Buyside Liquidity
Sellside Liquidity -> Enables / Disables Sellside Liquidity
8. Liquidity Grabs
Pivot Length -> This setting determines the range of the pivots. This means a candle has to have the highest / lowest wick of the previous X bars and the next X bars to become a high / low pivot.
Wick-Body Ratio -> After a pivot has a false breakout, the wick-body ratio of the latest candle is tested. The resulting ratio must be higher than this setting for it to be considered as a liquidity grab.
9. Premium & Discount Zones
Enabled -> Enables / Disables Premium & Discount Zones.
10. Style
You can customize the visual looks of the screener here.
Cuban's Asset ScreenerCuban's Asset Screener is a tool designed to view the health of the entire market in a single charting window, using a multi-timeframe, real-time heatmapped asset screener built natively within Tradingview.
You can use this tool to aggregate and display critical information required to identify your favorite trade ideas using other Cuban's Edge tools. Although the screener currently uses pre-built lists for over 200+ Binance and Bybit Futures pairs, the tool comes with custom watchlist support, allowing you to add as many additional assets as your screen and browser will support.
Currently tracking range positions and a custom cross asset delta function from Cuban's Pair Trading Index, the screener has an in-built sorting function which orders assets by similar market structure and colors them relative to their performance against the user's comparison asset -- their current chart ticker.
Cuban's Asset Screener is also valuable as a tool to monitor performance of your portfolio against any benchmark asset, by using the 'Asset Redenomination' option within the settings. This allows the user to redenominate the entire screener easily using their current chart ticker.
In order to setup the Asset Screener, the user will need to select an 'Asset List' and a 'Screen Location' value. This will load the screener into a set position on screen, from right to left. In order to add additional assets, multiple instances of the asset screener will need to be loaded on screen.
With this indicator, users get the option to adjust the following:
range positioning lookback
asset redenomination for range positioning
asset sorting order
screen location
multi-timeframe support
live pricing for PTI values
in-built asset lists for 200+ assets
TO DO:
add market filters to the coloring
add tradfi asset lists

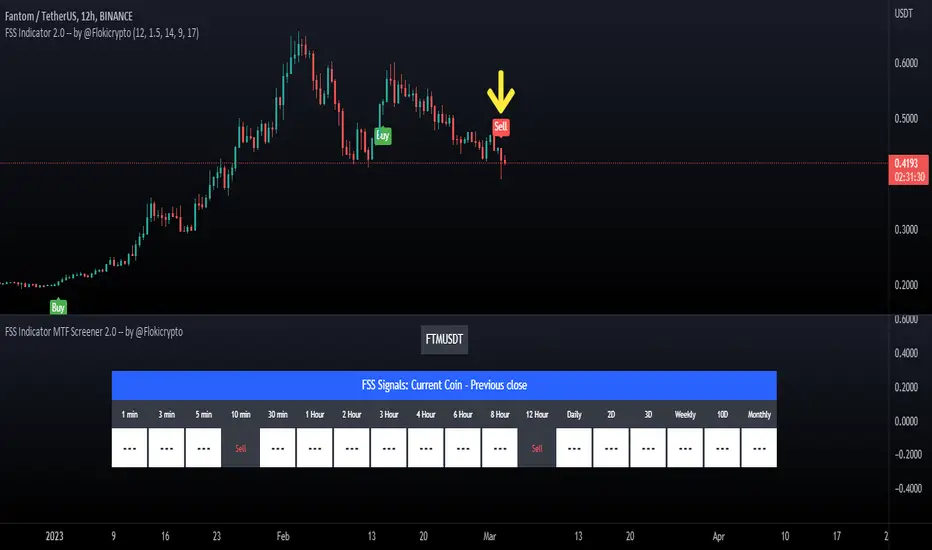
FSS Indicator MTF Screener 2.0 -- by @FlokicryptoFSS Indicator MTF Screener is built so that the user can scan the target coin quickly to see on which timeframes FSS Buy or Sell signals have shown up in the last closed candle on a range of timeframes. This saves both the time and effort of having to browse through multiple timeframes. By using this script the user will be able to quickly screen through a list of coins and read what the FSS indicator is telling, without touching the timeframe. Its uniqueness and originality is tightly related to its tandem work with the FSS Indicator (You can find the description of this indicator below).
The screener is true Multi Time Frame, in that the information is fetched via security requests on other timeframes, and not calculated within the script. This script only makes use of the last close candle, but later versions could include the current candle.
Above you can see a Sell signal on FTMUSDT on the 12H Timeframe on the chart and its corresponding signal on the Screener just under the chart.
Below is another example of the S&P/TSX Composite Index printing a 12H Buy signal on that same 12H Timeframe and its corresponding signal within the screener window.
** The format of the table, cells and text can be changed without notice, but it is my plan to make as many things as possible with regards to the table, editable by the user in the long term.
About the FSS Indicator:
This FSS Indicator script (which is included within this screener) is unique not only in that it removes the need for the user to run each of these indicators individually; it provides an ‘at-a-glance’ summary of the aggregate indicator data, while also providing the user a simultaneous recommended stop loss value based on past market behavior for the given asset and the user's tolerance to risk by editing the ATR Multiplier in the inputs.
The basic concept of the script is to apply past data to present market conditions, and through the use of that data, provide an additional confluence/confirmation signal which simultaneously provides a recommended stop loss value based on average true range (ATR).
The FSS Indicator uses a blend of :
RSI: If within a defined RSI range, increments print score.
MACD: trend and crossovers increment print score.
Histogram: increments print score if a trend of X candles is up or down.
21 EMA: Increments print score if price is above/below 21EMA.
Parabolic SAR: Increments print score if price is above/below Parabolic SAR .
These parameters generate a print score, which is then determined to be sufficient or not to print a LONG or a SHORT signal on the candle.
The indicator isn't built to find bottoms or tops, won't trigger 100% of the time, but should see a high success rate when triggered on higher timeframes. After testing on several pairs/tickers ( Bitcoin , Ethereum , XRP, DJI, SPX and others) on multiple timeframes I have seen the best results on 12-hour, Daily, 2-day, 3-day & weekly timeframes. The success criteria are as follows: Stop Loss not hitting before a rise of at least 10% in value for a long, or a loss of at least 10% in value for a short; waiting until the signal-candle closes for confirmation and back testing.
**Disclaimer: The recommendations of the Indicator/Screener are the result of back-tests and past results will never guarantee future performance of this script on any chart.**
Futures Simple FS ScreenerSimple FS Screener
This indicator allows traders to have a simple view of multiple pairs and timeframe buy/sell signals, based on the Futures FS Indicator also developed by me.
Futures FS Indicator Fundamentals
1. Exponential Moving Average (EMAs): The base indicator is composed of moving averages of 5, 10, 11, 13, 36 and 55 exponential periods.
2. Squeeze Momentum: This indicator allows the signals to go with the trend and not against it.
3. VPVR (Volume Profile Visible Range): It allows to determine the Point of Control (POC) which is the node with the highest volume profile. This can be used as an important retest point or to calculate potential support and resistance.
4. ADX (Average Directional Index): The ADX helps the indicator to estimate the strength of the movement, always considering the DI+ and DI- to not go against the trend.
5. RSI (Relative Strength Index): The RSI helps measuring the speed and magnitude of the recent price changes to evaluate overvalued or undervalued conditions in the price of that security. The indicator considers RSI 5, 13 and 50 as bottom and top, respectively.
6. MACD (Moving average convergence divergence): The MACD is a trend-following momentum indicator that shows the relationship between moving averages. The indicator uses moving averages of 5, 8 and 21).
Simple Screener Panel
This panel allows the trader to monitor multiple pairs at a single screen, giving an immediate vision of possible entries and exits (Long/Short/Strong Long/Strong Short Signals). It has the following characteristics:
It can be placed anywhere on the screen through the main menu of the indicator.
It can be combined with the same indicator multiple times, as per screener is limited to show 40 pairs, you can select the number of panels being added to adjust position one next to each other.
It strengthens colors when a pair has changed its signals in order to the trader to know immediate changes and then do the follow up
The screener shows the pairs (which can be changed within the menus) and as part of being the simple screener it shows the Long, Short, Strong Long and Strong Short Signals. Therefore, the EMAs, SQZ, ADX, VPVR, RSI and MACD are calculated internally and its data will not be shown.
For viewing all parameters, refer to the Futures FS Full Screener or the TwV Futures Indicator – FS, which are other indicators that might be on my TradingView Profile

AG Pro Crypto Screener & Signal Dashboard🚀 OVERVIEW
Welcome to the AG Pro Crypto Screener & Signal Dashboard, an institutional-grade scanner designed to find high-probability buy opportunities in the chaotic crypto market. This powerful tool is being offered completely free as an introduction to the precision and performance of the exclusive AG Pro series.
Tired of manually flipping through dozens of charts? This dashboard is your new command center. It simultaneously scans up to 40 crypto assets against a robust, multi-filter strategy. It filters out the noise and delivers a clean, actionable list of symbols that are showing combined signs of strength, momentum, and a confirmed uptrend.
🧠 THE CORE STRATEGY: A Multi-Filter Confluence
This screener doesn't rely on a single, weak indicator. A symbol only appears on the "Buy List" if it passes a strict, user-configurable set of confluence filters:
Bullish EMA Crossover: Confirms a new, bullish shift in short-term momentum by looking for a recent crossover of a Fast EMA over a Slow EMA (e.g., 20/50). The "Freshness" feature ensures the signal is recent.
RSI Momentum Filter: Ensures the asset has strong buying momentum. The signal is only valid if the RSI is above a specified level (e.g., > 50).
Long-Term Trend Filter: This is the most critical filter. It keeps you on the right side of the market by confirming the price is above a key long-term Moving Average (e.g., SMA 50, 100, 200). You trade with the trend, not against it.
MACD Crossover (Optional): For traders who want an extra layer of confirmation, you can enable a filter to check for a bullish MACD crossover.
Only when all selected conditions are met does the asset appear on your dashboard. This multi-layered approach is designed to find quality over quantity.
✨ KEY FEATURES
Dynamic 40-Symbol Scanner: Monitor your entire watchlist (up to 40 symbols) from a single chart.
Professional Signal Dashboard: A clean, sortable table displaying all active signals, last price, RSI value, and volume.
"Freshness" & "Trend" Icons: Instantly gauge signal quality.
Freshness: See how many bars ago the signal appeared (🔥 Hot / ❇️ Fresh / ⏳ Old).
Trend: A clear visual icon shows if the asset is in a long-term uptrend (🔼) or downtrend (🔽).
NEW Signal Alerts: Don't miss an opportunity. Set an alert to be notified only when a new symbol appears on the list. This non-intrusive system avoids constant, repetitive alerts.
Fully Customizable Strategy: You are in control.
Toggle any of the four main filters (EMA, RSI, Trend, MACD) on or off.
Adjust all indicator lengths (EMAs, RSI, MACD, and Trend MA) to fit your trading style.
Reliable "On-Close" Signaling: Includes an option to generate signals only on bar close, ensuring high-quality, non-repainting signals.
Clean UI: Adjustable table text size ("Tiny", "Small", "Normal", "Large") for perfect visibility on any setup.
💎 THE AG PRO DIFFERENCE
This free screener is just the beginning. It's a demonstration of the stable, high-performance, and results-driven philosophy that defines the AG Pro brand.
We believe in empowering traders with tools that provide a clear, statistical edge. While this screener is powerful, our private, premium AG Pro scripts (such as the AG Pro Trading Suite) offer a complete, institutional-grade solution for serious traders. These advanced tools feature predictive models, proprietary signal algorithms, and comprehensive risk management modules that are the result of years of professional development.
If you find value in this free tool, imagine what our full suite can do for your trading. We invite you to experience the next level of trading precision.
🛠️ HOW TO USE
Add the "🏆 AG Pro Crypto Screener & Signal Dashboard V3" to your chart.
Open the indicator's Settings.
Under the "Symbol List to Scan" tab, replace the default symbols with your own 40 preferred assets (e.g., "BINANCE:BTCUSDT", "BINANCE:ETHUSDT", "COINBASE:SOLUSD").
Under the "Filter Settings" tab, configure your desired strategy. You can start with the defaults or customize them.
(Recommended) Right-click the table and select "Create Alert". Choose the "NEW BUY" condition and "Once Per Bar Close" to be notified of new signals.
⚠️ DISCLAIMER
This script is provided for informational and educational purposes only. It does not constitute financial or investment advice. All trading involves significant risk, and past performance is not indicative of future results. Please conduct your own research and implement your own risk management strategy before making any trading decisions.

🏆 AG Pro Crypto Screener & Signal Dashboard v2.7🏆 AG Pro Multi-Crypto Screener & Signal Dashboard (Completely Free)
Stop wasting your valuable time navigating dozens of charts just to find opportunities!
This completely free and professional signal dashboard scans up to 40 Crypto, Stock, or Forex assets for you from a single screen. The AG Pro Screener is designed for traders who need to make fast, informed decisions. It monitors the market 24/7, identifies 'Buy' signals based on its robust multi-filter strategy, and presents all opportunities on a professional "at-a-glance" interface.
This is not just another indicator; it's a complete Crypto Screener and Signal Panel designed for professional traders.
AG Pro Kripto Tarayıcı ve Sinyal Paneli (Multi-Crypto Screener & Signal Dashboard)
✨ Compelling Features (All 100% Free)
Advanced Dashboard Design: A best-in-class professional table with "Zebra Stripes" for easy reading, a custom-branded title bar, and a compact layout.
Multi-Symbol Scanning: Scans up to 40 different user-defined assets (Coins, Stocks, etc.) simultaneously.
Advanced Multi-Filter Strategy (All Toggleable):
Trend Filter (SMA 200): Capture only strong signals that are aligned with the main trend.
Momentum Filter (RSI): Increase your success rate by confirming signals with relative strength (e.g., RSI > 50).
Entry Signal (EMA Crossover): The core 'Buy' signal based on a fast/slow EMA cross (e.g., 20/50).
Volume Filter: Automatically filter out low-volume, illiquid, and risky assets from your signal list.
"At-a-Glance" Visual Icons: This dashboard doesn't just give signals; it shows you the quality of the signal:
Trend Column: 🔼 (Uptrend) or 🔽 (Downtrend) icons instantly show if the signal is "with the trend."
Signal Freshness Column: Special icons show how "fresh" the signal is:
🔥 (Hot): 0-3 bars ago (A new opportunity!)
❇️ (Fresh): 4-7 bars ago
⏳ (Old): 8+ bars ago (Signal may be stale)
Fully Customizable Interface:
Adjustable Text Size: Choose your own font size (Tiny, Small, Normal) to perfectly fit the table to your screen.
Selectable Timeframe: Scan your current "Chart" timeframe, or lock the panel to a specific timeframe (e.g., "4H" or "1D").
Powerful Alert Support: Set up just one single alert to receive instant notifications for all new 'Buy' signals found across all 40 assets. Perfect for strategy automation and bot setups.
⚙️ How to Use
Add this indicator (AG Pro Screener) to your chart.
Open the Settings (⚙️) panel for the script.
In the "Symbol List" section, fill the 40 empty slots with your favorite assets (e.g., BINANCE:BTCUSDT, BINANCE:ETHUSDT, NASDAQ:AAPL, etc.).
In the "Strategy Settings" section, customize your filters like EMA lengths and RSI levels to match your personal system.
Watch the dashboard scan the market for you and deliver signals in real-time!
🙏 Support & Feedback (Don't Forget to Like!)
A lot of effort went into developing this free tool. If you find it helpful, please take one second to click the Like (👍) button and Follow me for the next scripts in the "AG Pro" series.
You can leave all your suggestions and new feature requests as a comment. Happy trading!

Bollinger Band Screener [Pineify]Multi-Symbol Bollinger Band Screener Pineify – Advanced Multi-Timeframe Market Analysis
Unlock the power of rapid, multi-asset scanning with this original TradingView Pine Script. Expose trends, volatility, and reversals across your favorite tickers—all in a single, customizable dashboard.
Key Features
Screens up to 8 symbols simultaneously with individual controls.
Covers 4 distinct timeframes per symbol for robust, multi-timeframe analysis.
Integrates advanced Bollinger Band logic, adaptable with 11+ moving average types (SMA, EMA, RMA, HMA, WMA, VWMA, TMA, VAR, WWMA, ZLEMA, and TSF).
Visualizes precise state changes: Open/Parallel Uptrends & Downtrends, Consolidation, Breakouts, and more.
Highly interactive table view for instant signal interpretation and actionable alerts.
Flexible to any market: crypto, stocks, forex, indices, and commodities.
How It Works
For each chosen symbol and timeframe, the script calculates Bollinger Bands using your specified source, length, standard deviation, and moving average method.
Real-time state recognition assigns one of several states (Open Rising, Open Falling, Parallel Rising, Parallel Falling), painting the table with unique color codes.
State detection is rigorously defined: e.g., “Open Rising” is set when both bands and the basis rise, indicating strong up momentum.
All bands, signals, and strategies dynamically update as new bars print or user inputs change.
Trading Ideas and Insights
Identify volatility expansions and compressions instantly, spotting breakouts and breakdowns before they play out.
Spot multi-timeframe confluences—when trends align across several TFs, conviction increases for potential trades.
Trade reversals or continuations based on unique Bollinger Band patterns, such as squeeze-break or persistent parallel moves.
Harness this tool for scalping, swing trading, or systematic portfolio screens—your logic, your edge!
How Multiple Indicators Work Together
This screener’s core strength is its integration of multiple moving average types into Bollinger Band construction, not just standard SMA. Each average adapts the bands’ responsiveness to trend and noise, so traders can select the underlying logic that matches their market environment (e.g., HMA for fast moves or ZLEMA for smoothed lag). Overlaying 4 timeframes per symbol ensures trends, reversals, and volatility shifts never slip past your radar. When all MAs and bands synchronize across symbols and TFs, it becomes easy to separate real opportunity from market noise.
Unique Aspects
Perhaps the most flexible Bollinger Band screener for TradingView—choose from over 10 moving average methods.
Powerful multi-timeframe and multi-asset design, rare among Pine scripts.
Immediate visual clarity with color-coded table cells indicating band state—no need for guesswork or chart clutter.
Custom configuration for each asset and time slice to suit any trading style.
How to Use
Add the script to your TradingView chart.
Use the user-friendly input settings to specify up to 8 symbols and 4 timeframes each.
Customize the Bollinger Band parameters: source (price type), band length, standard deviation, and type of moving average.
Interpret the dashboard: Color codes and “state” abbreviations show you instantly which symbols and timeframes are trending, consolidating, or breaking out.
Take trades according to your strategy, using the screener as a confirmation or primary scan tool.
Customization
Fully customize: symbols, timeframes, source, band length, standard deviation multiplier, and moving average type.
Supports intricate watchlists—anything TradingView allows, this script tracks.
Adapt for cryptos, equities, forex, or derivatives by changing symbol inputs.
Conclusion
The Multi-Symbol Bollinger Band Screener “Pineify” is a comprehensive, SEO-optimized Pine Script tool to supercharge your market scanning, trend spotting, and decision-making on TradingView. Whether you trade crypto, stocks, or forex—its fast, intuitive, multi-timeframe dashboard gives you the informational edge to stay ahead of the market.
Try it now to streamline your trading workflow and see all the bands, all the trends, all the time!

FlashTrade 20 Asset ScreenerThe FlashTrade 20 Asset Screener is a powerful screening tool written in Pinescript and designed for use in Tradingview. It simultaneously monitors a combination of seven (7) lagging and three (3) leading indicators for twenty (20) assets, such as; stocks, cryptocurrencies, or forex pairs.
The screener sends summarized numeric data as an alert to external programs that specialize in automated trading. This proprietary technology developed by the algorithmic trading firm known as FlashTrade.AI is now integrated with the rules-based trading platform TradeLab.AI.
The lagging indicators tracked by the screener are as follows:
1. The 8 Period Exponential Moving Average (8EMA): It determines whether it is over or under the 21 Period Exponential Moving Average (21EMA).
2. Two Closes of the 8 Period Exponential Average (8EMA): This confirms a trend as either bullish or bearish when it occurs over or under the 21 Period Exponential Moving Average (21EMA).
3. Ichimoku Cloud: This indicator identifies whether the price is above or below the cloud, indicating bullish or bearish trends.
4. Ichimoku Cloud: Conversion Line Above Base or Conversion Line Below Base: This measures the trend strength based on the distance between the conversion line and the base line.
5. Ichimoku Cloud: Lag Line Above Price or Lag Line Below Price: This tracks the lag line's position relative to the current price to confirm trend direction.
6. Ichimoku Cloud: Leading Cloud Green or Leading Cloud Red: This identifies the trend based on the color of the leading cloud.
7. MACD: This oscillator tracks the difference between two exponential moving averages and helps identify bullish or bearish momentum in the market.
The screener also tracks three leading indicators that primarily measure trading volume and momentum. These leading indicators are:
1. The Relative Strength Index (RSI): This oscillator measures the speed and change of price movements to identify overbought or oversold conditions in the market.
2. The Stochastic: This oscillator measures the momentum of price movements and helps identify potential trend reversals in the market.
3. The relative Vigor Index (RVGI): This indicator measures the strength of price movements by comparing the closing price to the trading range and helps identify trend reversals.
Overall, the FlashTrade 20 Asset Screener is a powerful tool for traders looking to automate their trading strategies. By monitoring multiple indicators for multiple assets simultaneously, it can identify trends and capitalize on opportunities when they present themselves.

Didi's Needles setup screener Didi's Needles setup screener
I basically used the screener created by QuantNomad , made some modifications and used the indicators from the setup
Indicators used:
Didi Index, ADX, Bollinger Bands, Trix and Stochastic.
Signals from each column:
Column 'Symbol'
Blue Symbol: When the Didi, ADX and BB are with buy signals
Yellow Symbol: When Didi, ADX and BB are with sell signals
Red Symbol: When ADX, BB, Trix and Stoch are with signals to close the trade
ADX' Column
ADX Kick: When the ADX has given a Kick (Top or Bottom). ADX was rising and starts to fall
Uptrend: When the ADX is up and below the Level and the DI+ is above the DI-
Uptrend Strong: When the ADX is up and above the Level and the DI+ is above the DI-
Uptrend Falling: When the ADX is below and above the Level and the DI+ is above the DI-
Downtrend: When the ADX is below the level and the DI- is above the DI+
Downtrend Strong: When the ADX is above the level and the DI- is above the DI+
Downtrend Falling: When the ADX is below the level and the DI- is above the DI+
Didi' Column
Buy Alert: When the Fast Average crosses the Median to the upside (as long as it is not a False Point) = Needle Alert
Sell Alert: When Fast Average Crosses Median Down (as long as it is not a False Point) = Needle Alert
Needle Buy: When slow average crosses the median down = Needle confirmation
Needle Sell: When slow moving average crosses the median to high = Needle confirmation
Fake Buy: When the fast moving average crosses the median and the slow moving average is above the median and rising = False Point (Sell signal or if you are positioned on the buy side, hold the buy or raise the hand)
Fake Sell: When the fast moving average crosses the median and the slow moving average is below the median and falling = False Point (Buy signal or if you are positioned on the sell side, hold the sell or raise your hand)
BB' Column
Open Rising: When the Bollinger Bands are open and the Base Mean (BB) is rising
Open Falling: When the Bollinger Bands are open and the Base Mean (BB) is falling
Parallel Rising: When the Bollinger Bands are parallel and rising
Parallel Falling: When the Bollinger Bands are Parallel and falling
Close: When the Bollinger Bands are closed
Trix Column
Bought: When the Trix is above the MA (trix)
Sold: When the Trix is below the MA (trix)
Stoch Column
Bought: When %K is above %D
Sold: When %K is below %D
--------------------------
Rastreador para o setup de Agulhadas do Didi
Eu basicamente usei o screener criado por QuantNomad , fiz algumas modificações e usei os indicadores do setup
Indicadores usado:
Didi Index, ADX, Bandas de Bollinger, Trix e Estocástico.
Sinais de cada coluna:
Coluna 'Symbol'
Symbol Azul: Quando o Didi, ADX e BB estão com sinais de compra
Symbol Amarelo: Quando o Didi, ADX e BB estão com sinais de venda
Symbol Vermelho: Quando o ADX, BB, Trix e Stoch estão com sinais para fechar a operação
Coluna 'ADX'
Kick ADX: Quando o ADX deu um Kick (Topo ou Fundo). ADX vinha subinte e começa cair
Uptrend: Quando o ADX está subinte e abaixo do Nivel e o DI+ está acima do DI-
Uptrend Strong: Quando o ADX está subinte e acima do Nivel e o DI+ está acima do DI-
Uptrend Falling: Quando o ADX está cainte e acima do Nivel e o DI+ está acima do DI-
Downtrend: Quando o ADX está subinte e abaixo do Nivel e o DI- está acima do DI+
Downtrend Strong: Quando o ADX está subinte e acima do Nivel e o DI- está acima do DI+
Downtrend Falling: Quando o ADX está cainte e acima do Nivel e o DI- está acima do DI+
Coluna 'Didi'
Buy Alert: Quando a média rapida cruza a mediana para cima (contanto que não seja um Ponto Falso) = Alerta da Agulhada
Sell Alert: Quando a média rapida cruza a mediana para baixo (contanto que náo seja um Ponto Falso) = Alerta da Agulhada
Needle Buy: Quando a média lenta cruza a mediana para baixo = Confirmação da Agulhada
Needle Sell: Quando a média lenta cruza a mediana para cima = Confirmação da Agulhada
Fake Buy: Quando a média rapida cruza a mediana paa cima e a média lenta está acima da mediana e subindo = Ponto Falso (Sinal de venda ou caso esteja posicionado na compra, segurar a compra ou aumentar a mão)
Fake Sell: Quando a média rapida cruza a mediana para baixo e a média lenta está abaixo da mediana e caindo = Ponto Falso (Sinal de compra ou caso esteja posicionado na venda, segurar a venda ou aumentar a mão)
Coluna 'BB'
Open Rising: Quando as Bandas de Bollingers estão abertas e a média base (BB) está subindo
Open Falling: Quando as Bandas de Bollingers estão abertas e a média base (BB) está caindo
Parallel Rising: Quando as Bandas de Bollingers estão Paralelas e subindo
Parallel Falling: Quando as Bandas de Bollingers estão Paralelas e caindo
Close: Quando as Bandas de Bollingers estão fechadas
Coluna 'Trix'
Bought: Quando o Trix está acima da MA (trix)
Sold: Quando o Trix está abaixo da MA (trix)
Coluna 'Stoch'
Bought: Quando %K está acima do %D
Sold: Quando o %K está abaixo do %D

Donchian Screener█ OVERVIEW
This is a screener script for the Donchian Channel indicator . It's an excellent indicator for trend following, a trading strategy which tries to take advantage of long, medium or short-term moves that seem to play out in various markets.
█ DESCRIPTION
The screener works by scanning through up to 10 symbols and list down symbols that are currently breaking through the upper or lower band as definied by the Donchian Channels, at which point the market signals the start of a bullish or bearish trend.
█ HOW TO USE
After adding the indicator, open the script settings and type the symbol name and length to be used on the Donchian Channels for each stock.
█ PARAMETERS
- Use High/Low Price Breakouts: check this box if you want to use price high/low instead of price close to identify breakouts
- Panel Position: choose whether you want to position the panel on the top, middle or bottom right side of the graph (default is top)
- Default Timeframe: what timeframe to use on the screener (default is daily)
- Ticker: the ticker name you want to monitor
- Length: length parameter used on Donchian Channel indicator
█ FEATURES
The screener can scan up to 10 symbols each time.
█ LIMITATIONS
The screener will scan the symbols breaking out bands on the current bar, and as such, there maybe some delays depending on the stock/ etf /crypto you choose. Some exchanges require an additional subscription to get realtime data.

Pecunia ScreenerPecunia Screener
The screener is specifically built on trend-based algorithms. When certain parameters set by us in the script are fulfilled the indicator displays the symbol of momentum stocks.
The screener screens the momentum stocks & displays the stocks to trade-in at the chosen time frame.
Color Notations:
By default, the screened stocks will be displayed in a blue color box.
Features:
1) Displays the momentum stocks to trade-in
2) Covers the Equity market
3) You can add/remove stocks from the screener as per your convenience by going to the settings of the screener indicator
Before you proceed:
We are not SEBI Registered Analysts and shall not be culpable for any loss incurred directly or indirectly. Our indicator is no holy grail system thus investment in the stock market is a subject of market risk. Investment in stocks, futures, and options trading is not suitable for every trader and involves a considerable risk of loss.
The market may fluctuate, and the user always has a risk of loss, thus, we won’t be liable for any losses incurred while using our indicator, our trading ideas, or our approach.

[blackcat] L5 Whale Jump Screener 25 NoAlertsLinkage Authorization:
When you obtain any one of the following technical indicators authorization, the other one will automatically obtain a free authorization for the same length of time:
1. L5 Whale Jump Screener 25 NoAlerts
2. L5 Whale Jump Screener 12 Alerts
Discount Authorization:
While you are authorized for any of the following technical indicators, this indicator will only need to pay 200TVC (not per month) but you obtain the authorization length as long as your longest one among all invited-only indicators .
1. L5 Whales Jump Out of Ocean X
2. L5 Zen Master
Level: 5
Background:
L5 Whale Jump Screener 25 NoAlerts is a screeener which is based on principle of L5 Whales Jump Out of Ocean X, but it has its own scheme to work as a screener, which can track 25 trading pairs at the same time. With this indicator, you will see an overall market state if your inputs are major instruments in a specific market via a colorful heat map.
Function:
By tracking multiple targets in the same section can help you increase confidence level of trading because most targets move to the same direction witin the same section. It provides a macro picture to support you know the background of your trading. Also, you can choose your trading target by comparing with others in the same section to make a better decision.
Inputs:
25 tickerids for your customization
Key Signal:
Long Whales / Banker Pump--> fuchsia color area with 0% transparency
Close Long Whales / Close Banker Pump--> red color area with 0% transparency
Short Whales / Banker Dump --> yellow color area with 0% transparency
Close Short Whales / Close Banker Dump --> green color area with 0% transparency
Long Waves Start--> fuchsia color area with 50% transparency
Short Waves Start --> yellow color area with 50% transparency
No Whale or Wave Signal --> gray color rea with 50% transparency
Pros and Cons:
ONLY suitable for discretionary trading, and does NOT support automatic trading system/bots with alerts.
Intuitive and effective, the output signal is more reliable after multi-indicator resonance
For who need alert function, you can choose anther indicator: L5 Whale Jump Screener 12 Alerts.
Why 25 Targets are Supported?
From the principle of TV principle, it should be possible to track up to 40 targets at the same time. However, TV has another condition that restricts server computing resources. When the two condition work at the same time, for the whale jump algorithm, the number of targets it can track at the same time will drop from 40 to about 26~27! In addition, this indicator needs to support the display function from the daily time frame to the 1min time frame. Therefore, the requirements for computing resources have further deteriorated. In the end, the maximum tracking number I obtained by compromise is 25 to ensure that this indicator can support 1min or second level normal display without report an error.
Remarks:
My third L5 indicator published
Closed-source
Invite-only
Redeem Fee Life Lock Guarantee
Although I take the efforts to inform the script requesters that the best way to promote trading skills is to learn from the open source scripts I released by themself and to improve their PNIE script programming skills, there are still many people asking how to obtain or pay to use BLACKCAT L4/L5 private scripts. In fact, I do not encourage people to use Tradingview Coins ( TVC ) / Cryptocurrency to redeem the right to use BLACKCAT L4/L5 scripts. However, redeeming private script usage rights through TV Coins/ Cryptocurrency may be an effective way to force more people to learn PINE script programming seriously. And then I can concentrate on answering more valuable community questions instead of being overwhelmed by L4/L5 scripting permission reqeusts.
I would like to announce a ‘Redeem Fee Lock Guarantee’ program to further simplify the L4/L5 indicator/strategy utility offering and distinguish itself from the competition. ‘Redeem Fee lock guarantee’ is one of the major initiatives by BLACKCAT as a part of overall value packaging designed to guard BLACKCAT’s followers’ against cost-overruns and operational risks usually borne by them when it comes to PINE script innovation ecosystem. The TVCs redeemed for L4/L5 a follower signs up for with BLACKCAT is their guaranteed lifetime locked in TVC Quantity/ cryptocurrency, with no special conditions, exclusions and fine print whatsoever. Based on this scheme, I can constantly refine, expand, upgrade and improve PINE script publishing to ensure the very best experiences for my followers. The 'Redeem Fee Lock Guarantee' is a step in the direction of rewarding the valuable followers. NOTE: Every L4/L5 script redeeming service is ONLY limited to TVC or Cryptocurrency ("Win$ & Donate w/ This" Addresses displayed on script page) redeeming which the 1st signed up TVC Qty/ equivalent cryptocurrency is the lifetime offered TVC Qty/ equivalent crypto.
How to subscrible this indicator?
The script subscription period only has two options of one month or one year, and its price is floating. The latest price of the script subscription is proportional to the number of likes/agrees this script has already received. Therefore, the price of subscribing to this script shows an increasing trend, and the earliest subscribers can enjoy the price of lifetime lock to this script. As the number of likes / agrees of this script increases, the subscription fee for one month and one year will also increase linearly. Whatever, the first subscription price of the use will be locked for life.
Monthly subscription and annual subscription can be done either by tradingview coins ( TVC ) or by converting into equivalent cryptocurrency at the exchange rate (1TVC=0.01USD) for redeem.
TVC payment needs to pay TVC directly in the comments under this script. Every time I authorize a new user, I will update the latest number of subscribed users and latest price for next subscription under the script comment. If there are any conflicting scenario happened to the rules and my update. My updated price based on the rule will be the final price for next subscription. The following subscribers need to pay the corresponding amount of TVC or cryptocurrency in accordance with the latest number of users and price announced by me in accordance with the rules published.
TVC redemption is the method I strongly recommend, and I hope you can complete the redemption in the comment area of this script. This is like a blockchain structure, each comment is a block, each subscription is a chain, which is conducive to open and transparent publicity and traceability to avoid unnecessary disputes.
Monthly Subscription Charges
500TVC <50 Agrees (A)
50A<850TVC<100A
100A<1000TVC<150A
150A<1350TVC<200A
200A<1500TVC<250A
250A<1850TVC<300A
300A<2000TVC<350A
350A<2350TVC<400A
400A<2500TVC<450A
450A<2850TVC<500A
500A<3000TVC<550A
550A<3350TVC<600A
600A<3500TVC<650A
650A<3850TVC<700A
700A<4000TVC<750A
750A<4350TVC<800A
800A<4500TVC<850A
850A<4850TVC<900A
900A<5000TVC<950A
950A<5350TVC<1000A
1000A<5500TVC<1050A
And so on...
Annual Subscription Charges
5000TVC <50 Agrees (A)
50A<8500TVC<100A
100A<10000TVC<150A
150A<13500TVC<200A
200A<15000TVC<250A
250A<18500TVC<300A
300A<20000TVC<300A
350A<23500TVC<400A
400A<25000TVC<450A
500A<28500TVC<550A
500A<30000TVC<550A
550A<33500TVC<600A
600A<35000TVC<650A
650A<38500TVC<700A
700A<40000TVC<750A
750A<43500TVC<800A
800A<45000TVC<850A
850A<48500TVC<900A
900A<50000TVC<950A
950A<53500TVC<1000A
1000A<55000TVC<1050A
And so on...

CHK AIH (ACTION IS HERE!)-ALMA SCREENERWe do not like to stare at the screen whole day, instead we like to jump where the
action is.... The Screener was written with this in mind
CHK AIH (ACTION IS HERE!)-ALMA BASED SCREENER
FEATURES
User can enter 3 Resolutions of his/her choice
User can select 3 Mov Avg Length of his her choice, which would be identical for all the three timeframes
User can enter stock basis his/her region's stock exchange
User can shift the screener left or right if not visible in a Multiscreen mode
Uses ALMA (Arnaud Legoux Mov Avg) as it smooth and reactive
Code is also provided below of MTF ALMA Moving Average OVERLAY on which this screener is based
LOGIC
For a particular timeframe If all the Moving Average are calibrated in one direction, it will show the requisite color.
For Example in an ideal scenario for a bull trend ALMA(5)> ALMA(13) > ALMA(21), once such a situation is identified, the screener will show green.
Yellow means lack of Calibration.
When 3 timeframes are calibrated, it becomes a high Probability Trade
BUGS
It is not allowing to enter the D/W/M timeframes, timeframe in numbers ...5/15/60 is working fine. If somebody can fix it
it would be great
LIMITATIONS
Because of TV's limitations only 4 scrips can be entered, however one add the indicator again with new scrips
//////////// CREDITS ////////////////////////////////////////////////////////////////////////////////////
//// hxxps://www.tradingview.com/script/rwdgyEZe/
/// Thank You Inno14 for graciously sharing your work. Your work has helped immensely !!!
////////////////////////////////////////////////////////////////////////////////////////////////////////
ICICIBANK
TECHMAHINDRA
YESBANK
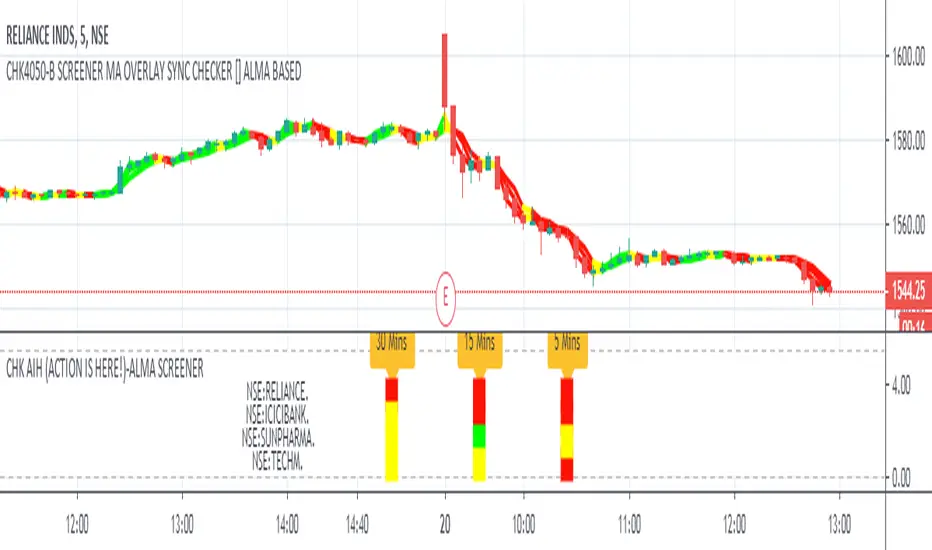
Custom ScreenerI was inspired by this idea:
With his script you can create a simple custom screener in Pine Script on your own for 40 tickets or less. But to make a separate screener for every 40 stocks sucks, so I wrote a program that generates script that allows you to switch stock sets.
Current script is generated for the Moscow stock exchange.
You can contact me if you need screener for your exchange or big set of stocks.
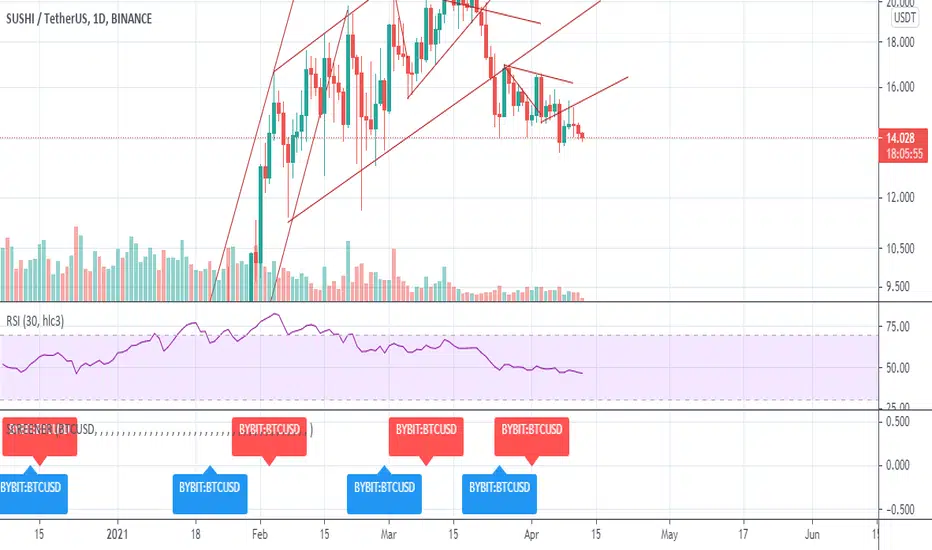
Spectrum Screener™ by HypesterSPECTRUM SCREENER™
We're releasing our ultimate tool to monitor and filter through assets. Our screener will tell you where the opportunities are happening, boosting your analysis speed, precision, profitability and drastically reducing your asset research time.
Say goodbye to staring at charts for hours
With our screener, you will spend your time where it matters, which is executing your trades. Let our Spectrum Screener™ save you the time to find where the action is.
SPOT TRADES WITHIN SECONDS
Have you ever felt confused, lost, staring at the screen for hours? Often, you find yourself overtrading and making slim calls? Spectrum Screener™ will warn you when anything worth your while is happening so you can focus on what matters, the trading.
MONITOR UNLIMITED ASSETS SIMULTANEOUSLY IN ONE SCREEN
The sky is the limit, you can track as many assets as your brain can possibly handle simultaneously before frying.
FLEX & ADVANCED MODE
If you already have a trading system going on, you just want to know when good moves will happen. That's what our flex mode will do for you; it will keep it simple and point you where the action is. If your system is not so well crafted, we offer a powerful in-depth view with a lot of insightful information in the advanced mode.
ALPHA-OMEGA VOLATILITY ALGORITHM
Based on the Richter scale modeling, we developed a proprietary volatility indicator that tells you when big moves might happen and their probable direction.
SPECTER MOMENTUM OSCILLATOR
Our special oscillator tells you if the trend is going up or down, if it’s just a correction or not, and if the asset is in a mean reversal area. All of that with one look.
FINE-TUNING PANEL
Like all other tools we offer, this indicator has its own fine-tuning panel so you can tweak the settings to your own preferences and trading style.