SMC Fake Zones + InsideBarThis indicator is useful for whom trade with "Smart Money Concept (SMC)" strategy.
It helps SMD traders to identify fake or weak zones in the chart, So they can avoid taking position in this zones.
This indicator marks "Asia session" as well as "London and New York's Lunch Time (one hour before London and NY session starts)" zones.
It also marks Inside Bar candles which SMC trades consider as order flow. You can mark every Inside Bar or only those with opposite color via setting options.
*** As we know in SMC rules
1- Supply and Demand zones in "Asia session and Lunch Times" are fake zones for SMC trading and price will engulf them in most of times.
2- "Asia session high and low" has huge liquidity and usually price sweep that in London session.
This indicator will helps traders to visually identify those Fake zones and Asia session liquidity.
* You can change session times based on your time zone in settings.
* You can set options to show all Inside Bars or only with Opposite color in settings.
Cari dalam skrip untuk "session high"

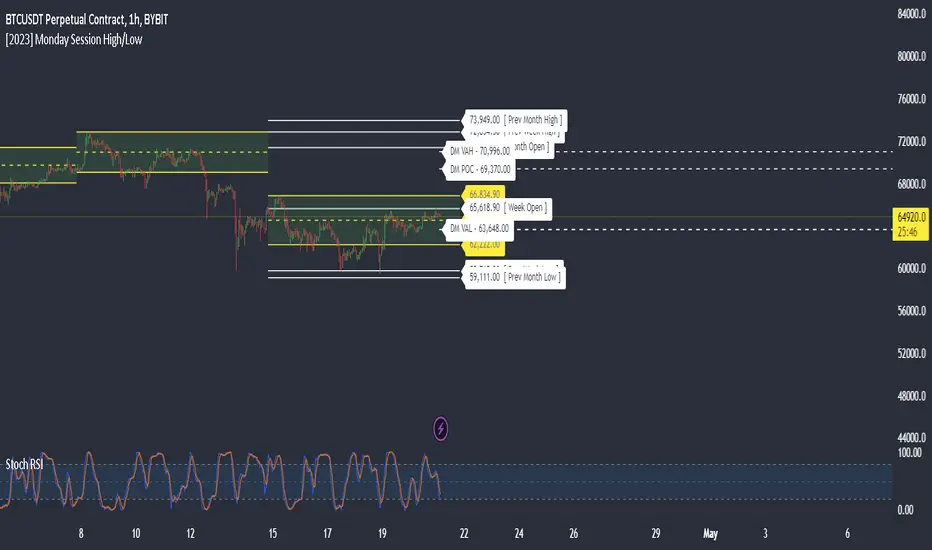
Monday Session High/LowThis script tracks and draw the High and the Low for Monday session across the whole week period.
Many crypto traders use the high and low extremes for Monday session as an confluence on how the price action during the week reacts against it.
Indian Market Sessions for BacktestingThis indicator is designed to increase the quality of your backtesting in the Indian Market.
NSE & BSE run from 9:15 am IST to 3:30 pm IST.
Naturally different times have different kinds of volatility.
On your chart you will find premarked -
Saffron - 9:15 am to 10:30 am - Opening Session - High Volatility Observed Historically
White - 10:35 am to 2:25 pm - Middle Session - Lower Volatility Observed Historically
Green - 2:30 pm to 3:30 pm - Closing Session - Medium to High Volatility Observed Historically
You will also find the start of each session marked with an arrow.
Feel free to change the times from the input settings and the color and visibility from the style settings.
_______________
Usage:
When you backtest any strategies, say moving average crossovers, also mark the sessions in your sheet which will help you further increase accuracy.
Feel free to drop your doubts in the comments.

Daily Gaps & Trapped PositionsThis script builds substantially upon the default Gaps script provided by Tradingview. Functionality was added to allow users to decide what price from the previous session is used to determine a daily gap, added support for showing gaps across all timeframes up to the daily time frame, and also allow gaps to be shown even with ETH enabled on the chart. This script provides support across normal securities, futures, and also crypto.
Users can decide between the following selections to determine if a daily gap has formed:
- Previous Session Close
- Previous Session High/Low
- Last RTH Candle High/Low
The other larger piece that was added is something called trapped positions or what some folks familiar with Market Profile would call "single prints". They could also be considered FVGs but they are a specific subset of FVGs as these must from above or below the current session's high/low.
Single prints form above or below a current session's high/low and can be considered an area where price has moved too fast in that area and price will most likely return to these areas at a later point in time. In some teachings, these are also looked at as "trapped shorts" (lighter blue box color) or "trapped supply" (yellow orange box color) which creates an area where there will be potential support (trapped shorts) or resistance (trapped supply) when this area is revisited in the future. Adding these to your chart will simply provide additional areas of interest where you may see buying or selling.
Both gaps and trapped positions have the following options:
- Show only active gaps/trapped positions. Selecting this will only show areas where price has not completely traded through the box.
- Close gaps/trapped positions partially. If this is selected, it will reduce the box size as price is traded through the area. If it is not selected, the box will only disappear once price has traded through the entire box completely.
There are some additional settings that allow you to tailor how many boxes show up on the chart. These settings are as follows:
- Max number of boxes. This setting will only plot up to this number of gaps/trapped positions.
- Minimum Deviation. This will prevent gaps/trapped positions from showing if they are too small relative to average across that last 14 periods.
- Limit Max Box Trail Length (bars). If checkbox is selected, the box will stop being extended after X number of bars given in this input.

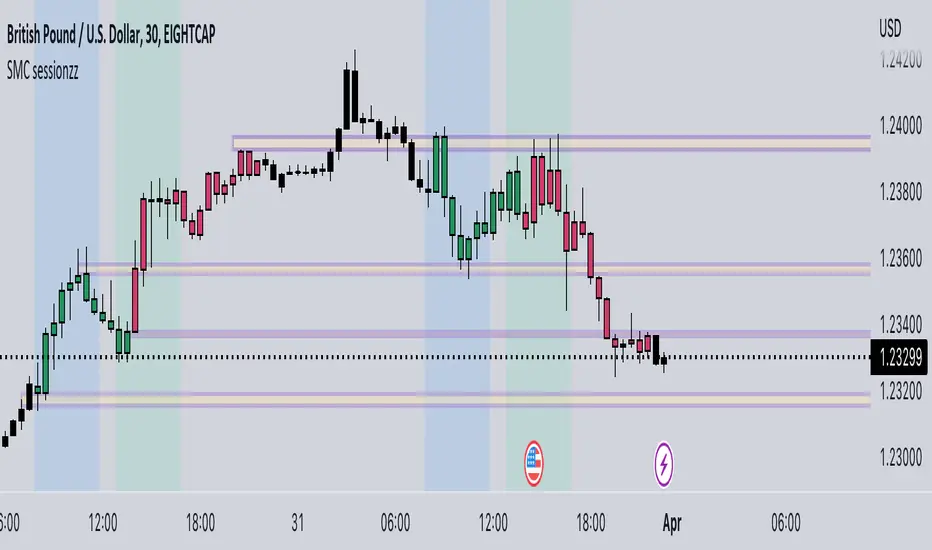
SMC sessionzz by JelleThe main function of this indicator is to make it easy to identify several smart money concepts (SMC) and ICT practices by using a single indicator. The functions themselves are not my original content, but rather a collection of several scripts with some tweaking, combined into a single indicator.
Main functions:
- Provides the ability to set bar color for London, New York and Asia sessions
- Provides the ability to set background color for London, New York and Asia sessions
- Provides the ability to indicate NY and GMT midnight on the chart by plotting vertical lines
- Provides several smart features to turn bar color and background color on/off depending on the timeframe
Usage example:
- Easily determine each session high and low by using the bar color feature
- Easily determine the daily high and low by using the vertical midnight lines
- Easily determine ICT kill zones by setting background color for each session
- Easily avoid clutter on your chart by using the timeframe filters
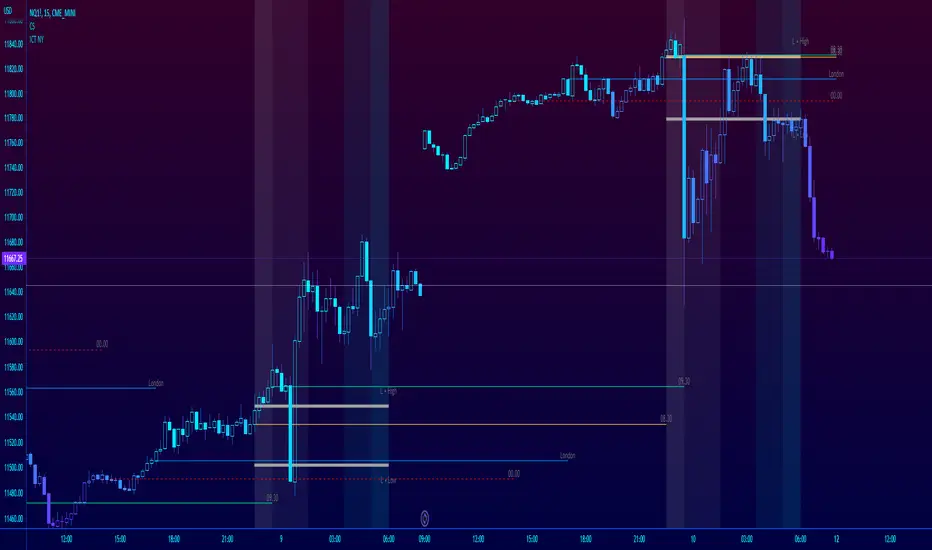
ICT NY Futures Indices Session Model - YT New York MentorshipThis indicator plots out the time periods and open lines as outlined in ICT's 2022 Mentorship and is designed specifically for the New York futures trading session.
Time zone is set to GMT-4 (NY) by default but can be changed for accommodate daylight saving in the menu.
Please note this indicator is to be used only on the 30min timeframe and below.
Here are its features:
The background color shows the morning session, in two parts (8.30am to 9.30am and 9.30am to 11.30am), then a two hour gap for lunch (ICT calls this "Dead time") and finally, the afternoon session, also to two (1.30pm to 3pm and 3pm to 4pm).
It not only shows the current killzones, but future zones as well.
These times are important; trades can be framed within these zones as taught in the mentorship.
Next are the open lines. These lines are automatically plotted and can be areas for price to react off of; they are the opening price of a candle at these times:
00.00 (New York Midnight, also known as "True Day Open")
8.30am (New York Equities pre-open)
9.30am (New York Equities open)
2.00am (London Stock Exchange open)
And lastly, London's trading session High and Low are projected forward onto the New York trading session.
These two price points are areas of liquidity that were pooled during London, but they can also often set the high or low of the day.
Please let me know if there are any bugs or if you have suggestions for the next update.
Three Legged Goose FuturesThree-Legged Goose is an all-in-one intraday trading system.
Three-Legged Goose Futures is the same system as our "Three-Legged Goose" indicator, simply optimized for futures trading by working across all futures market sessions.
Three-Legged Goose Futures ONLY works on futures charts, please use our original Three-Legged Goose for equities.
It features a sleek and customizable Opening range overlay with infinitely generating price targets, Average Daily Range Zones, Curated Anchored VWAPs, Total Volume and ATR analysis, as well as our state of the art Market Momentum Trend detection.
Three-Legged Goose also has important Daily levels, including the Previous Day's High and Low and the Current Days Open, three fully customizable Exponential Moving Averages, a customizable ema cloud, and a toggleable standard vwap .
Three-Legged Goose Futures also includes overnight highs and lows as well as previous New York Session highs and lows.
Using this indicator allows you to get rid of any unnecessary indicators that are taking up those valuable slots in TradingView.
AVWAP + ORBS:
The Opening Range Breakout system builds off of our recommended 15min opening range and does all of your price target calculations based on the width of the opening range. These targets are fully customizable within the settings,
to allow fine-tuning from ticker to ticker. We have programmed three Anchored vwaps at different time intervals to act as a dynamic trend-finding instrument. These, along with the opening range breakout system, can help you quickly spot the day's trend and dynamic support and resistance long before your standard moving averages have caught up with price intraday.
Average Daily Range Zones:
We believe these zones to be essential to trading, especially with our system. These zones tend to act as areas of major support and resistance as well as give an idea of the projected volatility of the underlying.
Market Momentum Trend Detection:
We paint our momentum analysis directly on your candles. By taking the overall Market Internals + the underlying's Price movement, we can determine areas where we feel comfortable adding risk on or taking risk off.
This will help those that struggle at identifying trends and valid reversals.
All of the default settings are our recommended settings.
Please check the Author Instructions Below for how to gain access to our indicators.

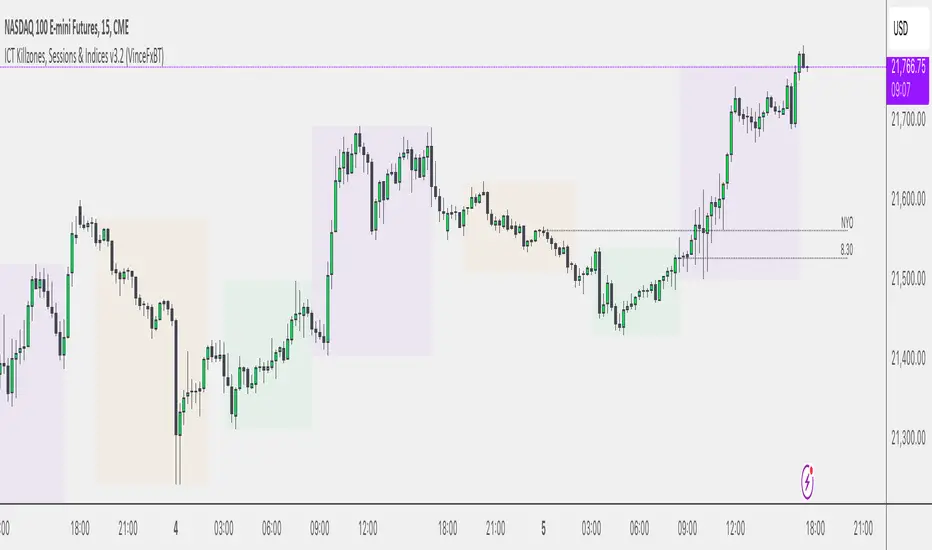
Sessions & ICT Killzones (0xCryptoVince)Sessions and ICT Killzones
All in one session and killzone script for FX or Crypto markets. It includes London, New York and Asia Sessions and Killzones.
Features
Uses UTC timezone so no timezone correction needed
Includes London, New York and Asia sessions
Includes ICT killzones
Optionally include weekends for session or killzone separately
Customize line style, width and color
Customize colors for sessions and killzones
Session highs/lows displayed on chart as a line or a box
Killzones displayed on top or bottom
FxAST Session Encapsulation + VWAP [ALLDYN]-This tool allows the user to encapsulate ( box-in ) a single session ( Asian, London, New York - Only on the 1H Time Frame) trading range and then calculates the 50% midpoint of the single session high and low (the past six sessions are displayed).
-This information is beneficial if you are looking to trade during specific Time Price Opportunities during a given session (TPO). If you understand Supply & Demand , this additional information on your chart will help filter out a lot of the noise, allowing you to focus on associated price movement during those specific TPOs around your Supply & Demand Zones.
-This tool includes VWAP (Volume Weighted Average Price)
- Why do we need it? The volume-weighted average price (VWAP) is a statistic traders use to determine the average price of an instrument based on BOTH price AND volume.
- Why is it important? VWAP is important because it provides traders with insight into both the traded instrument's trend and value.

ORB with Shorty Targets
The ORBS indicator study utilizes the theory of an Opening Range Breakout occurring on a security. The indicator uses data collected from the first thirty minute session of the trading day to create fibonacci retracements at specific positions. The 'session' high and low are derived from the first thirty minutes and used as a basis to plot these values. Fibonacci retracement lines are plotted at key positions above and below the high/low values pulled during the opening 'session'. These fibonacci retracement lines are plotted at: 0 (ORB high); 1.272; 1.618; 2.00; 2.175; 2.618; and 3.236. Levels in-between these values are known as 'ranges'. Upper lines are shown green in color and indicate key levels at which the price may react within the market. No guarantees are given nor implied - ORBs is simply a tool to help plot out key fibonacci levels at specific levels accurately and completely.
This will only work on 3min or 5mins and it is intended for intraday trading only.
ORH - opening range high
ORL - opening range low
OR50% - mid between ORH and ORL aka 50% fib
The way i use ORBS:
1. ORH break - i go long on 3min or 5 min close above ORH. I use heiken-ashi candles.
2. ORL breal - i will short on 3min or 5 min close below ORL
3. Double bottoms on reclaims of ORL - i will go long with SL being the ORL
4. Double tops on ORH considering market is weak i will short with SL being the ORH
Trendbar:
Trendbar use combo of CCI and ATR to help figure out the trend the stock is in. Stock moving below the trendbar indicates it is loosing the trend dependent on what time-frame you are using it.
Pivots:
Shorty Pivots are a collection of daily/weekly/ monthly pivots indicator that allows for plotting a daily, weekly, and monthly line on a chart. The values are pulled from the three separate resolutions (daily, weekly, and monthly), and shown on the chart each day. Calculations pulled from each respective high/low/close (divided by 3.0) for the session values.
Settings:
Show Daily/Weekly/Monthly Pivot - Shows/Hides each respective pivot .
Pivot Colors - Change the color of each pivot .
Pivot Width - Line width of the plotted pivot .
Line Style - Choose Solid, Dashed, or Dotted to view different styled lines.
Label Text Color - Choose the label text color if it clashes with your chosen line color(s).
Extend Pivot Lines to Right Offset: This allws you to extend each pivot line to the right by an offset of X bars.
Day Session Timeframe - Ignore this setting.
Pivot Adjustment Timeframe - Ignore this setting.


Deviation Burn + Pivots + Advanced stop + Midpoint CancelA session-based range strategy that places buy and sell orders at the session high and low, expecting price reactions from these levels.
Additional filters help avoid low-probability trades.

Opening Range + Prev/Pre/Post Market Hi/Lo
Tracks each day’s regular-session high/low and their bar_index.
On a new day, stores those as “prev day” values.
Draws the prev-day lines anchored at the actual high/low bars from yesterday, then extends them across today (and beyond).

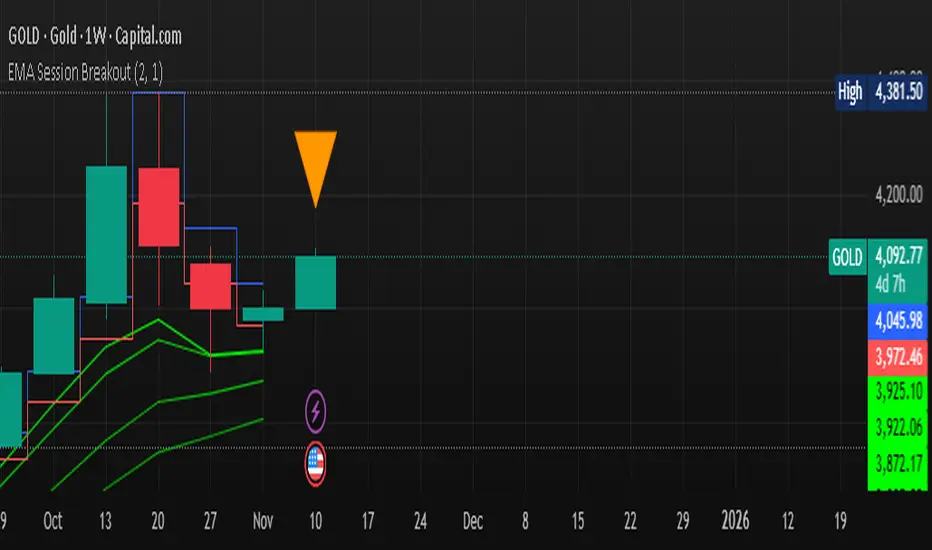
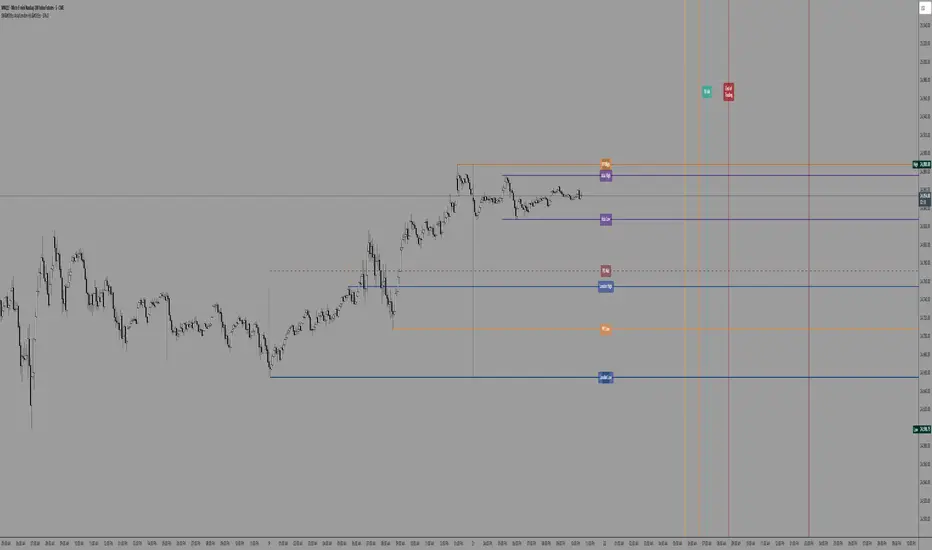
Gold Futures to Spot Converter Levels🟡 Futures to Spot Converter Levels – Map Futures Liquidity to Spot Charts
Futures to Spot Converter Levels is a utility tool for traders who watch gold futures orderflow but execute their trades on spot gold (XAUUSD).
The idea is simple: you see important prices on the futures ladder / DOM / footprint (icebergs, large resting liquidity, volume nodes, option strikes, etc.). This script converts those futures prices into their equivalent spot prices and draws them as horizontal levels on your spot chart.
It lets you trade XAUUSD while still respecting the liquidity and key levels that exist on the futures market.
🔍 Core Concept – Dynamic Futures → Spot Conversion
The script keeps a live ratio between your selected futures contract and the spot symbol:
Ratio = Spot price ÷ Futures price
On each update it:
Reads the current price of:
your chosen gold futures symbol (e.g. COMEX:GC1!),
the spot symbol (usually FX:XAUUSD).
Calculates the conversion ratio from futures to spot.
For every Futures Price you type in (4300, 4310, 4335, 4245, etc.), it multiplies that value by the ratio and finds the corresponding spot level.
Draws a horizontal line on the spot chart at that converted price, with your chosen color and style.
(Optional) Adds a label like:
GC 4300 → Spot 4148.20
As the relationship between futures and spot moves, the ratio – and therefore the projected levels – adjusts automatically.
🧠 Why this is useful for orderflow traders
Many orderflow tools (Bookmap, DOM ladders, footprint charts) are built around futures, while a lot of brokers and CFD platforms quote spot gold.
With this script you can:
Identify liquidity or absorption levels on the futures (e.g. big resting orders at GC 4300 / 4310 / 4335).
Enter those prices into the Futures Price fields.
See the equivalent XAUUSD levels drawn directly on your spot chart.
Use those projected levels as:
support / resistance zones,
targets or stop areas,
areas to look for reversals or continuation on XAUUSD.
The script itself does not read orderflow; it simply converts the prices you care about from the futures market into the spot market.
⚙️ Inputs
Gold Futures Symbol
Choose the futures contract you are tracking (default COMEX:GC1!).
Spot Symbol
The spot instrument where you want levels drawn (default FX:XAUUSD).
Show Labels
Toggle on/off labels that display both futures and converted spot prices.
Label Position
Far Left / Center / Far Right – where labels appear horizontally on the chart.
Label Size
Tiny, Small, Normal, Large, Huge.
Line Width & Line Style
Visual settings for all levels (solid / dashed / dotted).
Futures Price 1–10 + Colors
Up to 10 futures prices you want to project into spot.
Each one has its own color so you can group levels (for example: red for sell liquidity, green for buy liquidity, different colors for different sessions, etc.).
If a value is 0, that level is ignored.
📈 How to Use It in Practice
On your futures orderflow tool
Mark important prices: large liquidity, iceberg orders, VWAP bands, previous session high/low, option strikes, etc.
Example: GC has big liquidity at 4300, 4310, 4335, 4245, 4230.
In the indicator settings
Set Gold Futures Symbol = COMEX:GC1!
Set Spot Symbol = FX:XAUUSD
Enter those futures levels into Futures Price 1–5.
Pick colors to separate buy/sell zones or strength.
On the XAUUSD chart
The script draws horizontal lines at the spot-equivalent prices of your futures levels.
You can now trade spot while visually anchored to futures liquidity.
Combine with your strategy
Use these converted levels together with your own structure, orderflow, or indicator rules.
The script is not a buy/sell signal; it’s a mapping tool that keeps your spot trading aligned with the futures market.

Session H/L + Mid + 25%/75% — EvolvingPlots Session High and Low + the Midpoint between the two and also plots at 25% and 75% (Good for initial and rolling up/down stops)

Multi-EMA Session Breakout Strategythis is a strategy that use the session high and low and the EMA LOWS 2 3 6 9 110 355 AND 480
GutroThis TradingView indicator automatically plots Fibonacci retracement levels based on the day’s first confirmed swing between the session high and low (9:30 AM – 4 PM ET). It includes dynamic 0%, 38.2%, 50%, 61.8%, and 100% levels, a shaded golden zone, VWAP bands with standard-deviation envelopes, and a 9/21 EMA ribbon for trend confirmation.
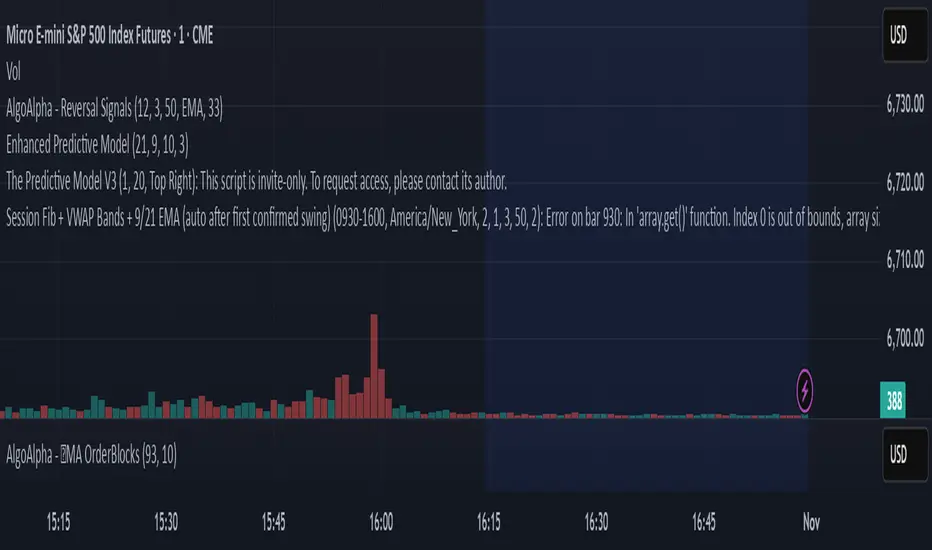
ShockDrop Alerts v1⚡ ShockDrop Alerts — Rapid Drop & Drawdown Detector
ShockDrop Alerts helps you react instantly to sudden market shocks.
It tracks both fast price drops and intraday drawdowns, plotting clean visual arrows and sending alerts when volatility spikes — so you can respond before small dips turn into major moves.
⚙️ How It Works
• Fast Drop (FAST) – detects sharp declines (e.g. 2 % in 4 minutes) using 1-minute data across any timeframe.
• Drawdown (DD) – triggers when price trades a set percentage below the day’s session high (e.g. 2 %).
Each alert type has its own independent cooldown timer and can be toggled on or off.
🎯 What You’ll See
• FAST → 🔴 red arrow above the bar (rapid drop detection)
• DD → 🟠 orange arrow below the bar (intraday drawdown)
These appear only when your defined conditions are met. Connect them to TradingView alerts for instant popup, email, mobile, or webhook notifications.
🧭 Key Features
• Detects high-velocity price shocks in real time
• Separate cooldowns for FAST and DD triggers
• Extended-hours toggle to include pre/post-market data
• Clean, clutter-free visuals — only actionable arrows
• Uses 1-minute precision data, works on any symbol or timeframe
• Supports server-side alerts (TradingView Pro +)
📬 Why Traders Use It
• Get early warnings during flash crashes or liquidity spikes
• Automate risk-based exits when markets accelerate downward
• Track SPY, QQQ, crypto, or futures for rapid reversals
• Stay alert to high-impact news events — such as surprise policy comments, earnings releases, or market-moving presidential posts — that can cause sudden volatility
Requires TradingView Pro + for continuous server-side alerting.

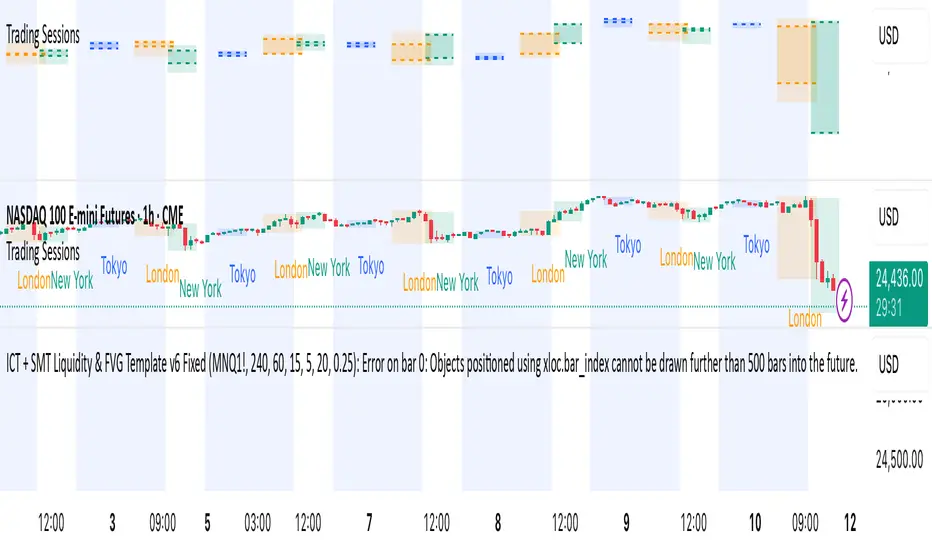
ICT + SMT Liquidity & FVG Template mnqict concepts with smt divergence for mnq. marking out liquidity sweeps, sessions, highs and lows.
Akşam Seansı PM Range (BIST 30 Futures)This indicator plots VIOP Pm session High - Low and EQ levels

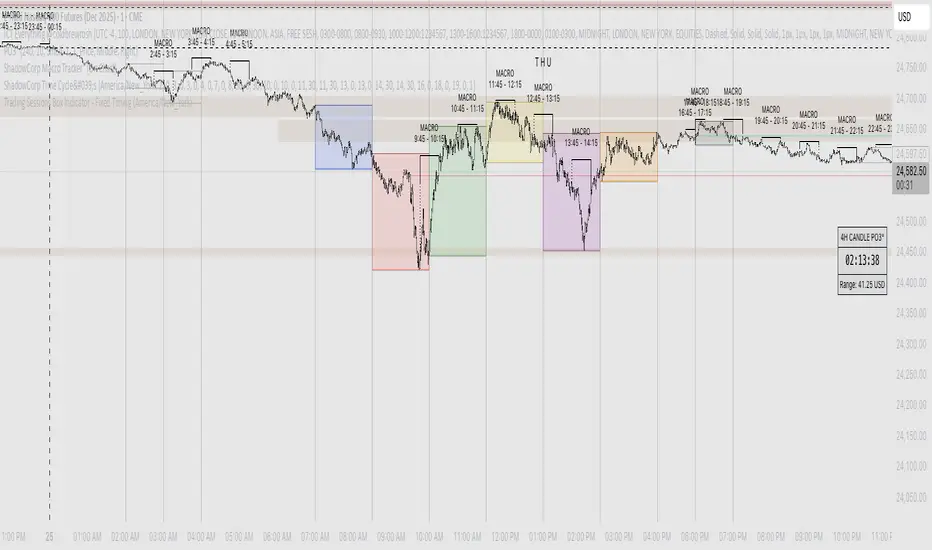
Shadow Corp 90min Boxes90-min cycle boxes, marks 90min session highs and lows with color coded boxes.
SW's Asia/London H/L'sAccurate Asia and London (with other session) High's and Low's. As well as NY Pre-market and opening bell, and end of day vertical lines. Also created 4 slots in UI to be able to set specific vertical lines with custom label options.
Multi-Session High/Low Trackertable that shows rth eth and full weekly range high and low with range difference from high and low
