Previous session High/Low – Asia London USA Overview
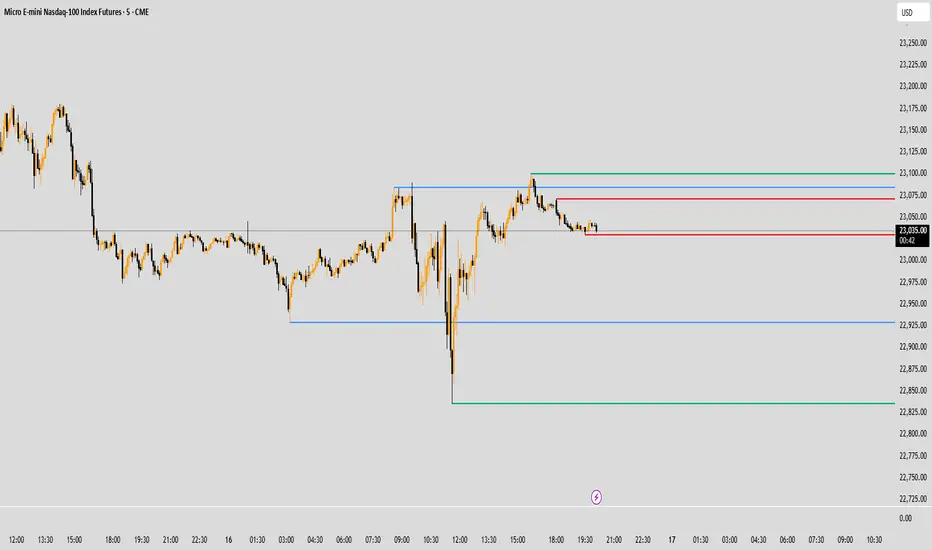
This indicator automatically plots the Previous Day’s (PD) session Highs and Lows for the Asia (Tokyo), London, and USA (New York) trading sessions.
Each session is color-coded for clarity:
🟩 Asia (Green)
🟥 London (Red)
🟦 USA (Blue)
At the close of each session, the indicator records that session’s high and low, draws horizontal lines across the chart, and labels them neatly in the center of each range — above the high and below the low for perfect visual balance.
⚙️ How It Works
The script continuously tracks the current high and low within each session.
When a session closes, those values are locked in as the PD High and PD Low.
Clean lines and centered labels are drawn immediately.
The labels automatically offset slightly above or below the line to avoid overlap, with user-controlled spacing.
This helps traders quickly identify where price interacts with the previous session’s structure, a core concept for many session-based and liquidity-based strategies.
🧭 Sessions and Timezones
Each market session runs in its native timezone, so you can align them perfectly to your chart or your preferred trading hours:
Asia Session: Default 08:30 – 11:00 (Australia/Adelaide time)
London Session: Default 08:00 – 10:00 (Europe/London)
USA Session: Default 09:30 – 16:00 (America/New_York)
You can change each session’s hours and timezone from the Inputs panel.
🎨 Customization
In the Inputs menu you can:
Toggle each session on or off
Choose line color and thickness
Enable or disable labels
Adjust vertical offset (ticks) for label spacing
“High label offset” – moves label further above the high line
“Low label offset” – moves label further below the low line
These adjustments make it easy to keep charts clean and readable on any instrument or timeframe.
📈 Practical Use
This indicator is ideal for:
Session traders who mark PD Highs/Lows as liquidity zones
London or NY session scalpers who watch for breakouts, fakeouts, or reversals
ICT / Smart Money Concepts users wanting automatic session reference levels
Anyone wanting a quick visual map of inter-session structure
Cari dalam skrip untuk "session high"

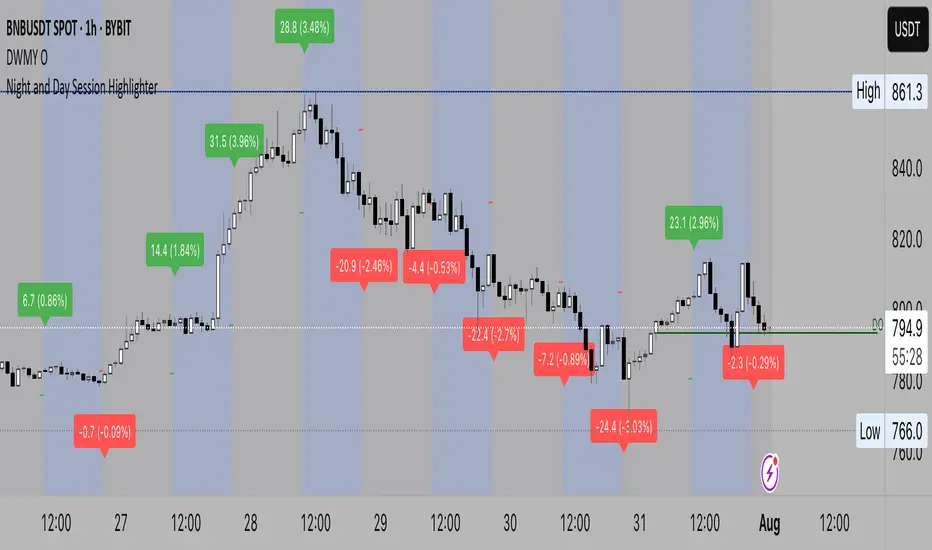
Night Session Highlight (Valehson)Highlights time range from 21:00 to 09:00 with a gray background with 90% transparency.
FX Session High/Low Bands - Last 5 EST DaysFX Session High/Low Bands – Last 5 EST Days is a powerful market-structure indicator that automatically plots the true high and low ranges of the Asian, London, and New York trading sessions — without clutter or manual marking.
Each session’s high and low are calculated in real time using New York (EST) session boundaries, then projected as clean dotted bands across the chart. Only the last five trading days are displayed, keeping your chart focused on the most relevant liquidity and reaction levels.
These session bands help traders instantly identify:
• Key intraday support and resistance
• Liquidity highs and lows targeted by later sessions
• Range expansion vs compression
• High-probability breakout, fade, and continuation zones
Color-coded session levels make it easy to distinguish between Asia, London, and New York at a glance, while automatic session detection ensures accuracy across all timeframes.
Ideal for forex and index traders who rely on session-based price behavior, institutional liquidity concepts, and repeatable intraday structure.
Stop guessing where the session levels are.
Trade with precision using the levels the market actually respects.

Rob's Session Highs and LowsThis indicator plots key intraday structure levels for index and futures traders who track the Asia, London, and New York sessions, plus overnight H1 and H4 levels, without breaking the chart autoscale.
It automatically tracks and draws:
Asia session high and low
London session high and low
Previous New York session high and low (PDH and PDL)
Overnight session H1 and H4 highs and lows
All sessions are interpreted in New York time, and the Asia, London, New York, and Overnight windows are fully configurable so you can match your own session definitions.
Features:
Separate color, style, and width controls for Asia, London, Previous Day, H1, and H4 levels
Optional labels on the chart, with the choice to pin them to the right edge or offset them into the past
Clean vertical session dividers that stay within the current daily range so they do not crush the autoscale
Price scale markers (AH, AL, LH, LL, PDH, PDL, H1H, H1L, H4H, H4L) for quick reference even when levels are off screen
Optional alert conditions for when price crosses any session high or low, as well as Overnight H1 and H4 levels
Use it on your intraday charts to quickly see which session ranges have been taken out, where the prior New York range sits, and which overnight H1 or H4 levels are in play.

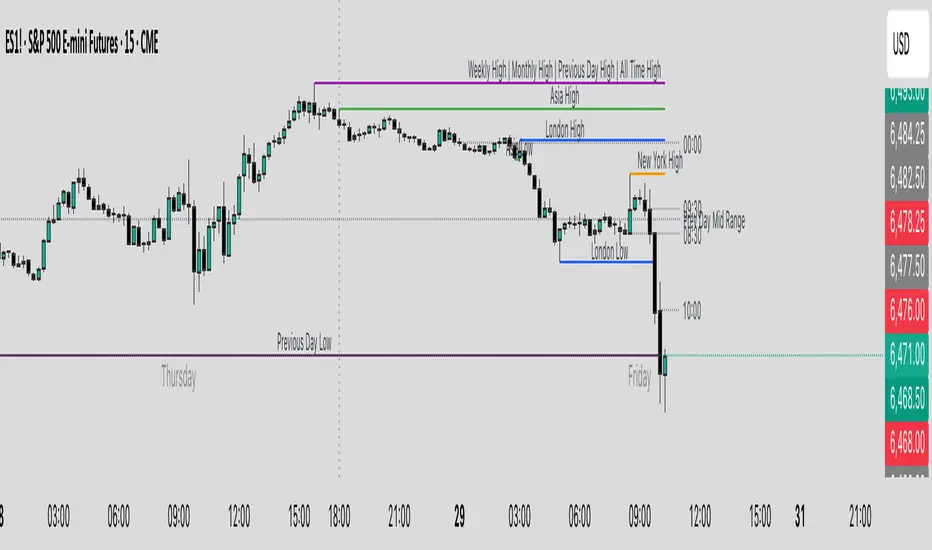
Key Levels & Session Highs/Lows by OdegosProfessional multi-timeframe support and resistance level indicator that automatically tracks and displays key price levels across different trading sessions and timeframes.
🎯 What it shows:
Session Open - Daily market open reference line
Asia & London Sessions - High/low levels from major trading sessions
Previous Day - Yesterday's actual high and low levels
Weekly & Monthly - Higher timeframe support/resistance levels
⚡ Smart Features:
Auto-combines overlapping levels with merged labels
Break detection - Lines stop when price breaks through (optional)
Timezone support - Works with any global timezone
Universal colors - Optimized for both light and dark chart themes
Clean interface - Organized settings with intuitive dropdowns
🛠️ Fully Customizable:
Individual show/hide toggles for each level type
Custom colors, line styles, and widths
Adjustable label text and positioning
Global text color override option
Perfect for day traders, swing traders, and anyone who relies on key support/resistance levels for market analysis.
Asian & London Session High/LowThis Pine Script v6 indicator plots the high and low of the Asian and London trading sessions on the chart before the New York session opens.
Asian session is defined from 00:00 to 08:00 (Europe/Sofia time).
London session is defined from 09:00 to 16:30 (Europe/Sofia time).
The session highs and lows are tracked live and updated as new candles form within the session time ranges.
At 16:30, when the New York session opens, all high/low values are reset to na to prepare for the next day.
Horizontal lines are plotted using plot.style_linebr to extend the lines until the next candle.
This tool helps traders identify key support/resistance zones formed during the most active pre-New York hours.
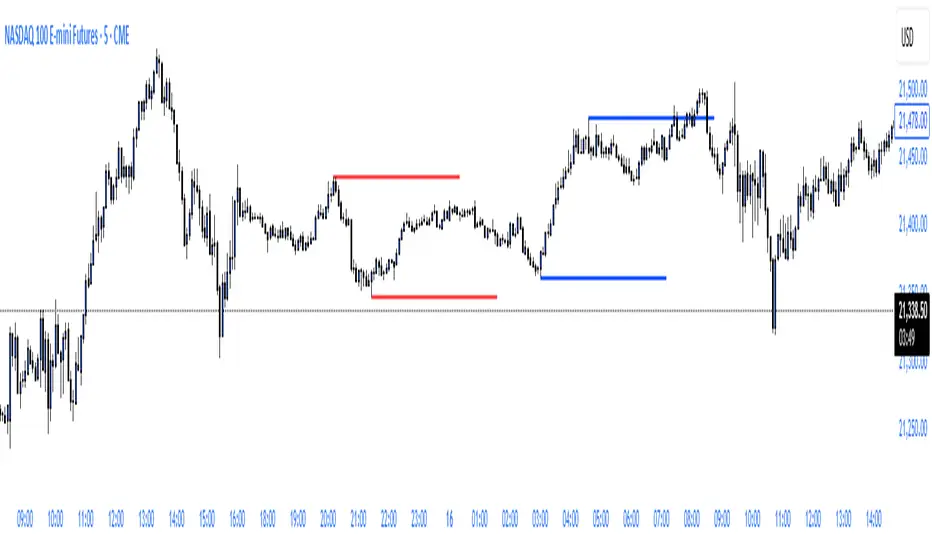
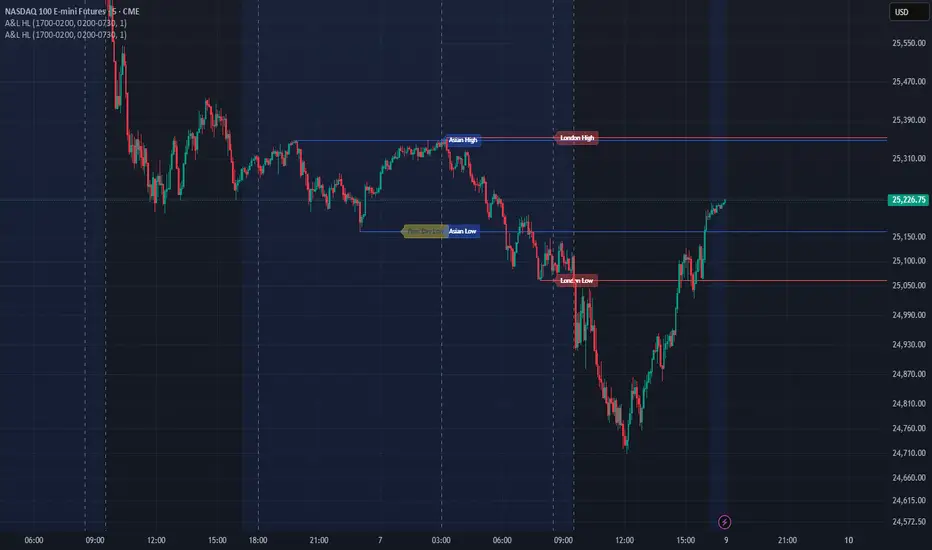
ryantrad3s session highs and lowsThis indicator allows you find London Session and Asia Session highs and lows without marking them yourself. This indicator can also help you find good draws on liquidity for the day and potential highs and lows you can target during that trading day. I recommend trading NQ and ES with this indicator because that's what I seen it work best with. The blue lines are London Session high and low and the red lines are Asia Session high and low. Hope this can save you time marking out your chart before market open.
FeraTrading Sessions High/LowThe FeraTradiang Sessions High/Low Indicator plots precise high and low levels for the New York, London, and Asian trading sessions — without any clutter.
We designed this tool for simplicity, clarity and accuracy, automatically adjusting to any timeframe and time zone — no manual setup required.
🔍 Key Features:
Clean horizontal lines marking session highs and lows
Lines start at the actual high/low
Session times:
New York: 09:30 – 17:00
London: 03:00 – 08:00
Asian: 18:00 – 03:00
Real-time updates that trail live candles
Only shows the most relevant sessions:
Yesterday’s NY
Last night’s Asia + morning continuation
Today’s London
Fully customizable:
Session colors
Session toggles
Label toggles
Line extension settings
Enable extended trading hours on your chart for best results.
Whether you're trading futures, forex, or crypto, this indicator provides clean session context without the mess. Open-source for extra customization and designed for real-time usability.

Major Session Highs/LowsThis indicator creates horizontal lines at major session high/lows (US, London, and Asian). The script updates the lines automatically, on session close.
For instance, when viewing during the US session, after the London overlap, horizontal lines will be displayed at the following levels.
The high/low of the most recent London session.
The high/low of the most recent Asian session.
The high/low of the last full US session, i.e. the session of the day prior.
When the current US session closes, the US levels automatically update.

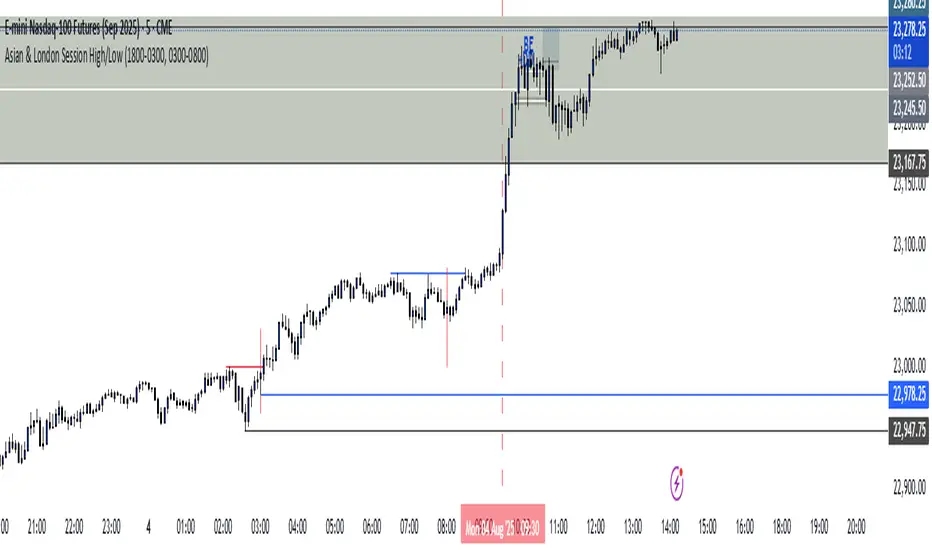
Asia & London Session High/Low – EOD Segments (v4.5)What it does
Plots the Asia and London session high & low each day.
When a session ends, its high/low are locked (non-repainting) and drawn as horizontal segments that auto-extend to the end of that same day (no infinite rays).
Optional labels show the exact level at session close.
Toggle whether to keep prior days on the chart or auto-clear them on the first bar of a new day.
Why traders use it
Quickly see overnight liquidity levels that often act as magnets or barriers during the U.S. session.
Map session range extremes for breakout/reversal planning, partials, and invalidation.
Works great alongside VWAP, 8/20/200 MAs, or your NY session tools to build confluence.
How it works
You define the session windows (defaults: Asia 00:00–06:00, London 07:00–11:00).
While a session is active, the script tracks running high/low.
On the bar after the session ends, the level is finalized and drawn; the segment’s right edge updates each bar until EOD, then stops automatically.
Inputs
Session Timezone: “Exchange”, UTC, or a specific region (set this to match your venue).
Asia / London Session: editable HHMM-HHMM windows.
Show Asia / Show London: enable either/both sessions.
Keep history: keep or auto-delete previous days.
Show labels: price labels at session close.
Colors & width: customize high/low colors and line width.
Best practices
Use on intraday timeframes (1–60m).
For equities/futures, set timezone to your exchange (e.g., America/New_York). For FX/crypto, pick what matches your workflow.
Common tweak: London 08:00–12:00 local; Asia 00:00–05:00 or your broker’s definition.
Notes
Non-repainting: levels only print once the session is complete.
Designed to be light and reliable—no boxes, just clean lines and labels.
If you want NY session levels, midlines (50%), anchored stop-time, or alerts on touches, this script can be extended.
For educational use only. Not financial advice.

Forex Session High/Low TrackerThis indicator maps out each Forex session along with their relative highs and lows.

Trading session High/Low (Lumiere)Trading session High/Low
What it does:
Plots the High and Low for each session (Asia, London, New York) as horizontal zones that “snap” to the first true extreme of the session and then extend right.
Key points:
Snap‑to‑extreme only: Lines don’t draw at the open; they appear only once price makes a new session high or low, and anchor exactly at that bar.
Persistent until next session: Once drawn, each session’s lines stay on the chart after the session ends, and are cleared only when that same session next opens (or when you hide it).
Three configurable sessions:
Asia: 18:00–03:00 (UTC‑4)
London: 03:00–09:30 (UTC‑4)
New York: 09:30–16:00 (UTC‑4)
Customizable appearance:
You can toggle each session on/off, choose its color, and set line width.
The time that is already set on the different sessions is based on the standard session open/close. If you want to change it, it will refer to the NY time, UTC -4.
ka66: FX Sessions High/LowThis indicator is specific to the 24-hour Forex Market. It provides 2 features:
Demarcating forex sessions with open and close lines. Note that looking at various sources online, we use the convention that the Asia session starts with the Tokyo market open, rather than the earlier Sydney session. Presumably this is better since we then have more liquidity in the market. Note that we have three sessions: Asia, London, New York.
At the end of each session, we begin plotting that (closed) session's high and low, which acts as a natural support and resistance for the Forex market. This is the key feature it provides. The first feature is mainly there for a visual guide, which can be turned off via the UI settings, but it certainly helps verifying the logic!
For more background, we are taking the idea of Previous Day High/Low (PDH/PDL), but adjusting it to a multi-session market like Forex. In essence, this is is a "Previous Session High/Low" indicator.
PDH/PDL works fine when you have a market with Regular Trading Hours, ignoring Extended Hours. However, in the Forex market, each session can have differing sentiments, e.g. we often see say London bringing prices up, and New York bringing them back down.
The break of session high/lows (or bouncing off them) can reflect where the potential direction price is going to take.
I also categorised this as a Sentiment indicator, because support and resistance areas where prices react do provide the sentiment of the market. They aren't just lines, they are prices of interest to major players.

Pre-Market + Previous Session High/LowThis script plots the key intraday levels most daytraders watch:
Today’s Pre-Market High & Low
Previous Regular Session High & Low

Tokyo Session High/Low (live → lock & extend @02:59 UTC-5)Tokyo Session High/Low (live → lock & extend @02:59 UTC-5)Tokyo Session High/Low (live → lock & extend @02:59 UTC-5)

Asian & London Session Highs/LowsThis will help you spot session highs/lows to help you get draws on liq

xmtr's session highs/lowsMarks Asia & London session highs/lows with precision + PDH/PDL for daily context. Fully customizable & perfect for all traders.

Asian & London Session High/Low (NEW)Marks out asian session high and low, london session high and low, so you dont have to, these levels are crucial to your trading, so use this indicator
Asian & London Session High/LowMarks out asian session high and low, aswell as london session high and low, this makes it easier for you to have crucial key levels on your chart at all times

Session Highs and LowsThis indicator highlights the New York, London, and Asian trading sessions — plotting each session’s highs and lows directly on your chart to help visualize intraday ranges and liquidity levels.
⸻
✨ Features
• Session Range Visualization
Automatically marks the high and low of each trading session with colored lines.
This makes it easy to identify where price expanded, consolidated, or built liquidity during each market phase.
• Session Background Zones (Optional)
Toggle background fills to highlight active sessions for clearer visual separation of NY, London, and Asian trading hours.
• Customizable Settings
• Enable or disable each session independently
• Adjust session times and colors
• Choose whether to fill session backgrounds
• Timezone Aware
All sessions are aligned to New York time by default, ensuring consistent mapping across instruments.
⸻
🎯 Use Case
A perfect tool for traders who track session-based liquidity, breaks of structure, or session-to-session continuity.
Quickly spot the Asian range, London expansion, and New York reversal windows — key components in intraday strategy development.
⸻
⚙️ Inputs
• Toggle sessions: NY / London / Asian
• Background fill on/off
• Label color customization
• Adjustable session times
⸻
📈 Why Use It
Understanding where each session establishes its range high and low provides critical context for liquidity grabs, session overlaps, and structural shifts throughout the day.
This simple yet powerful visual map enhances precision for ICT-style, smart money, or price action-based trading models.

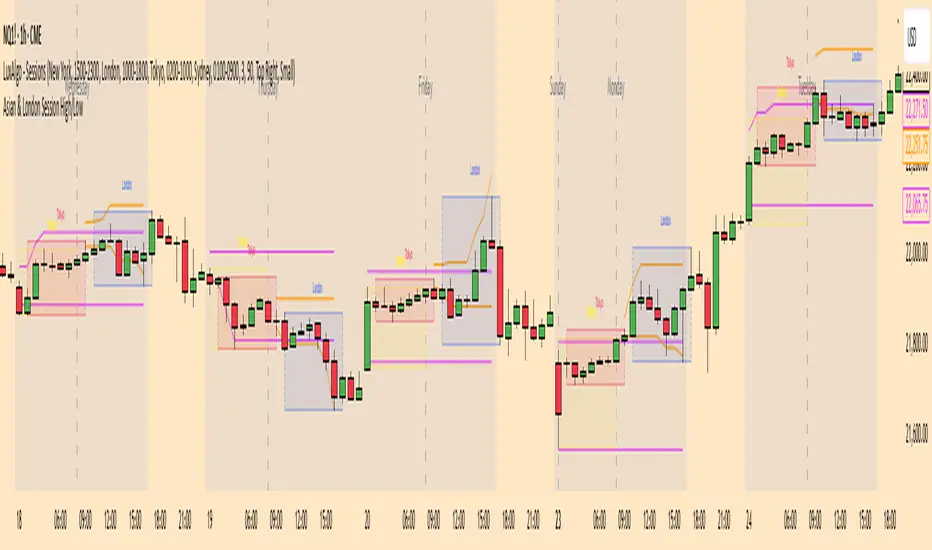
Session Highlighter (Asia / London / New York)This TradingView Pine Script highlights the three major Forex sessions—Asia, London, and New York—directly on the chart. Each session has customizable start/end times (based on New York time), toggle switches to show or hide them, and adjustable background colors. The script automatically detects sessions that cross midnight and shades the chart accordingly. It can also place optional labels at the exact opening of each session.

Session High and Low IndicatorThis script is meant for stocks that have a pre-market session. It is meant to be used on the 1 min time frame. This script will draw a green line at the high of pre-market, and a red line at the low of pre-market and extend these lines across the regular session day
This makes it easy to see if price action during regular market has broken above pre-market high or broken below pre-market low.
The high/low skips any quick spikes in price action (similar to what happens at 8:30 am every day).
