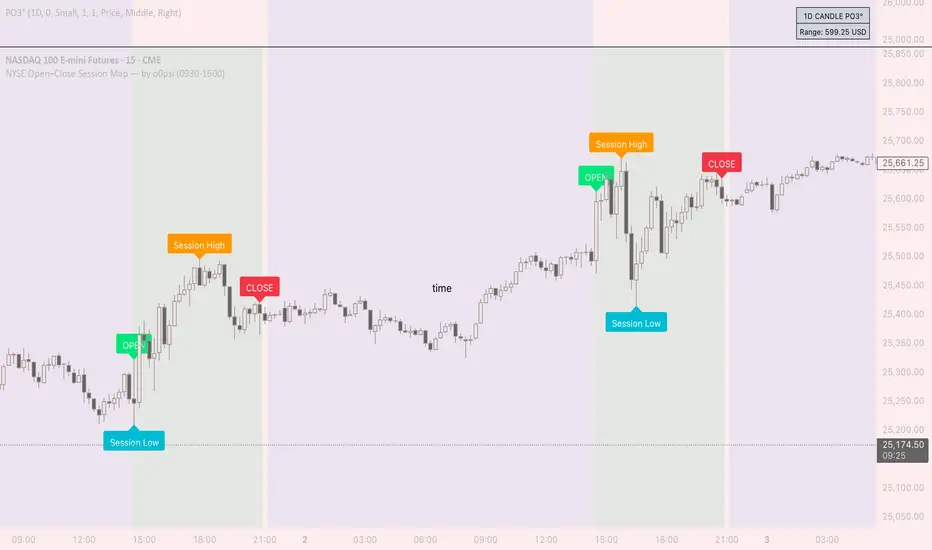
NYSE Open Close Session Map by o0psiNYSE Open Close Session Map by o0psi
This indicator highlights the regular US cash session window (default 09:30–16:00 New York time) and makes the key session bars obvious on the chart.
What it shows
A marker on the session OPEN bar
A marker on the session CLOSE bar (last in-session candle)
Optional background highlight for the full session window
Optional labels for the session high and session low bars (based on intraday price during the session)
How it works
The script detects bars inside the selected session window (New York timezone). It anchors OPEN on the first in-session bar, updates the session high/low while the session is active, then anchors CLOSE on the final in-session bar and labels the high/low bars where they occurred.
Notes
Session range precision depends on chart timeframe (lower timeframes capture extremes more precisely).
This is a charting/visualization tool and does not provide trading advice.
Cari dalam skrip untuk "session high"
J&A Sessions & NewsProject J&A: Session Ranges is a precision-engineered tool designed for professional traders who operate based on Time & Price. Unlike standard session indicators that clutter the chart with background colors, this tool focuses on Dynamic Price Ranges to help you visualize the Highs, Lows, and liquidity pools of each session.
It is pre-configured for Frankfurt Time (Europe/Berlin) but is fully customizable for any global location.
Key Features
1. Dynamic Session Ranges (The Boxes) Instead of vertical stripes, this indicator draws Boxes that encapsulate the entire price action of a session.
Real-Time Tracking: The box automatically expands to capture the Highest High and Lowest Low of the current session.
Visual Clarity: Instantly see the trading range of Asia, London, and New York to identify breakouts or range-bound conditions.
2. The "Lunch Break" Logic (Unique Feature) Institutional volume often dies down during lunch hours. This indicator allows you to Split the Session to account for these breaks.
Enabled: The script draws two separate boxes (Morning Session vs. Afternoon Session), allowing you to see fresh ranges after the lunch accumulation.
Disabled: The script draws one continuous box for the full session.
3. Manual High-Impact News Scheduler Never get caught on the wrong side of a spike. Since TradingView scripts cannot access live calendars, this tool includes a Manual Scheduler for risk management.
Input: Simply input the time of high-impact events (e.g., CPI, NFP) from ForexFactory into the settings.
Visual: A dashed line appears on the chart at the exact news time.
Audio Alert: The system triggers an alarm 10 minutes before the event, giving you time to manage positions or exit trades.
Default Configuration (Frankfurt Time)
Asian Session: 01:00 - 10:00 (Lunch disabled)
London Session: 09:00 - 17:30 (Lunch: 12:00-13:00)
New York Session: 14:00 - 22:00 (Lunch: 18:00-19:00)
How to Use
Setup: Apply the indicator. The default timezone is Europe/Berlin. If you live elsewhere, simply change the "Your Timezone" setting to your local time (e.g., America/New_York), and the boxes will align automatically.
Daily Routine: Check the economic calendar in the morning. If there is a "Red Folder" event at 14:30, open the indicator settings and enter 14:30 into the News Scheduler.
Trade: Use the Session Highs and Lows as liquidity targets or breakout levels.
Settings & Customization
Timezone: Full support for major global trading hubs.
Colors: Customize the Box fill and Border colors for every session.
Labels: Rename sessions (e.g., "Tokyo" instead of "Asia") via the settings menu.

ALN Sessions Box Breakout — Auto- DSTDevoleper: Sheikh Rakib
What it does
This indicator draws session range boxes for Asia (Dhaka), London, and New York using each market’s own local time (DST-aware). After a session closes, it watches for the first close above the session high or below the session low and then marks that breakout once per session with clear chart markers and optional alerts.
Key features
Auto-DST, per-city timezones
London session uses Europe/London
New York session uses America/New_York
Asia session uses Asia/Dhaka
Your chart timezone doesn’t matter—the sessions track real local hours.
Clean range boxes with adjustable opacity and optional outlines.
Session labels that auto-center at the end of each session.
One-shot breakout signals per session:
Triangle up when price closes above the session high.
Triangle down when price closes below the session low.
Built-in alerts for: session starts and each breakout direction.
Inputs
London / New York / Asia (Dhaka)
Show Session: toggle each session on/off
Time Range: default London 08:00–17:00 (local), New York 08:00–17:00 (local), Asia 06:00–15:00 (Dhaka)
Colour: box color for each session
Settings
Show Session Labels
Show Range Outline
Opacity Preset: Dark / Medium / Light
(UTC Offset input is kept for display, not used in session detection.)
Visuals & alerts
Boxes extend from session open to close, continually updating the high/low.
When the session ends, the final high/low are locked in, the label is centered, and the indicator begins monitoring for a breakout.
Alerts
Session start: Asia/London/New York
Breakouts: “High Breakout” (close > high) and “Low Breakout” (close < low) for each session
Create alerts from the TradingView alert dialog and choose the desired alertcondition.
Logic notes (how signals fire)
While a session is open, its box grows to contain all highs/lows.
On the first bar after close, the script starts listening for a breakout:
Close > session high → one up signal (fires once)
Close < session low → one down signal (fires once)
When the next same session begins, internal flags reset and a new box starts—so signals are inherently scoped to the period between that session’s close and its next open.
Tips
Use on intraday timeframes (e.g., 1m–30m) for clearer box structure.
If you only want specific markets, toggle others off for a cleaner chart.
For systematic entries, combine with your trend/volatility filters and use the breakout alerts as triggers or confirmations—this script doesn’t place trades.
Disclaimer: Market timing and risk management are your responsibility. Past session behavior does not guarantee future performance.

Market SessionsMarket Sessions (Asian, London, NY, Pacific)
Summary
This indicator plots the main global market sessions (Asian, European, American, Pacific) as boxes on your chart, complete with dynamic high/low tracking.
It's an essential tool for intraday traders to track session-based volatility patterns and visualize key support/resistance levels (like the Asian Range) that often define price action for the rest of the day.
Who it’s for
Intraday traders, scalpers, and day traders who need to visualize market hours and session-based ranges. If your strategy depends on the London open, the New York close, or the Asian range, this script will map it out for you.
What it shows
Customizable Session Boxes: Four fully configurable boxes for the Asian, European (London), American (New York), and Pacific (Sydney) sessions.
Session High & Low: The script tracks and boxes the highest high and lowest low of each session, dynamically updating as the session progresses.
Session Labels: Clear labels (e.g., "AS", "EU") mark each session, anchored to the start time.
Key Features
Powerful Timezone Control: This is the core feature.
Use Exchange Timezone (Default): Simply enter session times (e.g., 8:00 for London) relative to the exchange's timezone (e.g., "NASDAQ" or "BINANCE").
Use UTC Offset: Uncheck the box and enter a UTC offset (e.g., +3 or -5). Now, all session times you enter are relative to that specific UTC offset. This gives you full control regardless of the chart you're on.
Fully Customizable: Toggle any session on/off.
Style Control: Change the fill color, border color, transparency, border width, and line style (Solid, Dashed, Dotted) for each session individually.
Smart Labels: Labels stay anchored to the start of the session (no "sliding") and float just above the session high.
Why this helps
Track Volatility & Market Behavior: Visually identify the "personality" of each session. Some sessions might consistently produce powerful pumps or dumps, while others are prone to sideways "chop" or accumulation. This indicator helps you see these repeating patterns.
Find Key Support/Resistance Levels: The High and Low of a session (e.g., the Asian Range) often become critical support and resistance levels for the next session (e.g., London). This script makes it easy to spot these "session-to-session" S/R flips and reactions.
Aid Statistical Analysis: The script provides the core visual data for your statistical research. You can easily track how often the London session breaks the Asian high, or which session is most likely to reverse the trend, helping you build a robust trading plan.
Context is King: Instantly see which market is active, which are overlapping (like the high-volume London-NY overlap), and which have closed.
Quick setup
Go to Timezone Settings.
Decide how you want to enter times:
Easy (Default): Leave Use Exchange Timezone checked. Enter session times based on the chart's native exchange (e.g., for BTC/USDT on Binance, use UTC+0 times).
Manual (Pro): Uncheck Use Exchange Timezone. Enter your UTC Offset (e.g., +2 for Berlin). Now, enter all session times as they appear on the clock in Berlin.
Go to each session tab (Asian, European...) to enable/disable it and set the correct start/end hours and minutes.
Style the colors to match your chart theme.
Disclaimer
For educational/informational purposes only; not financial advice. Trading involves risk—manage it responsibly.

Futures Key LevelsKey Levels — Sessions, Previous Ranges & Opens (Chicago-aligned sessions)
What it does
This indicator plots commonly used reference levels across multiple timeframes to help you frame the day and find confluence:
Sessions (Chicago TZ): London, New York, and Asia session high/low ranges.
Previous Period Ranges: Previous Day / Week / Month / Quarter / Year High/Low and optional Mid.
Opens: Current Daily / Weekly / Monthly / Quarterly / Yearly opens.
Intraday (4H): Previous 4-Hour High/Low + optional Mid.
Monday Range: Captures Monday’s High/Low (and optional Mid) to use as a weekly reference.
Price-scale markers: Optional markers that track key levels on the price scale without adding extra lines.
How it works (concepts & calculations)
Higher-timeframe values are retrieved using request.security() and update when a new period begins (e.g., previous day’s H/L become fixed at the start of the new day).
Session ranges are built from bar data within session windows using time(session, "America/Chicago"):
London: 02:00–05:00 CT
New York: 08:30–15:00 CT
Asia: 20:00–00:00 CT
“Mid” levels are simple midpoints between each period’s High and Low.
Merge Levels: when different levels land at the same price, their labels are merged to reduce clutter (e.g., “PDH / PWH”).
Why this version is useful / original bits
All-white baseline for clean charts; session colors stand out by design: London = Yellow, New York = Aquatic Blue, Asia = Red.
Right-anchored mode lets you park levels to the right side of the chart with a configurable anchor distance.
Label merging keeps the display minimal when multiple levels coincide.
Price-scale-only markers available when you prefer fewer lines on the chart.
Inputs & customization
Display Style: Standard or Right Anchored (+ distance controls).
Levels toggles: enable/disable each period (Daily/Weekly/Monthly/Quarterly/Yearly), Monday range, 4H range, and session ranges.
Text: optional shorthand labels (e.g., PDH/PDL, PWH/PWL).
Colors: global white theme, with session highlights; you can override in the Inputs.
Price-scale markers: on/off toggle.
How to use it
Use previous High/Low as liquidity pools and areas to watch for sweeps, breaks, or retests.
The Monday range often frames the rest of the week; breaks or rejections around Monday H/L can be informative.
The 4H previous range gives intraday context—great for mean-reversion vs. continuation reads.
Session ranges help you see where the active session expanded price and where liquidity may remain.
Notes & limitations
Sessions are computed in America/Chicago; higher-TF levels use the symbol’s exchange timezone.
This is an indicator, not a strategy; it does not place trades or claim performance.
Always combine levels with your own execution rules (structure, momentum, risk).
Credit: inspired by spacemanBTC; this version adds the all-white styling, Chicago-aligned sessions, right-anchoring, label merging, and price-scale markers.
Also my mentor to tell me about the levels
Disclaimer
This tool is for educational purposes only and is not financial advice. Markets involve risk; do your own research and manage risk appropriately.

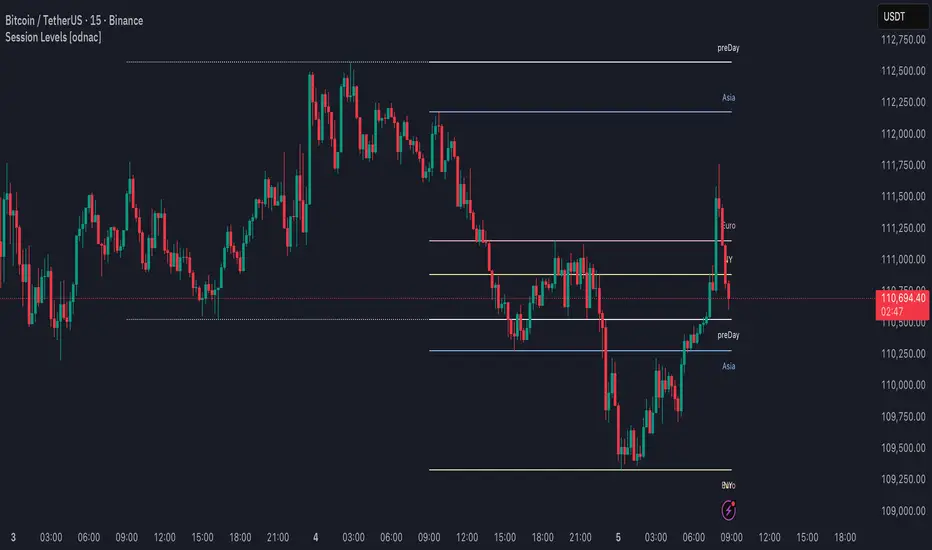
Session Levels [odnac]This indicator plots the high and low levels of the three main trading sessions—Asia, Europe, and New York—along with the previous day’s high, low, and open. Each session’s time range can be customized using a UTC offset, and the indicator automatically tracks session highs and lows as price develops.
Functions:
Plots session highs and lows for Asia, Europe, and New York.
Shows previous day’s high, low, and open as reference levels.
Session times are fully configurable with hour and minute precision, including UTC offset adjustment.
Each session level is marked with both a line and a label for clarity.
Color customization for each session and previous day levels.
Designed for intraday timeframes (1–60 minutes).
Filter Condition:
When the filter option is enabled, the indicator adjusts how levels are drawn:
A session high above the current close is displayed as a solid line with a visible label.
Once price closes above that high, the line becomes dotted and dimmed, and the label also becomes less emphasized.
Similarly, a session low below the current close is displayed as a solid line and label.
If price closes below that low, the line switches to dotted and dimmed, with the label adjusted accordingly.
This behavior highlights only the most relevant levels for the current market position while still keeping breached levels visible in a subdued style, making it easier to spot active breakout or liquidity zones.
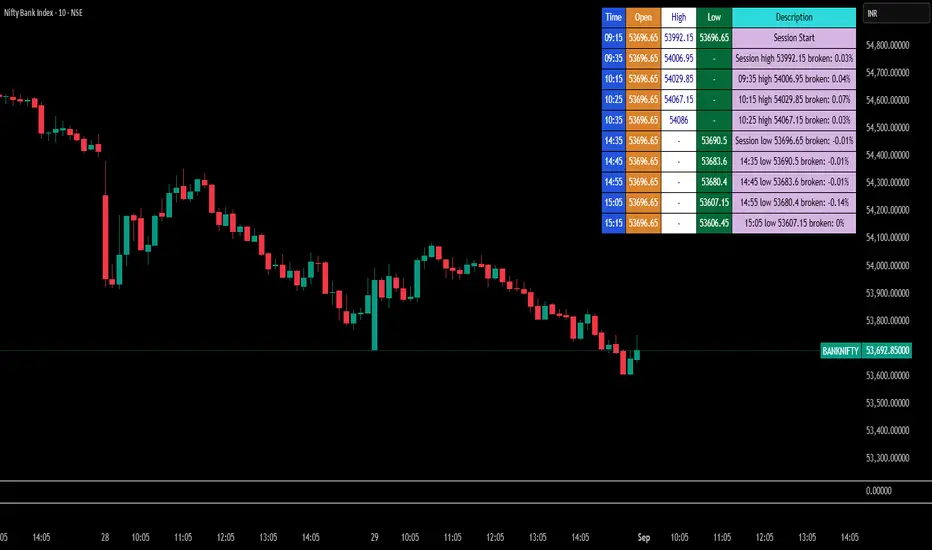
Break Point Record Table — GSK-VIZAG-AP-INDIA "Break Point Record Table — GSK-VIZAG-AP-INDIA" indicator captures key break points during each trading session and presents a clear, color-coded table overlay on the chart for quick visual reference. Specifically, it logs sessions' open price and monitors subsequent price action for notable breaks in the session high or low prices. Each break event is recorded with the time, price, and percentage change from the previous break, helping traders identify significant price movements within the session at a glance.
Key Features:
Records the session start time and opening price for context.
Tracks every intraday break above the previous session high or below the previous session low.
Calculates and displays the percentage change at each break event.
Highlights breaks with descriptive text including break time and values to aid trade decision-making.
Displays a table with columns for Time, Open, High, Low, and a Description of the event.
Uses color-coded cells to differentiate between session start, highs, lows, and break descriptions for better readability.
Maintains performance and readability by limiting the table to the latest 30 break events.
Usage & Benefits:
This indicator is ideal for intraday traders who want reliable visual cues to monitor momentum shifts and breakout/breakdown points during the trading day. By capturing these break points as discrete events and organizing the data into an easily accessible, visually intuitive table, it improves situational awareness and supports timely trading decisions.
Bardhi's ICT Killzone & PivotsThis indicator is a complete ICT-style session and liquidity toolkit designed for precision trading. It automatically marks the most important trading windows (“Killzones”) and provides powerful tools for tracking price action around them.
Key Features:
Killzones: Automatically plots Asia, London, and New York (AM, Lunch, PM) sessions with customizable colors, transparency, and labels.
Session Highs, Lows & Midpoints: Dynamic lines for killzone highs/lows, optional midpoints, and alerts when levels are broken.
Range Statistics: Displays the real-time range of each session plus rolling averages in a customizable table.
Day / Week / Month Levels: Plots opens, highs, lows, and separators for higher-timeframe reference points with optional alerts.
Custom Opening Prices: Define up to 8 custom open lines (e.g., True Day Open, 06:00, 10:00) with cutoff times.
Vertical Timestamp Lines: Highlight important intraday times such as news events or personal strategy triggers.
Day-of-Week Labels: Clean labels for each day, with the option to hide weekends.
Full Customization: Adjustable label sizes, colors, line styles, transparency, and drawing limits.
Why Use It?
This tool combines killzone sessions, pivots, higher-timeframe opens/highs/lows, and range statistics into one clean, automated package. It saves time drawing manually, keeps charts organized, and helps traders apply ICT concepts consistently.

Malama's KAYCAP Pre-Market Box# Pre-Market Single Candle Range Box
## What Makes This Script Original
While many scripts plot entire pre-market session ranges, this indicator focuses specifically on **a single user-defined candle** within the pre-market period rather than the entire session. This targeted approach allows traders to isolate the most relevant price action from a specific time (default: 4:00 AM EST) that often establishes key levels for the trading day.
## Core Methodology & Technical Implementation
**Single Candle Isolation:**
- Captures OHLC data from one specific minute within pre-market hours (user configurable)
- Differentiates between the candle's body (open/close range) and wicks (high/low extremes)
- Creates four distinct reference levels instead of traditional session high/low boxes
**Dual Box Structure:**
- **Inner Box (Body):** Plots the range between open and close prices of the target candle
- **Outer Boundaries:** Separately plots the high and low of that same candle
- **Visual Differentiation:** Uses different colors and line weights to distinguish body vs. wick levels
**Time-Specific Logic:**
The script uses precise time matching (`hour == boxHour and minute == boxMinute`) to capture data from exactly one candle, rather than aggregating an entire session. This creates four specific price levels:
- Box Top: Higher of open/close (body boundary)
- Box Bottom: Lower of open/close (body boundary)
- Box High: Candle high (wick extreme)
- Box Low: Candle low (wick extreme)
## Why This Approach Differs from Standard Session Boxes
**vs. Full Session Ranges:** Focuses on a single critical minute rather than entire pre-market period
**vs. Traditional S/R:** Creates both body and wick levels from one specific candle
**vs. Opening Range:** Uses pre-market data rather than regular session opening minutes
## Practical Application
The 4:00 AM EST default targets a time when institutional pre-market activity often establishes initial sentiment and key levels. By isolating this specific candle's range:
- **Body levels** often act as initial support/resistance during regular hours
- **Wick extremes** provide broader range boundaries for breakout analysis
- **Precise timing** allows focus on the most statistically relevant pre-market moment
## Technical Considerations
- Requires intraday timeframes (1-minute recommended) to capture specific candle data
- Time settings should match your broker's timezone for accurate candle selection
- Works best on liquid instruments where pre-market activity is meaningful
- The selected candle must exist in your data feed for the levels to plot
## Customization Options
All timing parameters are adjustable:
- Target candle hour and minute
- Pre-market session definition (for context)
- Visual styling for all four level types
This focused approach provides more granular analysis than broad session ranges while maintaining simplicity in execution.

Blue Ocean BOATS 24/5 US Market DataThis script utilizes Blue Ocean's ATS (Alternative Trading System) and U.S. exchange market data to create a continuous candlestick chart. The continuous data has the option to be used as an indicator or strategy source.
Requirements
The main chart symbol (which can be unrelated to the user-input Ticker Symbol) needs to be a 24/7 chart. An example symbol is CRYPTO:BTCUSD. CME_MINI:ES1! and FX:SPX500 work too, but are not truly 24/5 and will miss ~4 hours of the total trading week from the extended U.S. session.
The main chart's timeframe needs to be intraday. Because the script's output is currently inconsistent on daily or higher timeframes, it will disable itself.
The Ticker Symbol chosen should be a ticker that is traded on U.S. exchanges. This will provide both U.S. extended session data and a BOATS equivalent.
Usage & configuration
This script visualizes the 24-hour Monday-Friday chart of a U.S. exchange ticker. Going a step further, it can be used to compare the performance indices or cryptocurrencies to stock constituents of indices, cryptocurrency treasury stocks or holding ETFs.
The script's output, candlesticks, can be overlaid on the main chart or used as is. A "Price Source" plot is used for indicators or strategies.
Ticker Symbol: The U.S. ticker you'd like to view extended session and Blue Ocean ATS session data for.
Price Source: Price source that can be used for indicators or strategies.
Highlight Sessions: Highlight the different trading sessions.
Last Price Line: Show a horizontal line at the last traded price.
Ticker Symbol Check: Plots a label that will display only if the selected Ticker Symbol is not detected as a U.S. exchange traded ticker.
Earnings Label: Creates a label at the time of past earnings of the chosen Ticker Symbol. The time that the earnings are plotted is approximate. Because of this, the label is meant as an explanation for price action.
What this script does and how it works
It creates OHLC candlesticks by merging Blue Ocean's ATS market data and U.S. exchange data. From the OHLC data of both, a single output can be used for indicators or strategies.
References and further information
www.tradingview.com
The Blue Ocean ATS allows trading from 20:00 to 4:00 Eastern Time, Sunday through Thursday. This critical timeframe bridges the eight-hour overnight gap when major U.S. exchanges are closed.
blueocean-tech.io
Blue Ocean ATS, LLC is a US broker dealer which operates the alternative trading system BOATS. Our trading platform offers electronic access, price discovery, compliant regulatory reporting requirements, and standard clearing and settlement processes.
www.nyse.com
Hours mentioned are in Eastern Time.
Overnight trading remains far less active than extended hours trading. The hour with the highest overnight volume is 9:00PM, which averages 2.94 million shares per day and coincides with several Asian market opens. This volume is a fraction of the last hour of extended hours trading, which averages 43.22 million shares. The first hour of pre-core reported volume averages 113.30 million shares per day.
Overnight executions, in addition to the peak in the 9:00PM hour, also exhibits a smaller peak at 3:00AM, of 2.35 million shares. This coincides with several Asian bourses’ end of their regular trading day.
Example of using the script in the main chart window and the difference in how RSI may be calculated.
Note: ATS is not the name of the 20:00 to 4:00 ET session itself, and the term refers to a broader definition of trading systems that include dark pools, which can be different.
24/5 Monday-Friday really means NY time Sunday night to Friday afternoon.

MJBFX-Strategy (Futures Optimized)The MJBFX-Strategy is a complete market mapping tool designed to give traders a clear view of liquidity, session dynamics, and premium/discount levels. It loads automatically on any chart, fully optimized for futures and forex trading.
🔑 Key Features
Asian Session Range
Highlights the previous Asian session with a shaded box
Fixed until London open for precise reference
VWAP from Asian Session
Plots the VWAP of the previous Asian session
Dynamic fair value benchmark for intraday trading
Liquidity Sweeps (Optimized)
Detects sweeps of the Asian session high/low
Shown only on 30m, 1h, and 4h charts to reduce noise
Clean, minimal labels for clarity
Automatic Fibonacci Zone
Draws a shaded retracement zone (38.2%–61.8%) of the Asian range
Transparent fill makes it easy to read price action
Killzones
Highlights London (07:00–10:00) and New York (13:00–16:00) killzones
Semi-opaque shading to keep charts clean
Auto Trade Box (Risk/Reward)
On sweep confirmation, plots a 2R target box
Auto stop loss and take profit levels based on futures tick size
🎯 Why Use It?
The MJBFX-Strategy removes the need for manual drawing.It automatically maps:
Session highs and lows
Liquidity sweeps
VWAP and fib retracement zones
Key killzones
Perfect for session-based intraday trading in both futures and forex.
⚡ No manual settings required.Just load it onto your chart for an instant institutional view of the market.

[FS] Time & Cycles Time & Cycles
A comprehensive trading session indicator that helps traders identify and track key market sessions and their price levels. This tool is particularly useful for forex and futures traders who need to monitor multiple trading sessions.
Key Features:
• Multiple Session Support:
- London Session
- New York Session
- Sydney Session
- Asia Session
- Customizable TBD Session
• Session Visualization:
- Clear session boxes with customizable colors
- Session labels with adjustable visibility
- Support for sessions crossing midnight
- Timezone-aware calculations
• Price Level Tracking:
- Daily High/Low levels
- Weekly High/Low levels
- Previous session High/Low levels
- Customizable history depth for each level type
• Customization Options:
- Adjustable colors for each session
- Customizable border styles
- Label visibility controls
- Timezone selection
- History level depth settings
• Technical Features:
- High-performance calculation engine
- Support for multiple timeframes
- Efficient memory usage
- Clean and intuitive visual display
Perfect for:
• Forex traders monitoring multiple sessions
• Futures traders tracking market hours
• Swing traders identifying key session levels
• Day traders planning their trading hours
• Market analysts studying session patterns
The indicator helps traders:
- Identify active trading sessions
- Track session-specific price levels
- Monitor market activity across different time zones
- Plan trades based on session boundaries
- Analyze price action within specific sessions
Note: This indicator is designed to work across all timeframes and is optimized for performance with minimal impact on chart loading times.

TradeJorno - Time + Price Levels
Tired of manually drawing and updating important ICT or SMC time and price levels on your charts every day?
Here’s an indicator to draw important TIME and PRICE levels automatically.
Here’s what you can highlight in realtime on your charts:
1. Previous major highs and lows
⁃ Previous daily and weekly highs and low
- Weekly dividing lines
2. Session highs/lows
⁃ Plot the high and low of Asia and London sessions.
⁃ Customise the timeframe and appearance on the chart.
- Previous session settlement price.
3. Various price levels
⁃ Pre-market opening prices : midnight, 7:30 and 8:30
⁃ Regular market opening prices: 9:30, 10:00, 14:00
- end of session settlement prices
4. Market opening range high and low
⁃ Lines extending throughout the current session
⁃ Customise the timeframe and appearance on the chart.
5. ICT Macro times
- Draw customisable vertical lines and labels to indicate the start of each ICT macro
period.
Let us know in the comments below if there’s anything else we need to add!

Previous Two Days HL + Asia H/L + 4H Vertical Lines📊 Indicator Overview
This custom TradingView indicator visually marks key market structure levels and session data on your chart using lines, labels, boxes, and vertical guides. It is designed for traders who analyze intraday and multi-session behavior — especially around the New York and Asia sessions — with a focus on 4-hour price ranges.
🔍 What the Indicator Tracks
1. Previous Two Days' Ranges (6PM–5PM NY Time)
PDH/PDL (Day 1 & Day 2): Draws horizontal lines marking the previous two trading days’ highs and lows.
Midlines: Calculates and displays the midpoint between each day’s high and low.
Color-Coded: Uses strong colors for Day 1 and more transparent versions for Day 2, to help differentiate them.
2. Asia Session High/Low (6 PM – 2 AM NY Time)
Automatically tracks the high and low during the Asia session.
Extends these levels until the following day’s NY close (4 PM).
Shows a midline of the Asia session (optional dotted line).
Highlights the Asia session background in gray.
Labels Asia High and Low on the chart for easy reference.
3. Last Closed 4-Hour Candle Range
At the start of every new 4H candle, it:
Draws a box from the last closed 4H candle.
Box spans horizontally across a set number of bars (adjustable).
Top and bottom lines indicate the high and low of that 4H candle.
Midline, 25% (Q1) and 75% (Q3) levels are also drawn inside the box using dotted lines.
Helps traders identify premium/discount zones within the previous 4H range.
4. Vertical 4H Time Markers
Draws vertical dashed lines to mark the start and end of the last 4H candle range.
Based on the standard 4H bar timing in NY (e.g. 5:00, 9:00, 13:00, 17:00).
⚙️ Inputs & Options
Line thickness, color customization for all levels.
Option to place labels on the right or left side of the chart.
Toggle for enabling/disabling the 4H box.
Adjustable box extension length (how far to extend the range visually).
✅ Ideal Use Cases
Identifying reaction zones from prior highs/lows.
Spotting reversals during Asia or NY session opens.
Trading intraday setups based on 4H structure.
Anchoring scalping or swing entries off major session levels.

AMD Liquidity Sweep with AlertsAMD Liquidity Sweep with Alerts
Identify key liquidity levels from the Asian trading session with visual markers and alerts.
📌 Key Features:
Asia Session Detection
Customizable start/end hours (0-23) to match your trading timezone
Automatically calculates session high/low
Smart Swing Level Identification
Finds the closest significant swing high ≥ Asia high
Finds the closest significant swing low ≤ Asia low
Adjustable pivot sensitivity (# of left/right bars)
Professional Visuals
Dashed reference lines extending into the future
Blue-highlighted key levels
Clean label formatting with precise price levels
Trading Alerts
Price-cross alerts for liquidity breaks
Visual markers (triangles) when levels are breached
Separate alerts for buy-side/sell-side liquidity
Customization Options
Toggle intermediate swing highlights
Adjust label sizes
💡 Trading Applications:
Institutional Levels: Identify zones where Asian session liquidity pools exist
Breakout Trading: Get alerted when price breaches Asian session ranges
S/R Flip Zones: Watch how price reacts at these key reference levels
London/NY Open: Use Asian levels for early European session trades
🔧 How to Use:
Set your preferred Asia session hours
Adjust pivot sensitivity (default 1 bar works for most timeframes)
Enable alerts for breakouts if desired
Watch for reactions at the plotted levels

Apex Edge - MTF Confluence PanelApex Edge – MTF Confluence Panel
Description:
The Apex Edge – MTF Confluence Panel is a powerful multi-timeframe analysis tool built to streamline trade decision-making by aggregating key confluences across three user-defined timeframes. The panel visually presents the state of five core market signals—Trend, Momentum, Sweep, Structure, and Trap—alongside a unified Score column that summarizes directional bias with clarity.
Traders can customize the number of bullish/bearish conditions required to trigger a score signal, allowing the tool to be tailored for both conservative and aggressive trading styles. This script is designed for those who value a clean, structured, and objective approach to identifying market alignment—whether scalping or swing trading.
How it Works:
Across each of the three selected timeframes, the panel evaluates:
Trend: Based on a user-configurable Hull Moving Average (HMA), the script compares price relative to trend to determine bullish, bearish, or neutral bias.
Momentum: Uses OBV (On-Balance Volume) with volume spike detection to identify bursts of strong buying or selling pressure.
Sweep: Detects potential liquidity grabs by identifying price rejections beyond prior swing highs/lows. A break below a previous low with reversal signals bullish intent (and vice versa for bearish).
Structure: Uses dynamic pivot-based logic to identify market structure breaks (BOS) beyond recent confirmed swing levels.
Trap: Flags potential false moves by measuring RSI overbought/oversold signal clusters combined with minimal price movement—highlighting exhaustion or deceptive breaks.
Score: A weighted consensus of the above components. The number of required confluences to trigger a score (default: 3) can be set by the user via input, offering flexibility in signal sensitivity.
Why It’s Useful for Traders:
Quick Decision-Making: The color-coded panel provides instant visual feedback on whether confluences align across timeframes—ideal for fast-paced environments like scalping or high-volatility news sessions.
Multi-Timeframe Confidence: Helps eliminate guesswork by confirming whether higher and lower timeframe conditions support your trade idea.
Customizability: Adjustable confluence threshold means traders can fine-tune how sensitive the system is—more signals for faster entries, stricter confluence for higher conviction trades.
Built-In Alerts: Automated alerts for score alignment, trap detection, and liquidity sweeps allow traders to stay informed even when away from the screen.
Strategic Edge: Supports directional bias confirmation and trade filtering with logic designed to mimic professional decision-making workflows.
Features:
Clean, real-time confluence table across three user-selected timeframes
Configurable score sensitivity via “Minimum Confluences for Score” input
Cell-based colour coding for at-a-glance trade direction
Built-in alerts for score alignment, traps, and sweep triggers
Note - This Indicator works great in sync with Apex Edge - Session Sweep Pro
Useful levels for TP = previous session high/low boxes or fib levels.
⚠️ Disclaimer:
This script is for informational and educational purposes only and should not be considered financial advice. Always perform your own due diligence and practice proper risk management when trading.

Opening Range and Market BoundariesOpening Range and Market Boundaries
This versatile and insightful indicator combines two powerful concepts frequently used by professional traders: Opening Range Analysis and Market Boundaries derived from previous high/low levels. It is specifically designed to support intraday trading strategies and helps you identify key price zones for entries, exits, and breakout confirmations.
🔍 Features & Utility
1. Opening Range Box
What it does:
Highlights the high and low of the first candle after market open (9:15 AM IST) with a shaded box. This box spans the full trading session, from 9:15 AM to 3:30 PM, representing the key price range where the initial balance is formed.
Timeframe Compatibility:
The Opening Range box is optimized for 1-minute to 1-hour charts. It is most effective on lower timeframes (1m, 5m, 15m, 30m) where intraday price movements and breakout patterns can be clearly observed.
Usage Tips:
Breakouts above or below the Opening Range box can signal potential directional bias for the rest of the trading day.
Price consolidating within the range may indicate a choppy or range-bound session.
Works well with volume and momentum indicators for confirmation.
2. Market Boundaries
What it does:
Plots horizontal lines at:
Previous Day High/Low
Previous Week High/Low
Previous Month High/Low
Why it matters:
These levels act as natural support and resistance zones, and are commonly watched by institutional traders, making them crucial for:
Spotting reversals or breakouts
Planning stop-loss and target zones
Avoiding trades around high-rejection areas
Customization Options:
Toggle ON/OFF for Daily, Weekly, and Monthly levels.
Independent colors and line thickness for each level, enabling you to distinguish between different timeframes easily.
🛠️ How to Use Effectively
Use during market open:
Switch to a 5-minute or 15-minute chart during the first few candles of the session. Observe the Opening Range box formation and plan trades based on breakout direction.
Confluence Trading:
Look for price action near previous session highs/lows in confluence with the Opening Range box edges. These intersections often become high-probability zones for breakouts or reversals.
Session Preparation:
Before the market opens, analyze where the price is relative to past high/low boundaries. If it's near a weekly/monthly level, be cautious — those areas can cause whipsaws or false breakouts.
Avoid low-volume breakouts:
Use this indicator in conjunction with volume tools or price action confirmation to validate the strength of a move outside the Opening Range or Market Boundaries.
📌 Summary
This indicator is designed for intraday traders, scalpers, and swing traders who want a reliable structure to guide their decisions. It visually marks the opening balance of the market and essential higher timeframe boundaries, helping you trade with discipline and precision.

London/NY Sessions + SMC Levels📜 Indicator Description: London/NY Sessions + SMC Levels
Overview: This indicator highlights the key trading sessions — London, New York, NY Lunch, and Asian Range — providing structured visual guides based on Smart Money Concepts (SMC) and ICT principles.
It dynamically plots:
Session Backgrounds and Boxes for London, NY, Lunch, and Asian sessions
Reference Levels for the High, Low, and Close from today, previous day, or weekly data
Midnight Open line for ICT-style power of three setups
Real-time alerts for session starts, session closes, and important price level crossings
Features:
🕰️ Session Visualization:
Toggle London, NY, Lunch, and Asian session ranges individually, with customizable colors and transparent backgrounds.
🔔 Built-in Alerts:
Alerts for:
Price crossing the previous day's high/low
Price crossing the Midnight Open
Start and end of major sessions (London, NY, Lunch, Asian)
🟩 Reference Levels:
Plot selectable session reference levels:
Today’s intraday High/Low/Close
Previous Day’s High/Low/Close
This Week’s or Previous Week’s levels for broader context.
🌙 Midnight Open:
Track the Midnight New York Open as a reference point for daily bias shifts.
🎯 Customizable Settings:
Choose your session time zones (UTC, New York, London, etc.)
Customize all border colors, background colors, and session hours.
Use Cases:
Identify killzones and optimal trade entry windows for Smart Money Concepts (SMC) and ICT strategies.
Monitor liquidity pool sweeps and session transitions.
Confirm or refine your intraday or swing trading setups by referencing session highs/lows.
Recommended For:
ICT traders
Smart Money Concepts (SMC) practitioners
Forex, indices, crypto, and futures traders focusing on session-based volatility patterns
Anyone wanting a clean, professional session mapping tool
📈
Designed to help you trade with session precision and Smart Money accuracy.
Integrates seamlessly into any ICT, Wyckoff, or Liquidity-based trading approach.

ICT Bread and Butter Sell-SetupICT Bread and Butter Sell-Setup – TradingView Strategy
Overview:
The ICT Bread and Butter Sell-Setup is an intraday trading strategy designed to capitalize on bearish market conditions. It follows institutional order flow and exploits liquidity patterns within key trading sessions—London, New York, and Asia—to identify high-probability short entries.
Key Components of the Strategy:
🔹 London Open Setup (2:00 AM – 8:20 AM NY Time)
The London session typically sets the initial directional move of the day.
A short-term high often forms before a downward push, establishing the daily high.
🔹 New York Open Kill Zone (8:20 AM – 10:00 AM NY Time)
The New York Judas Swing (a temporary rally above London’s high) creates an opportunity for short entries.
Traders fade this move, anticipating a sell-off targeting liquidity below previous lows.
🔹 London Close Buy Setup (10:30 AM – 1:00 PM NY Time)
If price reaches a higher timeframe discount array, a retracement higher is expected.
A bullish order block or failure swing signals a possible reversal.
The risk is set just below the day’s low, targeting a 20-30% retracement of the daily range.
🔹 Asia Open Sell Setup (7:00 PM – 2:00 AM NY Time)
If institutional order flow remains bearish, a short entry is taken around the 0-GMT Open.
Expect a 15-20 pip decline as the Asian range forms.
Strategy Rules:
📉 Short Entry Conditions:
✅ New York Judas Swing occurs (price moves above London’s high before reversing).
✅ Short entry is triggered when price closes below the open.
✅ Stop-loss is set 10 pips above the session high.
✅ Take-profit targets liquidity zones on higher timeframes.
📈 Long Entry (London Close Reversal):
✅ Price reaches a higher timeframe discount array between 10:30 AM – 1:00 PM NY Time.
✅ A bullish order block confirms the reversal.
✅ Stop-loss is set 10 pips below the day’s low.
✅ Take-profit targets 20-30% of the daily range retracement.
📉 Asia Open Sell Entry:
✅ Price trades slightly above the 0-GMT Open.
✅ Short entry is taken at resistance, targeting a quick 15-20 pip move.
Why Use This Strategy?
🚀 Institutional Order Flow Tracking – Aligns with smart money concepts.
📊 Precise Session Timing – Uses market structure across London, New York, and Asia.
🎯 High-Probability Entries – Focuses on liquidity grabs and engineered stop hunts.
📉 Optimized Risk Management – Defined stop-loss and take-profit levels.
This strategy is ideal for traders looking to trade with institutions, fade liquidity grabs, and capture high-probability short setups during the trading day. 📉🔥

Price Alert Indicator with TableIndicator Description: Price Alert Indicator with Table
The Custom Price Alert Indicator with Table is a TradingView script designed to help traders monitor and react to significant price levels during the Asian and London trading sessions. This indicator provides visual alerts and displays relevant session data in a user-friendly table format.
Key Features:
User-Defined Session Times:
Users can specify the start and end hours for both the Asian (default: 8 AM to 2 PM) and London (default: 2 PM to 8 PM) trading sessions in their local time zone.
This flexibility allows traders from different regions to customize the indicator according to their trading hours.
Real-Time Highs and Lows:
The indicator calculates and tracks the high and low prices for the Asian and London sessions in real-time.
It continuously updates these values as new price data comes in.
Touch Notification Logic:
Alerts are triggered when the price touches the session high or low points.
Notifications are designed to avoid repetition; if the London session touches the Asian high or low, subsequent touches are not alerted until the next trading day.
Interactive Table Display:
A table is presented in the bottom right corner of the chart, showing:
The Asian low and high prices
The London low and high prices
Whether each price level has been touched.
Touched levels are visually highlighted in green, making it easy for traders to identify relevant price actions.
Daily Reset of Notifications:
The notification statuses are reset at the end of the London session each day, preparing for the next day’s trading activity.
Use Cases:
Traders can utilize this indicator to stay informed about pivotal price levels during important trading sessions, aiding in decision-making and strategy development.
The clear visual representation of price levels and touch statuses helps traders quickly assess market conditions.
This indicator is particularly beneficial for day traders and those who focus on price movements around key high and low points during the trading day.

Gap Down Reversal Strategy█ STRATEGY OVERVIEW
The "Gap Down Reversal Strategy" capitalizes on price recovery patterns following bearish gap-down openings. This mean-reversion approach enters long positions on confirmed intraday recoveries and exits when prices breach previous session highs. This strategy is NOT optimized.
█ What is a Gap Down Reversal?
A gap down reversal occurs when:
An instrument opens significantly below its prior session's low (price gap)
Selling pressure exhausts itself during the session
Buyers regain control, pushing price back above the opening level
Creates a candlestick with:
• Open < Prior Session Low (true gap)
• Close > Open (bullish reversal candle)
█ SIGNAL GENERATION
1. LONG ENTRY CONDITION
Previous candle closes BELOW its opening price (bearish candle)
Current session opens BELOW prior candle's low (gap down)
Current candle closes ABOVE its opening price (bullish reversal)
Executes market order at session close
2. EXIT CONDITION
A Sell Signal is generated when the current closing price exceeds the highest high of the previous seven bars (`close > _highest `). This indicates that the price has shown strength, potentially confirming the reversal and prompting the strategy to exit the position.
█ PERFORMANCE OVERVIEW
Ideal Market: High volatility instruments with frequent gaps
Key Risk: False reversals in sustained downtrends
Optimization Tip: Test varying gap thresholds (1-3% ranges)

London/NY Sessions [jpkxyz]London/NY Sessions Indicator Guide
This indicator tracks the forex market's most active trading periods: London session, New York session, and their overlap.
This characteristics of the London and New York trading sessions are well documented and many traders use them as a key element in their trading strategies. It is most relevant in forex trading, however it is to an extend also applicable in cryptocurrencies.
London Session (08:00-16:00 UTC)
Most active trading session (35% of daily forex volume)
Highest trading volume and liquidity
Major price movements and trend development
Significant institutional participation
New York Session (13:00-20:00 UTC)
Second most active trading period
High institutional order flow
Major US economic releases
Significant impact on USD pairs
London/New York Overlap (13:00-16:00 UTC)
The most active period in forex markets:
Maximum market liquidity
Highest daily trading volume
Strong price movements
Tightest spreads
Peak institutional activity
This indicator helps traders:
Visualize key trading sessions
Track session highs and lows
Monitor overlap dynamics
Identify potential support/resistance levels (session highs/lows)

time_and_sessionA library that provides utilities for working with trading sessions and time-based conditions. Functions include session checks, date range checks, day-of-week matching, and session high/low calculations for daily, weekly, monthly, and yearly timeframes. This library streamlines time-related calculations and enhances time-based strategies and indicators.
Library "time_and_session"
Provides functions for checking time and session-based conditions and retrieving session-specific high and low values.
is_session(session, timeframe, timezone)
Checks if the current time is within the specified trading session
Parameters:
session (string) : The trading session, defined using input.session()
timeframe (string) : The timeframe to use, defaults to the current chart's timeframe
timezone (string) : The timezone to use, defaults to the symbol's timezone
Returns: A boolean indicating whether the current time is within the specified trading session
is_date_range(start_time, end_time)
Checks if the current time is within a specified date range
Parameters:
start_time (int) : The start time, defined using input.time()
end_time (int) : The end time, defined using input.time()
Returns: A boolean indicating whether the current time is within the specified date range
is_day_of_week(sunday, monday, tuesday, wednesday, thursday, friday, saturday)
Checks if the current day of the week matches any of the specified days
Parameters:
sunday (bool) : A boolean indicating whether to check for Sunday
monday (bool) : A boolean indicating whether to check for Monday
tuesday (bool) : A boolean indicating whether to check for Tuesday
wednesday (bool) : A boolean indicating whether to check for Wednesday
thursday (bool) : A boolean indicating whether to check for Thursday
friday (bool) : A boolean indicating whether to check for Friday
saturday (bool) : A boolean indicating whether to check for Saturday
Returns: A boolean indicating whether the current day of the week matches any of the specified days
daily_high(source)
Returns the highest value of the specified source during the current daily session
Parameters:
source (float) : The data series to evaluate, defaults to high
Returns: The highest value during the current daily session, or na if the timeframe is not suitable
daily_low(source)
Returns the lowest value of the specified source during the current daily session
Parameters:
source (float) : The data series to evaluate, defaults to low
Returns: The lowest value during the current daily session, or na if the timeframe is not suitable
regular_session_high(source, persist)
Returns the highest value of the specified source during the current regular trading session
Parameters:
source (float) : The data series to evaluate, defaults to high
persist (bool) : A boolean indicating whether to retain the last value outside of regular market hours, defaults to true
Returns: The highest value during the current regular trading session, or na if the timeframe is not suitable
regular_session_low(source, persist)
Returns the lowest value of the specified source during the current regular trading session
Parameters:
source (float) : The data series to evaluate, defaults to low
persist (bool) : A boolean indicating whether to retain the last value outside of regular market hours, defaults to true
Returns: The lowest value during the current regular trading session, or na if the timeframe is not suitable
premarket_session_high(source, persist)
Returns the highest value of the specified source during the current premarket trading session
Parameters:
source (float) : The data series to evaluate, defaults to high
persist (bool) : A boolean indicating whether to retain the last value outside of premarket hours, defaults to true
Returns: The highest value during the current premarket trading session, or na if the timeframe is not suitable
premarket_session_low(source, persist)
Returns the lowest value of the specified source during the current premarket trading session
Parameters:
source (float) : The data series to evaluate, defaults to low
persist (bool) : A boolean indicating whether to retain the last value outside of premarket hours, defaults to true
Returns: The lowest value during the current premarket trading session, or na if the timeframe is not suitable
postmarket_session_high(source, persist)
Returns the highest value of the specified source during the current postmarket trading session
Parameters:
source (float) : The data series to evaluate, defaults to high
persist (bool) : A boolean indicating whether to retain the last value outside of postmarket hours, defaults to true
Returns: The highest value during the current postmarket trading session, or na if the timeframe is not suitable
postmarket_session_low(source, persist)
Returns the lowest value of the specified source during the current postmarket trading session
Parameters:
source (float) : The data series to evaluate, defaults to low
persist (bool) : A boolean indicating whether to retain the last value outside of postmarket hours, defaults to true
Returns: The lowest value during the current postmarket trading session, or na if the timeframe is not suitable
weekly_high(source)
Returns the highest value of the specified source during the current weekly session. Can fail on lower timeframes.
Parameters:
source (float) : The data series to evaluate, defaults to high
Returns: The highest value during the current weekly session, or na if the timeframe is not suitable
weekly_low(source)
Returns the lowest value of the specified source during the current weekly session. Can fail on lower timeframes.
Parameters:
source (float) : The data series to evaluate, defaults to low
Returns: The lowest value during the current weekly session, or na if the timeframe is not suitable
monthly_high(source)
Returns the highest value of the specified source during the current monthly session. Can fail on lower timeframes.
Parameters:
source (float) : The data series to evaluate, defaults to high
Returns: The highest value during the current monthly session, or na if the timeframe is not suitable
monthly_low(source)
Returns the lowest value of the specified source during the current monthly session. Can fail on lower timeframes.
Parameters:
source (float) : The data series to evaluate, defaults to low
Returns: The lowest value during the current monthly session, or na if the timeframe is not suitable
yearly_high(source)
Returns the highest value of the specified source during the current yearly session. Can fail on lower timeframes.
Parameters:
source (float) : The data series to evaluate, defaults to high
Returns: The highest value during the current yearly session, or na if the timeframe is not suitable
yearly_low(source)
Returns the lowest value of the specified source during the current yearly session. Can fail on lower timeframes.
Parameters:
source (float) : The data series to evaluate, defaults to low
Returns: The lowest value during the current yearly session, or na if the timeframe is not suitable