SessionBoxLibrary "SessionBox"
This library provides functions to manage and visualize session boxes and labels on chart. A session box is a visual representation of a trading session with properties like time, name, color and the ability to track the high and low price within that session.
SessionBox
SessionBox: stores session data and provides methods to manage that data and visualize it on the chart.
Fields:
session_time (series bool)
session_name (series string)
session_color (series color)
Cari dalam skrip untuk "session"

SessionsThis is an advanced level sessions indicator.
Not so much an indicator, more of an auto way of plotting levels rather than drawing levels by hand every day.
It maps out the London and New York Sessions.
It also maps out the closing time and price for future reference.
Daily high and low of the past few days are laid out.
Each setting can be turned on and off in the settings if you don't require that session info.
The time settings are setup according to NY time. It should work straight without any modifications.
If you are a price action trader using sessions, this indicator will help you track price movement between sessions and give you possible support and resistance levels based on the previous session close.
This indicator does require allot of sessions based trading knowledge but if you understand it, it can be of major use to you.
Best used on GBP and USD currency pairs
Best timeframes 5Min - 1Hour
Best trading style would be day trading

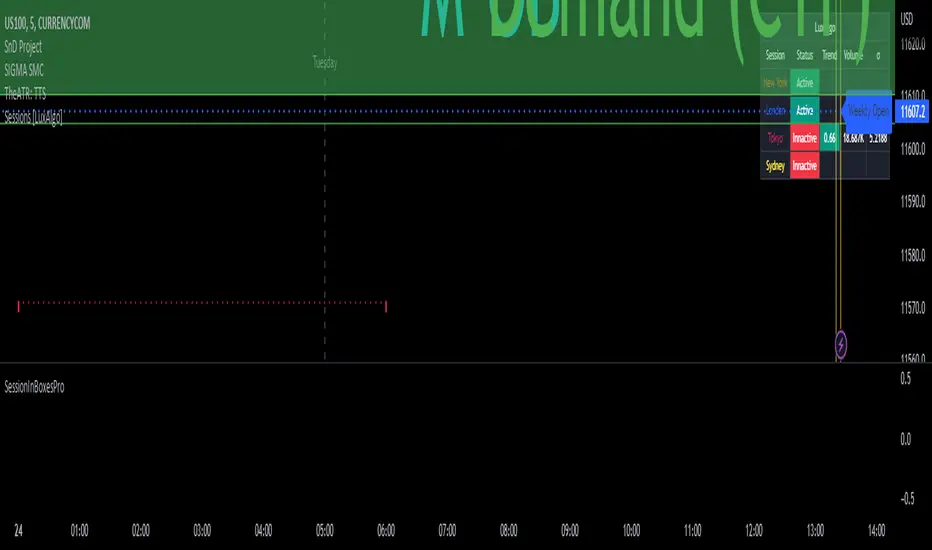
SessionsThis indicator highlights the New York After Hours and Pre-Market session and visually defines its structure on the chart.
The session runs from 18:00 to 09:30 New York time, covering the full overnight and pre-market trading window leading into the regular cash open.
During this period, the script tracks and marks the high and low of the New York pre-market, allowing traders to clearly see the overnight range that often acts as key liquidity, support, and resistance during the regular trading session.
The session range can be displayed as a shaded background or as a high/low range, depending on user preference.
For clarity and precision, the indicator is visible only on intraday timeframes:
5-minute
30-minute
1-hour
This makes it especially useful for futures, index, and intraday traders who incorporate pre-market structure into their trading plans.

SessionInBoxesProLibrary "SessionInBoxesPro"
get_time_by_bar(bar_count)
Parameters:
bar_count
get_positions_func(sessiontime_, duration_)
Parameters:
sessiontime_
duration_
get_period(_session, _start, _lookback)
Parameters:
_session
_start
_lookback
is_start(_session)
Parameters:
_session
is_end(_session)
Parameters:
_session
draw_progress(_show, _session, _is_started, _is_ended, _color, _bottom, _delete_history)
Parameters:
_show
_session
_is_started
_is_ended
_color
_bottom
_delete_history
draw_label(_show, _session, _is_started, _color, _top, _bottom, _text, _delete_history, i_label_chg, i_label_size, i_label_position, i_tz, i_label_format_day)
Parameters:
_show
_session
_is_started
_color
_top
_bottom
_text
_delete_history
i_label_chg
i_label_size
i_label_position
i_tz
i_label_format_day
draw_fib(_show, _session, _is_started, _color, _top, _bottom, _level, _width, _style, _is_extend, _delete_history)
Parameters:
_show
_session
_is_started
_color
_top
_bottom
_level
_width
_style
_is_extend
_delete_history
get_op_stricts(_session, _is_started, top, bottom, i_o_minutes)
Parameters:
_session
_is_started
top
bottom
i_o_minutes
draw_op(_show, _session, _is_started, _color, top, bottom, _is_extend, _delete_history, i_o_minutes, i_o_opacity)
Parameters:
_show
_session
_is_started
_color
top
bottom
_is_extend
_delete_history
i_o_minutes
i_o_opacity
get_pm_stricts(_show, _show_pm, tf, ctf, _is_started)
Parameters:
_show
_show_pm
tf
ctf
_is_started
draw_pm(_show, _show_pm, tf, ctf, _is_started, _is_ended, _delete_history, _color)
Parameters:
_show
_show_pm
tf
ctf
_is_started
_is_ended
_delete_history
_color
draw_market(_show, _session, _is_started, _color, btr, _top, _bottom, _extend, _is_extend, _delete_history, i_sess_border_style, i_sess_border_width, i_sess_bgopacity)
Parameters:
_show
_session
_is_started
_color
btr
_top
_bottom
_extend
_is_extend
_delete_history
i_sess_border_style
i_sess_border_width
i_sess_bgopacity
draw(_show, _show_pm, pm_tf, ctf, _session, _color, btr, _label, _extend, _show_fib, _show_op, i_label_chg, i_label_size, i_label_position, i_o_minutes, i_o_opacity, i_sess_border_style, i_sess_border_width, i_sess_bgopacity, i_show_history, i_show_closed, i_label_show, i_f_linewidth, i_f_linestyle, top, bottom, i_tz, i_label_format_day)
Parameters:
_show
_show_pm
pm_tf
ctf
_session
_color
btr
_label
_extend
_show_fib
_show_op
i_label_chg
i_label_size
i_label_position
i_o_minutes
i_o_opacity
i_sess_border_style
i_sess_border_width
i_sess_bgopacity
i_show_history
i_show_closed
i_label_show
i_f_linewidth
i_f_linestyle
top
bottom
i_tz
i_label_format_day
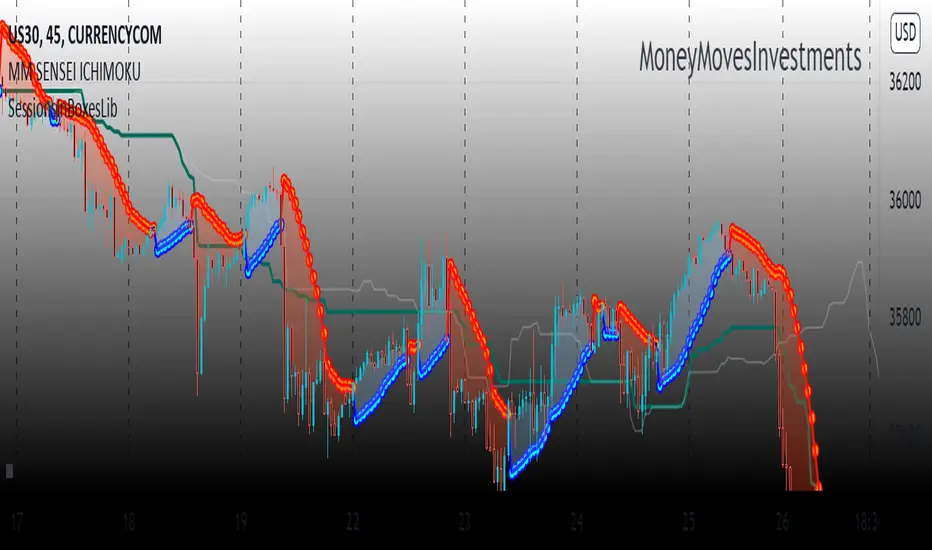
SessionsInBoxesLibLibrary "SessionsInBoxesLib"
Provides functions calculating the all-time high/low of values.
get_positions()
draw()
Session S/RThis indicator marks the resistances and supports of the post, pre and market sessions of the previous day projecting up to the market of the day, also it marks the hours of these three markets allowing to identify the beginning and end of the sessions in London, Hong Kong, and America.

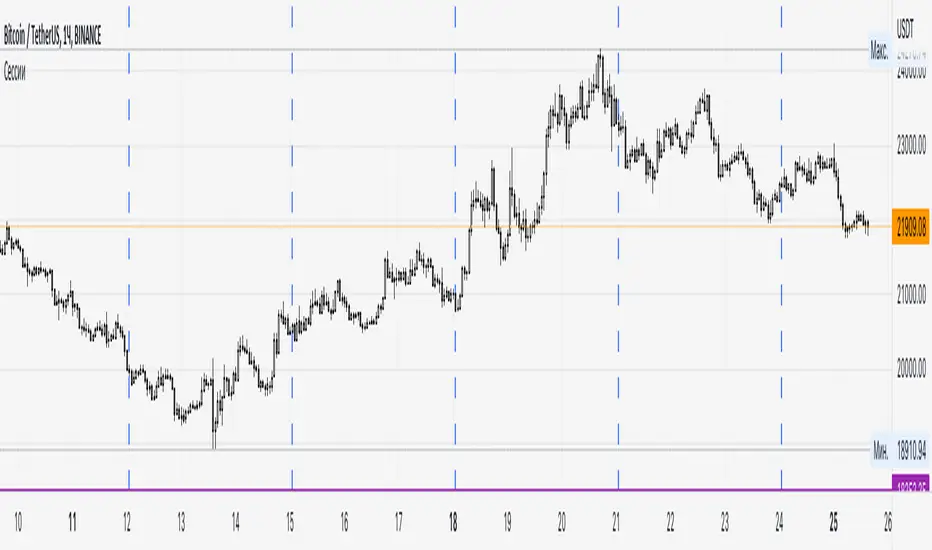
SessionsA very simple indicator that draws vertical lines on the chart to visually indicate session boundaries. You can set any target timeframe that is larger than the current one and is a multiple of it.
--
Очень простой индикатор, который строит вертикальные линии на графике, чтобы визуально указать границы сессий. Можно задавать любой целевой таймфрейм, который больше текущего и кратен ему.
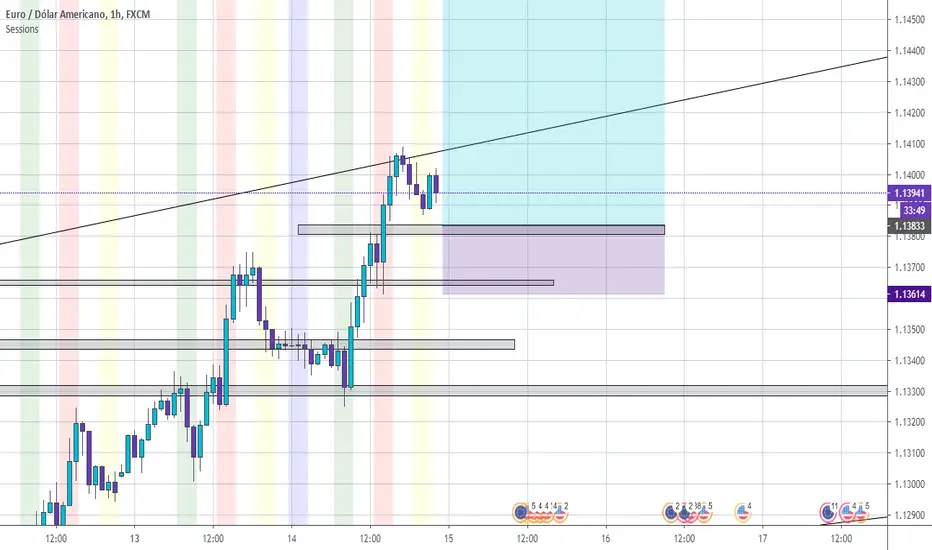
Sessions [Plug&Play]This indicator automatically highlights the three major FX trading sessions—Asia, London, and New York—on your chart and, at the close of each session, draws right-extended horizontal rays at that session’s high and low. It’s designed to help you visually identify when price is trading within each session’s range and to quickly see where the highest and lowest prices occurred before the next major session begins.
Key Features:
Session Boxes
Draws a semi-transparent box around each session’s timeframe (Asia, London, New York) based on your local UTC offset.
Each box dynamically expands in real time: as new candles form during the session, the box’s top and bottom edges update to match the highest high and lowest low seen so far in that session.
When the session ends, the box remains on your chart, anchored to the exact candles that formed its boundaries.
High/Low Rays
As soon as a session closes (e.g., London session ends at 17:00 UTC+0 by default), two horizontal rays are drawn at that session’s final high and low.
These rays are “pinned” to the exact candles where the high/low occurred, so they stay in place when you scroll or zoom.
Each ray extends indefinitely to the right, providing a clear reference of the key supply/demand levels created during that session.
Session Labels
Optionally places a small “London,” “New York,” or “Asia” label at the top edge of each completed session’s box.
Labels are horizontally centered within the session’s box and use a contrasting, easy-to-read font color.
Customizable Appearance
Show/Hide Each Session: Toggle display of London, New York, and Asia sessions separately.
Time Ranges: By default, London is 08:00–17:00 (UTC), New York is 13:00–22:00 (UTC), and Asia is 00:00–07:00 (UTC). You can override each session’s start/end times using the “Time Range” picker.
Color & Opacity: Assign custom colors to each session. Choose a global “Dark,” “Medium,” or “Light” opacity preset to adjust box fill transparency and border shading.
Show/Hide Labels & Outlines: Turn the text labels and the box borders on or off independently.
UTC Offset Support
If your local broker feed or price data is not in UTC, simply adjust the “UTC Offset (+/–)” input. The indicator will recalculate session start/end times relative to your chosen offset.
How to Use:
Add the Indicator:
Open TradingView’s Pine Editor, paste in this script, and click “Add to Chart.”
By default, you’ll see three translucent boxes appear once each session begins (Asia, London, New York).
Watch in Real Time:
As soon as a session starts, its box will appear anchored to the first candle. The top and bottom of the box expand if new extremes occur.
When the session closes, the final box remains visible and two horizontal rays mark that session’s high and low.
Analyze Key Levels:
Use the high- and low-level rays to gauge session liquidity zones—areas where stop orders, breakouts, or reversals often occur.
For example, if London’s high is significantly above current price, it may act as resistance in the New York session.
Customize to Your Needs:
Toggle specific sessions on/off (e.g., if you only care about London and New York).
Change each session’s color to match your chart theme.
Adjust the “UTC Offset” so sessions align with your local time.
Disable labels or box borders if you prefer a cleaner look.
Inputs Overview:
Show London/New York/Asia Session (bool): Show or hide each session’s box and its high/low rays.
Time Range (session): Defines the start/end of each session in “HHMM–HHMM” (24h) format.
Colour (color): Custom color for each session’s box fill, border, and high/low rays.
Show Session Labels (bool): Toggle the “London,” “New York,” “Asia” text that appears at the top of each completed box.
Show Range Outline (bool): Toggle the box border (if off, only a translucent fill is drawn).
Opacity Preset (Dark/Medium/Light): Controls transparency of box fill and border.
UTC Offset (+/–) (int): Adjusts session times for different time zones (e.g., +1 for UTC+1).
Why It’s Useful:
Quickly Identify Session Activity: Visually distinguish when each major trading session is active, then compare price action across sessions.
Pinpoint High/Low Liquidity Levels: Drawn rays highlight where the market hit its extremes—critical zones for stop orders or breakout entries.
Multi-Timeframe Context: By seeing historical session boxes and rays, you can locate recurring supply/demand areas, overlap zones, or session re-tests.
Fully Automated Workflow: Once added to your chart, the script does all the work of tracking session boundaries and drawing high/low lines—no manual box or line drawing necessary.
Example Use Cases:
London Breakout Traders: See where London’s high/low formed, then wait for price to revisit those levels during the New York session.
Range Breakout Strategies: If price consolidates inside the London box, use the boxed extremes as immediate targets for breakout entries.
Intraday Liquidity Swings: During quieter hours, watch Asia’s high/low to identify potential support/resistance before London’s opening.
Overlap Zones: Compare London’s range with Asia’s range to find areas of confluence—high-probability reversal or continuation zones.

Session High/Low [gdad]There are many strategies that use the 5 min, 10 min or 15 min opening candle. There are also strategies that look at the behavior of other markets such as Tokyo and London as well as the pre-market. Along with these strategies, there is one by The Rumers (@the.rumers) that also looks at the Day ATR with his Padder Scalp strategy.
I trade Futures and like to see how the market has done for varying trading sessions.
I found it was time consuming and distracting to my trading to manually mark all these different things up. This indicator takes TradingView's Trading Sessions indicator and combined ideas borrowed the idea of taking the opening range breakout and extending it to the end of the trading session from Opening Range & Prior Day High/Low along with some additional enhancements and provided information.
It comes pre-built with eight different sessions:
Session 1: Futures Session
Session 2: Tokyo
Session 3: London
Session 4: NY Pre-Market
Session 5: New York
Session 6: 5 min open
Session 7: 10 min open
Session 8: 15 min open
The names, time spans, time zones, colors, whether to show the mid-line or averages and whether and how far to extend them are all customizable once you click Show Session. You can show none, one or multiple sessions. You can also choose which text shows up in the text box (the same will show for each session).
Warning: The Extend to Time range must start during the Session Time. You cannot have a Session Time of 9:30-9:45 and an Extend Time from 10:00-4:00.
Average is calculated by the sum of the close divided by the number of bars for the session.

Session VWAPS [QuantVue]The Session VWAPS indicator is a designed for traders to enhance their trading analysis by incorporating Volume Weighted Average Price (VWAP) anchored to custom-defined trading sessions.
This indicator automatically plots VWAPs at three critical points of a user defined session:
🔹session start
🔹session high
🔹session low
Additionally, it provides the option to display the VWAPs from previous sessions, offering a look at potential areas of support and resistance.
Anchored VWAP, or Anchored Volume-Weighted Average Price, is a technical analysis tool used to determine the average price of a stock weighted by volume, starting from a specific point in time chosen by the analyst.
Unlike traditional VWAP, which starts at the beginning of the trading session, the anchored VWAP allows traders to select any point on the chart, such as a significant event, price low, high, or a breakout, to begin the calculation.
VWAP incorporates price and volume in a weighted average and can be used to identify areas of support and resistance on the chart.
Indicator Features:
Custom Session Definition:
Users can define their own trading sessions by specifying start and end times, allowing for tailored analysis according to individual trading strategies or market hours.
Anchored VWAP at Three Key Points:
🔹Session Start VWAP: This VWAP is anchored at the start of the defined session.
🔹Session High VWAP: Anchored at the highest price point within the session.
🔹Session Low VWAP: Anchored at the lowest price point within the session.
Previous Session VWAPs:
The indicator can display VWAPs from the previous session, allowing traders to spot potential areas of support and resistance.
Give this indicator a BOOST and COMMENT your thoughts below!
We hope you enjoy.
Cheers!

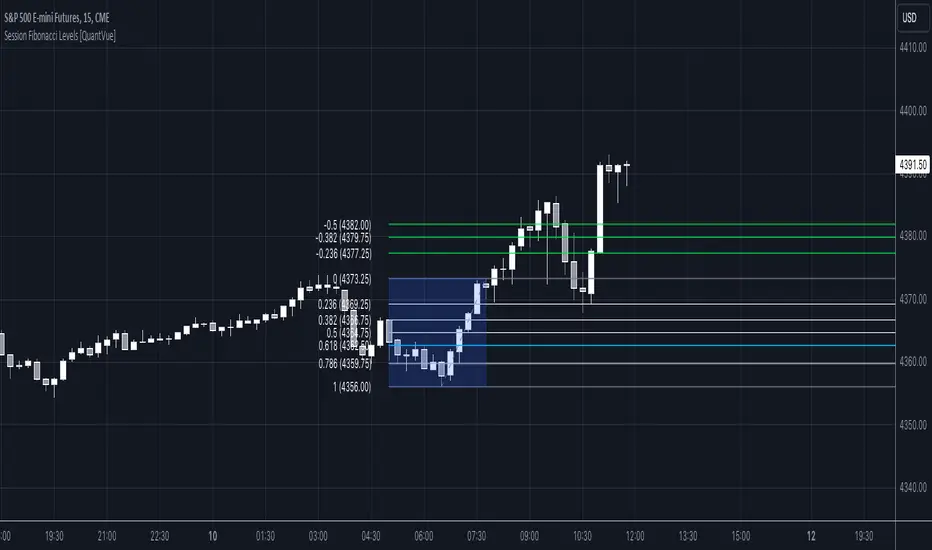
Session Fibonacci Levels [QuantVue]The "Session Fibonacci Levels" indicator is a powerful tool designed for traders who aim to use Fibonacci retracement and extension levels in their trading strategy.
The indicator combines Fibonacci levels with customized trading sessions, allowing traders to observe and utilize Fibonacci levels that are automatically calculated for each defined session.
This approach offers a dynamic and session-relevant perspective on potential support and resistance levels, which can be crucial for intraday trading strategies.
🔹The indicator calculates Fibonacci retracement and extension levels based on the high and low prices of a specified trading session, dynamically adjusting to the location of the high and low bar.
If the low of the session occurs before the high, the fib levels are measured from low to high.
If the low of the session occurs after the high, the fib levels are measured from high to low.
🔹Users can set their time zone and define trading sessions, allowing for flexibility and applicability across global markets. This is particularly beneficial for traders who focus on specific market hours like the London or New York sessions.
Important sessions:
New York (8:00am - 5:00pm EST)
London (3:00am - 12:00pm EST)
Asia (7:00pm - 4:00am EST)
Custom session (user defined session in indicator settings)
🔹The indicator dynamically updates Fibonacci levels as new highs and lows are made within the session, keeping the analysis current. Additionally, it provides alerts when prices hit key Fibonacci levels, aiding in timely decision-making.
How to Use:
Configure the time zone and session time
Once the session begins, the indicator will begin highlighting the session range
When the session ends, Fibonacci levels based on the high and low of the session will be drawn
Use these levels to identify potential support and resistance areas
Session Anchored OIWAP [Arjo]The Session Anchored OIWAP (Open Interest Weighted Average Price) indicator shows you a weighted average price that uses Open Interest (OI) changes during different trading sessions . It divides the day into four clear sessions: Opening Hour , Morning Session , Mid-Day Session , and Closing Session .
For each session , it calculates a weighted average price using both market price and open interest data from futures . This line updates as the session progresses and resets when a new session starts .
You can also see optional deviation bands that you visually compare to how far the market price is moving away from the session’s weighted average. This indicator also helps you watch how Open Interest changes connect with price movements during specific market hours.
Concepts
This tool works on a few simple ideas:
Session anchoring
Each session starts fresh. The indicator resets and begins a new calculation when a new time block begins. This allows users to visually study each session independently.
Open-interest weighting
Instead of treating all price moves equally, price changes linked to higher open-interest activity have more influence on the OIWAP. This gives a weighted reflection of where the market has been trading during the session.
Averaging and smoothing
The OIWAP line blends many price data points into one smooth curve, making it easier to follow than raw price movement.
Volatility display with bands
The upper and lower bands are placed at ±0.5 standard deviation from the OIWAP line. These bands simply help you see when price stretches further away than usual from the session average.
Features
Four Independent Session Calculations: Shows separate OIWAP lines for Opening Hour (default: 09:15-10:15), Morning (10:15-11:30), Mid-Day (11:30-14:00), and Closing (14:00-15:30) sessions
Open Interest Weighting: Uses absolute OI change as the weight instead of traditional volume
Customizable Session Times: You can change the time ranges for each session to match your market or what you need
Optional Deviation Bands: You can turn ±0.5 standard deviation bands on or off around each OIWAP line
Color-Coded Sessions: Each session has its own color so you can tell them apart easily
Selective Display: You can turn individual sessions and bands on or off
Data Availability Check: Shows you a notification when Open Interest data isn't available for your symbol
Adjustable Position Timeframe: You can calculate OI changes on different timeframes (Chart, Daily, 15min, 30min, 60min, 120min)
How to use
Add this indicator to a chart of any symbol that has Open Interest data ( from futures or derivatives contracts). Once you add it, you'll see colored lines showing the OIWAP for each session you enable, along with optional deviation bands.
Adjusting Settings:
Turn individual sessions on or off using the checkboxes in the " Sessions " section
Change session colors to match your chart or what looks good to you
Turn deviation bands on or off using the " Show Bands " option in the Display settings
Change session time ranges in the " Session Times " section to match your market hours or what you want to analyze
Change the Position Timeframe if you want to see OI changes calculated on a different time period
Visual Interpretation:
Each OIWAP line shows you the OI-weighted average price for that session
The deviation bands show you how much prices spread out, weighted by OI changes
You can watch how price interacts with these levels to see where significant OI activity happened
Different sessions may show different OIWAP levels, showing you how the OI-price relationship changes throughout the trading day
Note:
This indicator needs Open Interest data to work. If OI data isn't available for your symbol, you'll see a message in the center of your chart. This indicator works only with derivatives markets like futures and options in the Indian Market where OI data is publicly available.
Conclusion
The Session Anchored OIWAP indicator is designed to support structured market observation by combining price, open interest, and session anchoring into a clear visual format. It helps users study market behavior during different parts of the day without generating trading instructions or outcomes.
Disclaimer
This indicator is for educational and visual-analysis purposes only. It does not provide trading signals , financial advice, or guaranteed outcomes . You should perform your own research and consult a licensed financial professional when needed. All trading decisions are solely the responsibility of the user.
Happy Trading

Session Highs and Lows🔑 Key Levels: Session Liquidity & Structure Mapper
The Key Levels indicator is an essential tool for traders as it automatically plots and projects critical Highs and Lows established during key trading sessions. These levels represent major liquidity pools and define the current market structure, serving as high-probability targets, support, or resistance for the remainder of the trading day.
⚙️ Core Functionality
The indicator operates in two distinct modes, tailored for different asset classes:
1. Asset Class Mode (Toggle)
You can switch between two predefined setups depending on the asset you are trading:
Stock Mode (RTH/ETH): Designed for US stocks and futures (e.g., NQ, ES, YM). It tracks and projects levels for Regular Trading Hours (RTH) (09:30-16:00) and Extended Hours (ETH) (16:00-09:30).
Forex/Default Mode (Asia/London/NY): Designed for global markets (e.g., currency pairs). It tracks and projects levels for the three major liquidity sessions: Asia (19:00-03:00), London (03:00-09:30), and New York (09:30-16:00).
🗺️ Key Levels Mapped
The script continuously tracks and plots the most significant structural levels:
Current Session High/Low: The running high and low of the currently active session.
Previous Session High/Low: The confirmed high and low from the most recently completed session. These are often targeted by market makers.
Previous Day High/Low (PDH/PDL): The high and low of the prior 24-hour day, acting as major structural boundaries and a crucial macro market filter.
🎛️ Advanced Liquidity Management
The indicator is built with specific controls for high-level liquidity analysis:
Extend Through Sweeps (Critical Setting):
OFF (Recommended): The projected line is automatically stopped or deleted the moment the price candle wicks or closes past it. This visually confirms that the liquidity at that level has been "swept" or "mitigated."
ON: The line extends indefinitely, treating the level as simple support/resistance, regardless of interaction.
Previous vs. Current View: You can select a checkbox (e.g., Use PREVIOUS London Level) to hide the current session's running levels and only display the static, confirmed high/low from the prior completed session. This helps declutter the chart and focus only on the confirmed structural levels.
Show Older History: Toggle to keep lines from prior days visible, allowing you to track multi-day structural context.
🎯 Trading Application
The lines plotted by the Key Levels indicator provide immediate, actionable information:
Bias Filter: Use the PDH/PDL to determine the overall market context. Trading above the PDH suggests a bullish bias, while trading below the PDL suggests a bearish bias.
Manipulation/Entry: Wait for price to aggressively sweep a Previous Session High/Low (line stops extending). This often signals a liquidity grab or "manipulation" phase. Look for entries in the opposite direction for the main move (Distribution).
Targets: Key levels (especially unmitigated ones) serve as excellent, objective take-profit targets for active trades.

Session Sweep System – WarRoomXYZ V1WarRoom Session Sweep System v1 is a open-source institutional trading framework built to identify liquidity behavior across Asia, London, and New York sessions.
It combines session-based liquidity mapping, sweep detection, daily expansion modeling, and trend confirmation into a unified, timing-driven system optimized for XAUUSD, FX pairs, indices, and any instrument with session-dependent volatility.
This tool does not attempt to predict direction with arbitrary oscillators.
Instead, it focuses on the underlying market mechanisms that drive price:
liquidity, timing, expansion, and trend alignment.
Below is a detailed explanation of what the script does, how its components work, and how traders can use it effectively.
🔹 1. Session Liquidity Mapping
The script automatically identifies the Asia (00:00–06:00 GMT), London (07:00–12:00 GMT), and New York (13:00–17:00 GMT) sessions and builds real-time session ranges.
Each session creates a liquidity pool.
Trading institutions frequently sweep the high or low of one session before delivering the real move in the next session.
This script captures that behavior by:
►Drawing session range boxes
►Tracking previous session highs/lows
►Highlighting high-probability sweep locations
These ranges are essential reference points for timing entries and exits.
🔹 2. Liquidity Sweep Detection (Buy & Sell Sweeps)
The indicator identifies when price runs a previous session high/low and rejects back inside the range, which is commonly interpreted as a liquidity sweep.
The following sweep types are monitored:
►London sweeping Asia
►New York sweeping London
►Asia sweeping New York
►Daily sweep of PDH/PDL
Sweeps signal that liquidity has been collected and that a potential reversal or continuation is likely.
These are marked clearly on the chart for real-time decision-making.
🔹 3. Killzone Timing Model (GMT Time)
Market manipulation and expansion often occur during specific time windows.
The script highlights these institutional killzones:
►London Killzone: 07:00–10:00 GMT
►New York Killzone: 13:30–15:30 GMT
►NY PM Session: 19:00–21:00 GMT
Sweeps occurring inside these windows carry a significantly higher probability.
The timing layer helps filter out low-quality setups.
🔹 4. Daily Range & ADR Expansion Engine
A dedicated panel displays:
►Current day range
►ADR (Average Daily Range)
►Expansion stage (Early / Developed / Extended)
►PDH/PDL swept or intact
►Overall session bias
This allows traders to understand whether the daily move is likely to continue or reverse.
For example:
►Early expansion → trend continuation likely
►Extended expansion → reversal setups become more probable
This is useful for intraday targets and risk management.
🔹 5. MA Cloud Trend Model (Fast/Slow Structure)
To align liquidity behavior with directional conviction, the script includes a configurable MA engine:
►Fast & slow MA
►MA cloud
►Slope-based trend coloring
►Trend background
►MA cross alerts
The cloud provides trend confirmation without relying on oscillators.
Trades are higher quality when the sweep direction aligns with the MA trend.
🔹 6. How the Components Work Together
The script integrates several institutional concepts into one coherent model:
►Sessions define liquidity pools
►Sweeps identify stop-hunts and reversals
►Killzones define optimal timing
►MA Cloud confirms directional bias
►ADR engine indicates expansion potential
This creates a structured framework:
Sweep → Timing → Trend → Expansion → Execution
Each component strengthens the others, forming a robust decision-making model.
🔹 7. How to Use the Indicator (Practical Guide)
✔ Look for a sweep of a previous session level
When price runs a session high/low and closes back inside, liquidity has likely been collected.
✔ Confirm timing
Sweeps inside London or NY killzones tend to produce the strongest moves.
✔ Confirm trend
Use MA cloud direction and slope:
►Cloud green → long setups preferred
►Cloud red → short setups preferred
✔ Check ADR panel
If the day has already expanded significantly, reversal setups are more likely.
If expansion is still early, continuation setups are favored.
✔ Plan your trade
Common targets include:
►Opposite side of session range
►ADR High/Low
►PDH/PDL
Stops are typically placed beyond the sweep wick.
This creates a repeatable, rule-based approach to intraday liquidity trading.
🔹 8. Why This Script Is Original
This is not a mashup of existing open-source indicators.
It introduces:
►A custom session-linked liquidity sweep engine
►A structured daily expansion model
►Integrated killzone timing aligned with GMT
►A unified bias panel merging sweeps, ADR, and session manipulation
►A trend confirmation layer designed around session behavior
While it uses known institutional concepts, their integration, execution, and timing framework are unique, purpose-built, and not directly found in open-source scripts.
🔹 9. Suitable Markets
This indicator works best on:
►XAUUSD
►Major FX pairs
►US indices
►Synthetic markets with session cycles
Ideal timeframes: 1m, 5m, 15m, 30m
🔹 10. Limitations / Notes
This is an analytical tool, not a buy/sell signal generator
All sweeps are confirmed at candle close (non-repaint)
The tool assumes GMT session windows unless chart time differs
Users must practice risk management and entry triggers manually
Disclaimer
This script is provided for informational and educational purposes only. It does not provide financial, investment, or trading advice, and it does not guarantee profits or future performance. All decisions made based on this script are solely the responsibility of the user.
This script does not execute trades, manage risk, or replace the need for trader discretion. Market behavior can change quickly, and past behavior detected by the script does not ensure similar future outcomes.
Users should test the script on demo or simulation environments before applying it to live markets and must maintain full responsibility for their own risk management, position sizing, and trade execution.
Trading involves risk, and losses can exceed deposits. By using this script, you acknowledge that you understand and accept all associated risks.

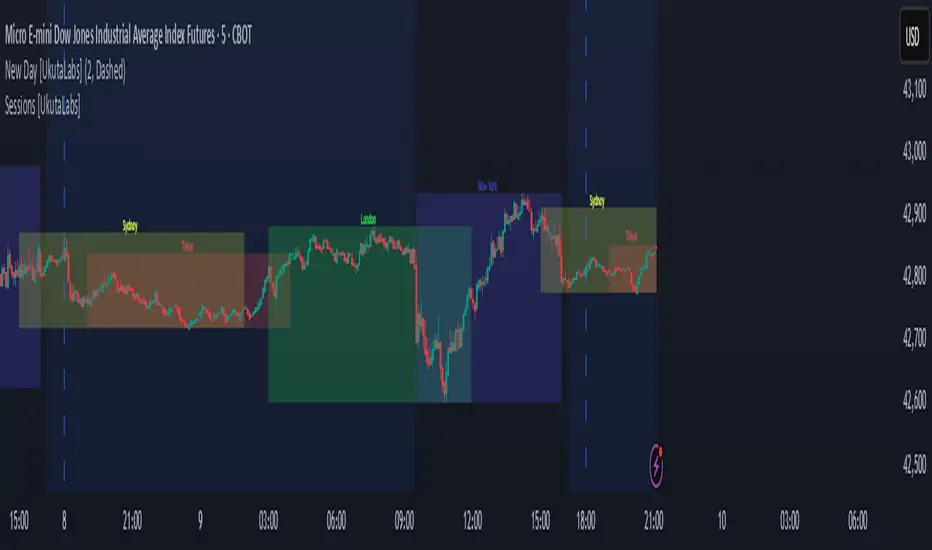
Sessions [UkutaLabs]█ OVERVIEW
Sessions is a trading toolkit that displays the different trading sessions on your chart during a trading day. By default, Sessions displays the four standard trading sessions; New York, Tokyo, London, and Sydney.
Each of the four sessions can be toggled, and the Sessions indicator is completely customizable, allowing users to define their own sessions to be generated by the script.
The aim of this script is to improve the trading experience of users by automatically displaying information about each default or custom session to the user.
█ USAGE
This script will automatically detect and label different market sessions. By default, the script will identify the four standard trading sessions, but each of these can be toggled off in the settings.
However, users are not limited to these four trading sessions and have the ability to define their own sessions to be identified by the script. When a session begins, the script will automatically start outlining the market data of that session, including the high and low of the period that is represented by the session.
If the market is within two or more sessions at the same time, then each session will be treated individually and will overlap with each other.
The sessions will be identified as a colored box surrounding the market data of the period that it represents, and a label will be displayed above the box to identify the session that it represents. The label, color and period of each session is completely customizable.
The user can also adjust all sessions at once to account for timezones in the settings.
█ SETTINGS
Session 1
• Session 1: Determines whether or not this session will be drawn by the script.
• A string field to determine the name of the session that will be displayed above the session range.
• Two time fields representing the start and finish of the session.
• A color field to determine the color of the range and label.
Session 2
• Session 2: Determines whether or not this session will be drawn by the script.
• A string field to determine the name of the session that will be displayed above the session range.
• Two time fields representing the start and finish of the session.
• A color field to determine the color of the range and label.
Session 3
• Session 3: Determines whether or not this session will be drawn by the script.
• A string field to determine the name of the session that will be displayed above the session range.
• Two time fields representing the start and finish of the session.
• A color field to determine the color of the range and label.
Session 4
• Session 4: Determines whether or not this session will be drawn by the script.
• A string field to determine the name of the session that will be displayed above the session range.
• Two time fields representing the start and finish of the session.
• A color field to determine the color of the range and label.
Time Zones
• UTC +/-: Determines the offset of each session. Enter - before the number to represent a negative offset.
Session Highlighter with Kill Zones [Exponential-X]Session Highlighter with Kill Zones
Overview
This indicator provides comprehensive visualization of major forex trading sessions (Asian, London, and New York) with integrated kill zone detection and real-time session analytics. It helps traders identify optimal trading times by highlighting high-volatility periods and tracking session-specific price ranges.
What Makes This Original
While session indicators are common, this script uniquely combines several features that work together:
Kill Zone Integration: Highlights specific high-volatility windows within sessions (London: 02:00-05:00 EST, NY: 08:30-11:00 EST) when institutional activity typically peaks
Session Overlap Detection: Automatically detects and highlights when major sessions overlap (London-NY, Asian-London) with distinct visual cues
Real-Time Range Tracking: Calculates and displays percentage-based session ranges as they develop, not just historical data
Dynamic Statistics Dashboard: Live table showing current active session, session times, and comparative range percentages
Customizable Visual System: Flexible styling options including background shading, box overlays, and configurable line styles for session boundaries
How It Works
Session Detection Logic
The script uses timezone-normalized session detection based on EST/EDT times. It converts the current bar's timestamp to New York time and determines which session(s) are active using minute-based calculations. This approach ensures accurate session detection regardless of your chart's timezone settings.
Kill Zones
Kill zones represent periods within sessions when institutional traders are most active. The London kill zone (02:00-05:00 EST) captures pre-London open volatility, while the NY kill zone (08:30-11:00 EST) aligns with US economic data releases and market open activity.
Range Calculations
Session highs, lows, and opens are tracked from the first bar of each session and updated in real-time. Range percentages are calculated as: ((High - Low) / Low) × 100 , providing a volatility measure that's comparable across different instruments and price levels.
Visual System
Background shading: Color-coded zones for each session
Session boxes: Outline entire session ranges
H/L lines: Dynamic lines showing current session extremes
Open lines: Reference levels from session start
Overlap highlighting: Distinct colors when multiple sessions are active simultaneously
How to Use
Intraday Trading: Use kill zones to time entries during high-liquidity periods
Session Breakouts: Monitor for price breaks above/below session highs/lows
Range Trading: Trade between session boundaries during consolidation
Session Continuity: Observe how price behaves as sessions transition
Volatility Assessment: Compare current session ranges to typical values
Recommended Timeframes: Works on any timeframe, but most useful on 1m to 1H charts for intraday trading.
Settings Explained
Sessions Group
Toggle each major session on/off independently
Customize colors for visual clarity
Enable/disable overlap highlighting
Levels Group
Show/hide session high/low lines
Show/hide session open levels
Choose line styles (Solid/Dashed/Dotted)
Kill Zones Group
Toggle kill zone highlighting
Select which kill zones to display
Customize kill zone color intensity
Display Group
Show/hide statistics table
Show/hide session labels on chart
Important Notes
All times are displayed in EST/EDT
Session ranges reset at the start of each new session
Kill zones are session sub-periods, not separate sessions
Overlap colors override individual session colors when multiple sessions are active
The statistics table updates in real-time and shows percentage-based ranges for cross-instrument comparison
Session Times Reference
Asian Session: 19:00 - 04:00 EST (Tokyo open through early Sydney close)
London Session: 03:00 - 12:00 EST (Full European trading hours)
New York Session: 08:00 - 17:00 EST (US market hours)
London Kill Zone: 02:00 - 05:00 EST (Pre-London volatility spike)
NY Kill Zone: 08:30 - 11:00 EST (US open and news releases)
Alerts Available
The script includes six pre-configured alert conditions:
London Kill Zone start
NY Kill Zone start
London-NY Overlap start
Asian Session open
London Session open
NY Session open
Create alerts through TradingView's alert system to get notified when specific sessions or kill zones begin.
Disclaimer: This indicator is for informational purposes only. Session times and kill zones are based on typical market patterns but do not guarantee specific trading outcomes. Always use proper risk management.

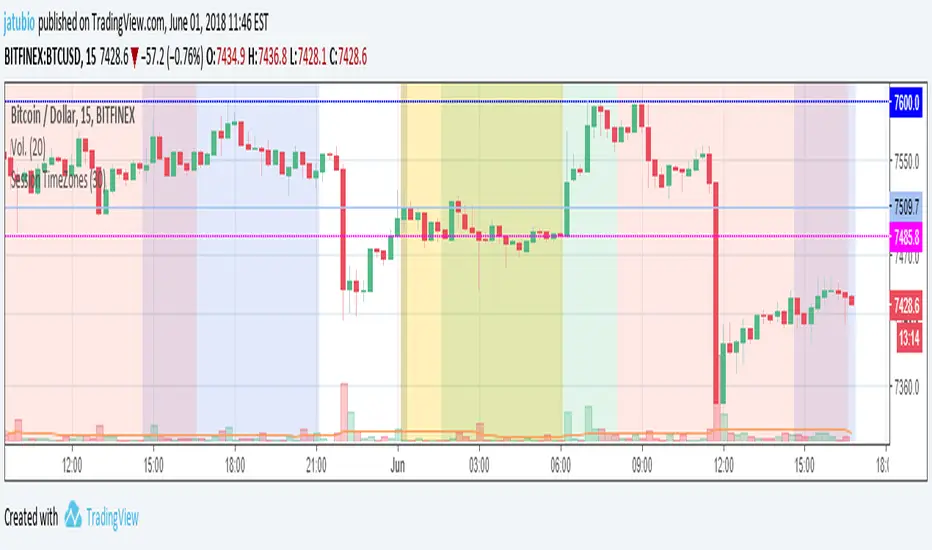
Session TimeZonesThis indicators show background colours to identify world timezones
New York, London, Tokio, China and Sydney sessions
You can also setup timeframe intervals to show or hide.
Time Values based on UTC: ** YOU HAVE TO SETUP YOUR CHARTS TO 0-UTC TIMEZONE **
Values from: en.wikipedia.org
New York: UTC-5
Market Session: 09:30 - 16:00 (Local Time)
Market Session: 14:30 - 21:00 (UTC Based Time)
London: UTC
Market Session: 08:00 - 16:30 (Local Time)
Market Session: 08:00 - 16:30 (UTC Based Time)
Tokyo: UTC+9
Market Session: 09:00 - 15:00 (Local Time)
Market Session: 00:00 - 06:00 (UTC Based Time)
China: UTC+8
Market Session: 09:30 - 16:00 (Local Time)
Market Session: 01:30 - 08:00 (UTC Based Time)
Sydney: UTC+10
Market Session: 10:00 - 16:00 (Local Time)
Market Session: 00:00 - 06:00 (UTC Based Time)
Can be used to know from what time of the world they are traders awake or
to search correlations between big moves and timezones hours.
Thanks to:
www.tradingcode.net
01/06/2018
Session-Conditioned Regime ATRWhy this exists
Classic ATR is great—until the open. The first few bars often inherit overnight gaps and 24-hour noise that have nothing to do with the intraday regime you actually trade. That inflates early ATR, scrambles thresholds, and invites hyper-recency bias (“today is crazy!”) when it’s just the open being the open.
This tool was built to:
Separate session reality from 24h noise. Measure volatility only inside your defined session (e.g., NYSE 09:30–16:00 ET).
Judge candles against the current regime, not the last 2–3 bars. A rolling statistic from the last N completed sessions defines what “typical” means right now.
Label “large” and “small” objectively. Bars are colored only when True Range meaningfully departs from the session regime—no gut feel, no open-bar distortion (gap inclusion optional).
Overview
Purpose: objectively identify unusually big or small candles within the active trading session, compared to the recent session regime.
Use cases: volatility filters, entry/exit confirmation, session bias detection, adaptive sizing.
This indicator replaces generic ATR with a session-conditioned, regime-aware measure. It colors candles only when their True Range (TR) is abnormally large/small versus the last N completed sessions of the same session window.
How it works
Session gating: Only bars inside the selected session are evaluated (presets for NYSE, CME RTH, FX NY; custom supported).
Per-bar TR: TR = max(high, prevRef) − min(low, prevRef).
prevRef is the prior close for in-session bars.
First bar of the session can include the overnight gap (optional; default off).
Regime statistic: For any bar in session k, aggregate all in-session TRs from the previous N completed sessions (k−N … k−1), then compute Median (default) or Mean.
Today’s anchor: Running statistic from today’s session start → current bar (for context and the on-chart ratio).
Color logic:
Big if TR ≥ bigMult × RegimeStat
Small if TR ≤ smallMult × RegimeStat
Colored states: big bull, big bear, small bull, small bear.
Non-triggering bars retain the chart’s native colors.
Panel (top-right by default)
Regime ATR (Nd): session-conditioned statistic over the past N completed sessions.
Today ATR (anchored): running statistic for the current session.
Ratio (Today/Regime): intraday volatility vs regime.
Sample size n: number of bars used in the regime calculation.
Inputs
Session Preset: NYSE (09:30–16:00 ET), CME RTH (08:30–15:00 CT), FX NY (08:00–17:00 ET), Custom (session + IANA timezone).
Regime Window: number of completed sessions (default 5).
Statistic: Median (robust) or Mean.
Include Open Gap: include overnight gap in the first in-session bar’s TR (default off).
Big/Small thresholds: multipliers relative to RegimeStat (defaults: Big=1.5×, Small=0.67×).
Colors: four independent colors for big/small × bull/bear.
Panel position & text size.
Hidden outputs: expose RegimeStat, TodayStat, Ratio, and Z-score to other scripts.
Alerts
RegimeATR: BIG bar — triggers when a bar meets the “Big” condition.
RegimeATR: SMALL bar — triggers when a bar meets the “Small” condition.
Hidden outputs (for strategies/screeners)
RegimeATR_stat, TodayATR_stat, Today_vs_Regime_Ratio, BarTR_Zscore.
Notes & limitations
No look-ahead: calculations only use information available up to that bar. Historical colors reflect what would have been known then.
Warm-up: colors begin once there are at least N completed sessions; before that, regime is undefined by design.
Changing inputs (session window, multipliers, median/mean, gap toggle) recomputes the full series using the same rolling regime logic per bar.
Designed for standard candles. Styling respects existing chart colors when no condition triggers.
Practical tips
For a broader or tighter notion of “unusual,” adjust Big/Small multipliers.
Prefer Median in markets prone to outliers; use Mean if you want Z-score alignment with the panel’s regime mean/std.
Use the Ratio readout to spot compression/expansion days quickly (e.g., <0.7× = compressed session, >1.3× = expanded).
Roadmap
More session presets:
24h continuous (crypto, index CFDs).
23h/Globex futures (CME ETH with a 60-minute maintenance break).
Regional equities (LSE, Xetra, TSE), Asia/Europe/NY overlaps for FX.
Half-day/holiday templates and dynamic calendars.
Multi-regime comparison: track multiple overlapping regimes (e.g., RTH vs ETH for futures) and show separate stats/ratios.
Robust stats options: trimmed mean, MAD/Huber alternatives; optional percentile thresholds instead of fixed multipliers.
Subpanel visuals: rolling TodayATR and Ratio plots; optional Z-score ribbon.
Screener/strategy hooks: export boolean series for BIG/SMALL, plus a lightweight strategy template for backtesting entries/exits conditioned on regime volatility.
Performance/QOL: per-symbol presets, smarter warm-up, and finer control over sample caps for ultra-low TF charts.
Changelog
v0.9b (Beta)
Session presets (NYSE/CME RTH/FX NY/Custom) with timezone handling.
Panel enhancements: ratio + sample size n.
Four-state bar coloring (big/small × bull/bear).
Alerts for BIG/SMALL bars.
Hidden Z-score stream for downstream use.
Gap-in-TR toggle for the first in-session bar.
Disclaimer
For educational purposes only. Not investment advice. Validate thresholds and session settings across symbols/timeframes before live use.

Sessions ny vizScript Purpose
This indicator draws a colored background during the New York trading session. It's useful for traders who want to have a visual overview of when the American (NY) trading session is active.
Main Features
NY Session Visualization - draws a gray bar in the background of the chart during NY trading hours (15:00-19:00 CET)
Customization - allows users to:
Set custom session time range
Adjust background color and transparency
Limit display to only the last 24 hours
Input Parameters
sessionRange - session time range (default 15:00-19:00 CET)
sessionColour - background color (default gray with 90% transparency)
onlyLast24Hours - toggle for showing only the last 24 hours (default false)
Technical Details
Script is written in Pine Script version 5
Uses UNIX timestamp for time period calculations
Runs as an overlay indicator (overlay=true), meaning it displays directly on the price chart
Uses the bgcolor() function for background rendering
Contains logic to check if current time is within defined session
Usage
This indicator is useful for:
Monitoring active NY trading session hours
Planning trades during the most liquid hours of the US market
Visual orientation in the chart during different trading sessions

Session Filter [Trendoscope]🎲 Session Filter: A Customisable Trading Indicator for Defining Preferred Trade Sessions
Session Filter is a simple trading indicator that enables traders to define their preferred trading sessions and optimise their approach based on individual preferences. By providing a range of flexible customisation options, Session Filter can help traders reduce risk, increase accuracy, by helping them to adhere to their trading sessions. Features include
🎯 Customisable Trading Sessions
One of the key features of Session Filter is the ability to select from four different trading sessions. These sessions are designed to be flexible, making it easy to tailor your approach to specific markets, assets, and trading styles. By selecting the sessions that are most relevant to your strategy, you can reduce the risk of making trades during less favourable market conditions.
For example, if you prefer to trade during the Asian session, you can set the session times to "Asian Session" in input settings. This will highlight the specific times when the Asian markets are open, allowing you to focus your trading activity during these periods. By doing so, you can avoid trading during times when the market is less active or more volatile.
🎯 Customisable Timezone and Days of the Week:
In addition to customisable trading sessions, Session Filter also allows users to select a timezone and specific days of the week. This ensures that the displayed trading zones and signals are aligned with your local time, and that you can tailor your approach to your preferred schedule. This is particularly useful for traders who have other commitments, or who prefer to focus on specific markets or assets on certain days.
For example, if you are based in New York and prefer to trade during the European session, you can select the "European Session" option in Session Filter and adjust the timezone to reflect your local time. You can also select specific days of the week when you prefer to trade during the European session, such as Tuesday through Thursday. This allows you to optimize your approach based on your personal preferences and schedule.
🎯 Easy Visual Interpretation:
Session Filter uses green and red overlays on the chart to indicate the trading zones, making it easy for users to visually identify their trading sessions
For example, when a green overlay is displayed on the chart, this indicates that the market is within the selected trading session and that it may be a good time to start trade. Conversely, when a red overlay is displayed, this indicates that the market is outside of the selected trading session and that it may be a good time close all trading. By providing this visual feedback, Session Filter helps traders stay focused and disciplined, and avoid making impulsive trading decisions.
🎯Force Exit Signal for Risk Management:
Session Filter also offers the ability to generate a force exit signal when not in any of the selected sessions. This can be used in conjunction with alerts to exit all trades outsize session zone.
For example, if you are using Session Filter to trade during the European session, but the market is particularly volatile during a specific day, the force exit signal will be generated to indicate that it may be a good time to exit your trade. This helps you avoid potential losses and stay disciplined during periods of market turbulence.
🎯External Signal Plots:
In addition to the chart overlays, Session Filter also plots signals on the data window that can be used as external inputs in other indicators and strategies. This feature allows traders to incorporate the signals generated by Session Filter into their existing trading systems and this can be used as additional filters on an existing strategy or methodology.
🎯Alerts using Alert Conditions
Alerts are provided for start and end of session so that users can make use of it to set auto turn on or off their bots.
Settings are pretty simple and are explained here.

Session First 5-Min High/LowHere's a professional description for your indicator:
Session First 5-Min High/Low Marker
This indicator automatically identifies and marks the high and low price levels established during the first 5 minutes of major trading sessions, helping traders identify key intraday support and resistance zones.
Key Features:
Tracks three major trading sessions in IST (Indian Standard Time):
Asian Session: 5:30 AM - 5:35 AM
London Session: 12:30 PM - 12:35 PM
New York Session: 5:30 PM - 5:35 PM
Draws horizontal lines at the highest and lowest prices reached during each session's opening 5-minute window
Color-coded for easy identification (Yellow for Asian, Blue for London, Red for New York)
Lines extend across the chart to help track price reactions throughout the day
Clean, minimal design with optional labels
Best Used For:
Identifying key intraday support and resistance levels
Session breakout trading strategies
Understanding institutional order flow at market opens
Works on 1-minute timeframe for precise tracking
Customizable Settings:
Toggle line extensions on/off
Adjust line width (1-5)
Change colors for each session
Show/hide session labels
Perfect for day traders and scalpers who trade around major session openings and want to identify high-probability support/resistance zones established during peak liquidity periods.
This description explains what the indicator does, its practical applications, and its key features in a way that's clear for TradingView users.RetryClaude can make mistakes. Please double-check responses.

Session Highs and LowsThis indicator highlights the New York, London, and Asian trading sessions — plotting each session’s highs and lows directly on your chart to help visualize intraday ranges and liquidity levels.
⸻
✨ Features
• Session Range Visualization
Automatically marks the high and low of each trading session with colored lines.
This makes it easy to identify where price expanded, consolidated, or built liquidity during each market phase.
• Session Background Zones (Optional)
Toggle background fills to highlight active sessions for clearer visual separation of NY, London, and Asian trading hours.
• Customizable Settings
• Enable or disable each session independently
• Adjust session times and colors
• Choose whether to fill session backgrounds
• Timezone Aware
All sessions are aligned to New York time by default, ensuring consistent mapping across instruments.
⸻
🎯 Use Case
A perfect tool for traders who track session-based liquidity, breaks of structure, or session-to-session continuity.
Quickly spot the Asian range, London expansion, and New York reversal windows — key components in intraday strategy development.
⸻
⚙️ Inputs
• Toggle sessions: NY / London / Asian
• Background fill on/off
• Label color customization
• Adjustable session times
⸻
📈 Why Use It
Understanding where each session establishes its range high and low provides critical context for liquidity grabs, session overlaps, and structural shifts throughout the day.
This simple yet powerful visual map enhances precision for ICT-style, smart money, or price action-based trading models.
