LANZ Strategy 1.0 [Backtest]🔷 LANZ Strategy 1.0 — Time-Based Session Trading with Smart Reversal Logic and Risk-Controlled Limit Orders
This backtest version of LANZ Strategy 1.0 brings precision to session-based trading by using directional confirmation, pre-defined risk parameters, and limit orders that execute overnight. Designed for the 1-hour timeframe, it allows traders to evaluate the system with configurable SL, TP, and risk settings in a fully automated environment.
🧠 Core Strategy Logic:
1. Directional Confirmation at 18:00 NY:
At 18:00 NY, the system compares the 08:00 open vs the 18:00 close:
If the direction matches the previous day, the signal is reversed.
If the direction differs, the current day's trend is kept.
This logic is designed to avoid momentum exhaustion and capture corrective reversals.
2. Entry Level Definition:
Based on the confirmed direction:
For BUY, the Low of the day is used as Entry Point (EP).
For SELL, the High of the day becomes EP.
The system plots a Stop Loss and Take Profit based on user-defined pip inputs (default: SL = 18 pips, TP = 54 pips → RR 1:3).
3. Time-Limited Entry Execution (LIMIT Orders):
Orders are sent after 18:00 NY and can be triggered anytime between 18:00 and 08:00 NY.
If EP is not touched before 08:00, the order is automatically cancelled.
4. Manual Close Feature:
If the trade is still open at the configured hour (default 09:00 NY), the system closes all positions, simulating realistic intraday exit scenarios.
5. Lot Size Calculation Based on Risk:
Lot size is dynamically calculated using the account size, risk percentage, and SL distance.
This ensures consistent risk exposure regardless of market volatility.
⚙️ Step-by-Step Flow:
08:00 NY → Captures the open of the day.
18:00 NY → Confirms direction and defines EP, SL, and TP.
After 18:00 NY → If conditions are met, a LIMIT order is placed at EP.
Between 18:00–08:00 NY → If price touches EP, the trade is executed.
At 08:00 NY → If EP wasn’t touched, the order is cancelled.
At Configured Manual Close Time (default 09:00 NY) → All open positions are force-closed if still active.
🧪 Backtest Settings:
Timeframe: 1-hour only
Order Type: strategy.entry() with limit=
SL/TP Configurable: Yes, in pips
Risk Input: % of capital per trade
Manual Close Time: Fully adjustable (default 09:00 NY)
👨💻 Credits:
Developed by LANZ
Strategy logic and trading concept built with clarity and precision.
Code structure and documentation by Kairos, your AI trading assistant.
Designed for high-confidence execution and clean backtesting performance.
Cari dalam skrip untuk "session"

DVPOOverview
The DVPO (Dynamic Volume Profile Oscillator) Strategy is a comprehensive and highly customizable trading tool designed for precision and control. It is built around a unique, volume-driven oscillator that identifies potential market entries by analyzing the relationship between price, volume, and volatility.
This strategy is not just another signal generator; it's a complete framework that includes dynamic entry logic, adaptive risk management (ATR Stop Loss and R:R-based Take Profit), and a powerful dashboard of 10+ optional confirmation filters to help you tailor the strategy to your specific instrument, timeframe, and trading style.
The Core Concept: The DVPO Oscillator
The heart of this strategy is the DVPO oscillator. Unlike standard oscillators like RSI or Stochastics, the DVPO's primary goal is to quantify how far the current price has deviated from its recent volume-weighted "fair value."
Here’s how it works conceptually:
Micro Volume Profile: The indicator first analyzes a recent period of bars (defined by Lookback Period) to build a mini-profile of price and volume.
Volume-Weighted Mean: From this profile, it calculates a volume-weighted average price (VWAP) and the average deviation from that mean. This establishes the central point of value for the recent period.
Deviation Measurement: The oscillator's value is derived from how far the current price is from this calculated mean, scaled by the observed price deviation and a user-defined Sensitivity. A value above the midline suggests the price is trading at a premium, while a value below suggests it's at a discount.
Adaptive Volatility Zones: Instead of using fixed overbought/oversold levels (e.g., 70/30), the DVPO calculates dynamic upper and lower zones using the standard deviation of the oscillator itself. These zones expand and contract based on recent market volatility.
An entry signal is triggered not just when the oscillator is "overbought" or "oversold," but when it breaks out of these adaptive volatility zones, signaling that a statistically significant price movement is underway.
📈 Long Entry Condition : The oscillator crosses above the dynamic upper zone.
📉 Short Entry Condition : The oscillator crosses below the dynamic lower zone.
Integrated Risk & Trade Management
A signal is useless without proper risk management. This strategy has professional-grade risk management built directly into its logic.
Stop Loss (ATR-Based): The Stop Loss is not a fixed percentage. It is calculated using the Average True Range (ATR), allowing it to adapt automatically to the market's current volatility. In volatile periods, the stop will be wider; in quiet periods, it will be tighter.
Take Profit (Risk/Reward Ratio): The Take Profit level is calculated based on a user-defined Risk/Reward Ratio. If you set a ratio of 2.0, the Take Profit target will be placed at twice the distance of the Stop Loss from your entry price.
Dynamic Position Sizing: The strategy can automatically calculate the trade quantity for you. It determines the position size based on your specified Capital Size and the % Risk Per Trade you are willing to accept, ensuring disciplined risk control on every trade.
The Filter Dashboard : Enhance Your Signal Quality
To help reduce false signals and adapt to different market conditions, the strategy includes a comprehensive dashboard of optional confirmation filters. An entry signal will only be executed if it aligns with all the filters you have activated.
Trend & Momentum Filters :
T3, VMA, & VWAP Trend Filters: Utilize a suite of advanced moving averages (T3, Variable Moving Average, and a session-based VWAP) to ensure your trades are aligned with the dominant trend.
ADX Filter: Confirms that the market has sufficient directional strength for a trend-following trade, helping to avoid entries during choppy conditions.
Kaufman Efficiency Filter: Uses the Kaufman Efficiency Ratio to measure market noise. It only allows trades when the market is trending efficiently.
Volume & Market State Filters :
Volume Flow (VFI): A sophisticated volume-based filter that confirms whether volume is supporting the price move.
TDFI (Trader's Dynamic Index): A market state indicator designed to identify when the market is primed for a strong, directional move.
Flat Market Detector: A unique filter that identifies and avoids trading in sideways or ranging markets where trend strategies typically underperform.
Trade Condition Filters :
Min TP / Max SL %: Filter out trades where the risk/reward profile doesn't meet your minimum requirements (e.g., ignore a trade if the ATR-based stop loss is more than 10% away from the price).
Session Filters: Allows you to enable or disable trading on specific days of the week and to set a Cooldown Period (a set number of bars to wait after a trade closes before looking for a new entry).
How To Use This Strategy
Start with the Core: Begin by configuring the DVPO Oscillator settings (Lookback Period, Sensitivity, Zone Width) and your Risk Management parameters (ATR Multiplier, RR Ratio, % Risk Per Trade). These form the foundation of the strategy.
Backtest and Observe: Use TradingView's Strategy Tester to see how the core signals perform on your chosen asset and timeframe.
Layer Filters Intelligently: Enable the confirmation filters one by one and re-run your backtest. Observe how each filter impacts performance (e.g., does the T3 filter increase profitability but reduce the number of trades?). The goal is to find the optimal balance between signal quality and frequency.
Visualize and Analyze: Use the Show Risk/Reward Area option to plot your entry, stop loss, and take profit levels directly on the chart for every trade, providing a clear visual representation of your trade plan.
Disclaimer: This strategy is provided for educational and analytical purposes only. Past performance is not indicative of future results. All trading involves risk, and you should conduct your own thorough backtesting and analysis before deploying any strategy in a live market.

Three Candle Bullish Engulfing StrategyThe Three Candle Bullish Engulfing Strategy is a versatile, multi-mode trading system designed for TradingView, combining classic candlestick patterns with momentum confirmation and dynamic risk management. This script supports both swing trading and intraday approaches, as well as an optional RSI-based breakout mode for additional signal filtering.
Key Features:
Three Candle Pattern Detection:
The strategy identifies potential trend reversal points using a three-candle pattern:
The first candle is a strong bullish (or bearish) move.
The second candle is a doji or small-bodied candle, indicating indecision.
The third candle is a bullish (or bearish) engulfing candle that closes above (or below) the previous high (or low), confirming the reversal.
Flexible Trading Modes:
Swing Long Only: Enter long trades on bullish three-candle setups.
Intraday Long & Short: Trade both long and short based on bullish and bearish three-candle patterns, with automatic session-end exits.
RSI Breakout Mode: Enter long trades when the 1-hour RSI exceeds a user-defined threshold (default 80) and a bullish candle forms, with breakout confirmation and a fixed-percentage stop loss.
Visual Aids:
Plots the RSI breakout trigger price and stop loss on the chart for easy monitoring.
How It Works:
Three Candle Pattern Entries:
Long Entry: Triggered when a bullish candle is followed by a doji, then a bullish engulfing candle closes above the previous high.
Short Entry (Intraday only): Triggered by the inverse pattern—bearish candle, doji, then bearish engulfing candle closing below the previous low.
RSI Breakout Entries:
When the RSI on a higher timeframe (default 1 hour) exceeds the set threshold and a bullish candle forms, the script records a trigger price.
A long trade is entered if the price breaks above this trigger, with a stop loss set a fixed percentage below.
Exits:
Positions are closed if the trailing stop is hit, the session ends (for intraday mode), or the stop loss is triggered in RSI breakout mode.
In RSI breakout mode, positions are also closed if a new breakout trigger forms while in position.

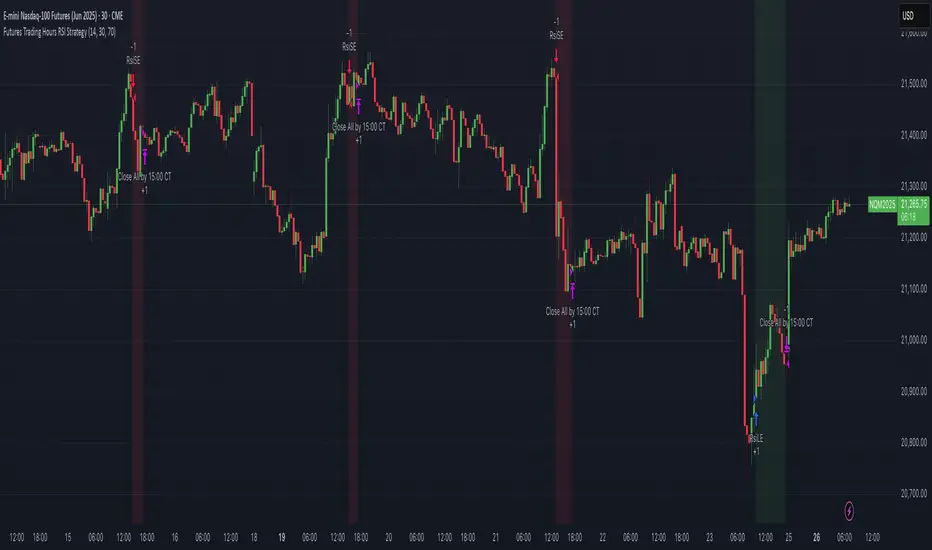
Futures Trading Hours RSI StrategyFutures Trading Hours RSI Strategy
A lightweight, session-filtered RSI strategy designed for equity-index futures (e.g. NQ, ES, YM) on a 30-minute chart. It dynamically enters long when RSI crosses above your oversold threshold and short when RSI crosses below your overbought threshold—but only during regular U.S. trading hours (08:30–15:00 CT, Monday–Friday). All positions are set to close at 15:00 CT to avoid overnight risk, and optional background shading highlights your open longs (green) and shorts (red).
⸻
Key Features
• RSI-based entries: configurable length, oversold, and overbought levels
• Session filter: trades only between 08:30–15:00 CT, Monday through Friday
• Automatic exit: closes all positions at or after 15:00 CT each day
• Visual cues: optional background shading for open long/short positions
• Easy customization: adjust length, overSold, overBought, and time offsets
Backtest Performance (NQ Jun 2025, 30 min)
• Total P&L: +$10,230 (+1.02%)
• Profit Factor: 4.61
• Win Rate: 57.1% (4 wins / 7 trades)
• Max Drawdown: $2,215 (0.22%)
(Results shown are for illustrative purposes only; past performance does not guarantee future returns.)
How to Use
1. Add this script to your 30-minute futures chart.
2. Tweak the RSI parameters and time-zone offset to suit your instrument.
3. Enable “background shading” if you’d like a visual reminder of open positions.
4. Run in paper-trade mode to validate performance before going live.
⸻
⚠️ Disclaimer: Trading carries risk. Always backtest and paper-trade before using real capital. Adjust position sizing and risk controls to your own tolerance.
Dskyz (DAFE) GENESIS Dskyz (DAFE) GENESIS: Adaptive Quant, Real Regime Power
Let’s be honest: Most published strategies on TradingView look nearly identical—copy-paste “open-source quant,” generic “adaptive” buzzwords, the same shallow explanations. I’ve even fallen into this trap with my own previously posted strategies. Not this time.
What Makes This Unique
GENESIS is not a black-box mashup or a pre-built template. It’s the culmination of DAFE’s own adaptive, multi-factor, regime-aware quant engine—built to outperform, survive, and visualize live edge in anything from NQ/MNQ to stocks and crypto.
True multi-factor core: Volume/price imbalances, trend shifts, volatility compression/expansion, and RSI all interlock for signal creation.
Adaptive regime logic: Trades only in healthy, actionable conditions—no “one-size-fits-all” signals.
Momentum normalization: Uses rolling, percentile-based fast/slow EMA differentials, ALWAYS normalized, ALWAYS relevant—no “is it working?” ambiguity.
Position sizing that adapts: Not fixed-lot, not naive—not a loophole for revenge trading.
No hidden DCA or pyramiding—what you see is what you trade.
Dashboard and visual system: Directly connected to internal logic. If it’s shown, it’s used—and nothing cosmetic is presented on your chart that isn’t quantifiable.
📊 Inputs and What They Mean (Read Carefully)
Maximum Raw Score: How many distinct factors can contribute to regime/trade confidence (default 4). If you extend the quant logic, increase this.
RSI Length / Min RSI for Shorts / Max RSI for Longs: Fine-tunes how “overbought/oversold” matters; increase the length for smoother swings, tighten floors/ceilings for more extreme signals.
⚡ Regime & Momentum Gates
Min Normed Momentum/Score (Conf): Raise to demand only the strongest trends—your filter to avoid algorithmic chop.
🕒 Volatility & Session
ATR Lookback, ATR Low/High Percentile: These control your system’s awareness of when the market is dead or ultra-volatile. All sizing and filter logic adapts in real time.
Trading Session (hours): Easy filter for when entries are allowed; default is regular trading hours—no surprise overnight fills.
📊 Sizing & Risk
Max Dollar Risk / Base-Max Contracts: All sizing is adaptive, based on live regime and volatility state—never static or “just 1 contract.” Control your max exposures and real $ risk. ATR will effect losses in high volatility times.
🔄 Exits & Scaling
Stop/Trail/Scale multipliers: You choose how dynamic/flexible risk controls and profit-taking need to be. ATR-based, so everything auto-adjusts to the current market mode.
Visuals That Actually Matter
Dashboard (Top Right): Shows only live, relevant stats: scoring, status, position size, win %, win streak, total wins—all from actual trade engine state (not “simulated”).
Watermark (Bottom Right): Momentum bar visual is always-on, regime-aware, reflecting live regime confidence and momentum normalization. If the bar is empty, you’re truly in no-momentum. If it glows lime, you’re riding the strongest possible edge.
*No cosmetics, no hidden code distractions.
Backtest Settings
Initial capital: $10,000
Commission: Conservative, realistic roundtrip cost:
15–20 per contract (including slippage per side) I set this to $25
Slippage: 3 ticks per trade
Symbol: CME_MINI:NQ1!
Timeframe: 1 min (but works on all timeframes)
Order size: Adaptive, 1–3 contracts
No pyramiding, no hidden DCA
Why these settings?
These settings are intentionally strict and realistic, reflecting the true costs and risks of live trading. The 10,000 account size is accessible for most retail traders. 25/contract including 3 ticks of slippage are on the high side for NQ, ensuring the strategy is not curve-fit to perfect fills. If it works here, it will work in real conditions.
Why It Wins
While others put out “AI-powered” strategies with little logic or soul, GENESIS is ruthlessly practical. It is built around what keeps traders alive:
- Context-aware signals, not just patterns
- Tight, transparent risk
- Inputs that adapt, not confuse
- Visuals that clarify, not distract
- Code that runs clean, efficient, and with minimal overfitting risk (try it on QQQ, AMD, SOL, etc. out of the box)
Disclaimer (for TradingView compliance):
Trading is risky. Futures, stocks, and crypto can result in significant losses. Do not trade with funds you cannot afford to lose. This is for educational and informational purposes only. Use in simulation/backtest mode before live trading. No past performance is indicative of future results. Always understand your risk and ownership of your trades.
This will not be my last—my goal is to keep raising the bar until DAFE is a brand or I’m forced to take this private.
Use with discipline, use with clarity, and always trade smarter.
— Dskyz , powered by DAFE Trading Systems.

NYBREAKOUT by FliuxStrategy Concept
This strategy captures high-probability breakout moves by defining a tight 30-minute range during low-volatility hours and trading the first clear break beyond that range with a 2:1 reward-to-risk ratio.
Key Benefits
Simplicity: Clear, time-based range and mechanical entries/exits.
Defined R:R: Automatic 2:1 target ensures consistent risk management.
Time-filtered: Trades only the initial breakout of a calm, pre-session range.
How to Use
Add to Chart: Paste the Pine Script into TradingView’s Pine Editor, then click Add to Chart.
Backtest: Open Strategy Tester to review net profit, drawdown, win rate, and profit factor.
Optimize: Adjust stop-loss offset, R:R ratio, or session window parameters to suit different instruments or volatility regimes.

Dskyz (DAFE) Adaptive Regime - Quant Machine ProDskyz (DAFE) Adaptive Regime - Quant Machine Pro:
Buckle up for the Dskyz (DAFE) Adaptive Regime - Quant Machine Pro, is a strategy that’s your ultimate edge for conquering futures markets like ES, MES, NQ, and MNQ. This isn’t just another script—it’s a quant-grade powerhouse, crafted with precision to adapt to market regimes, deliver multi-factor signals, and protect your capital with futures-tuned risk management. With its shimmering DAFE visuals, dual dashboards, and glowing watermark, it turns your charts into a cyberpunk command center, making trading as thrilling as it is profitable.
Unlike generic scripts clogging up the space, the Adaptive Regime is a DAFE original, built from the ground up to tackle the chaos of futures trading. It identifies market regimes (Trending, Range, Volatile, Quiet) using ADX, Bollinger Bands, and HTF indicators, then fires trades based on a weighted scoring system that blends candlestick patterns, RSI, MACD, and more. Add in dynamic stops, trailing exits, and a 5% drawdown circuit breaker, and you’ve got a system that’s as safe as it is aggressive. Whether you’re a newbie or a prop desk pro, this strat’s your ticket to outsmarting the markets. Let’s break down every detail and see why it’s a must-have.
Why Traders Need This Strategy
Futures markets are a gauntlet—fast moves, volatility spikes (like the April 28, 2025 NQ 1k-point drop), and institutional traps that punish the unprepared. Meanwhile, platforms are flooded with low-effort scripts that recycle old ideas with zero innovation. The Adaptive Regime stands tall, offering:
Adaptive Intelligence: Detects market regimes (Trending, Range, Volatile, Quiet) to optimize signals, unlike one-size-fits-all scripts.
Multi-Factor Precision: Combines candlestick patterns, MA trends, RSI, MACD, volume, and HTF confirmation for high-probability trades.
Futures-Optimized Risk: Calculates position sizes based on $ risk (default: $300), with ATR or fixed stops/TPs tailored for ES/MES.
Bulletproof Safety: 5% daily drawdown circuit breaker and trailing stops keep your account intact, even in chaos.
DAFE Visual Mastery: Pulsing Bollinger Band fills, dynamic SL/TP lines, and dual dashboards (metrics + position) make signals crystal-clear and charts a work of art.
Original Craftsmanship: A DAFE creation, built with community passion, not a rehashed clone of generic code.
Traders need this because it’s a complete, adaptive system that blends quant smarts, user-friendly design, and DAFE flair. It’s your edge to trade with confidence, cut through market noise, and leave the copycats in the dust.
Strategy Components
1. Market Regime Detection
The strategy’s brain is its ability to classify market conditions into five regimes, ensuring signals match the environment.
How It Works:
Trending (Regime 1): ADX > 20, fast/slow EMA spread > 0.3x ATR, HTF RSI > 50 or MACD bullish (htf_trend_bull/bear).
Range (Regime 2): ADX < 25, price range < 3% of close, no HTF trend.
Volatile (Regime 3): BB width > 1.5x avg, ATR > 1.2x avg, HTF RSI overbought/oversold.
Quiet (Regime 4): BB width < 0.8x avg, ATR < 0.9x avg.
Other (Regime 5): Default for unclear conditions.
Indicators: ADX (14), BB width (20), ATR (14, 50-bar SMA), HTF RSI (14, daily default), HTF MACD (12,26,9).
Why It’s Brilliant:
Regime detection adapts signals to market context, boosting win rates in trending or volatile conditions.
HTF RSI/MACD add a big-picture filter, rare in basic scripts.
Visualized via gradient background (green for Trending, orange for Range, red for Volatile, gray for Quiet, navy for Other).
2. Multi-Factor Signal Scoring
Entries are driven by a weighted scoring system that combines candlestick patterns, trend, momentum, and volume for robust signals.
Candlestick Patterns:
Bullish: Engulfing (0.5), hammer (0.4 in Range, 0.2 else), morning star (0.2), piercing (0.2), double bottom (0.3 in Volatile, 0.15 else). Must be near support (low ≤ 1.01x 20-bar low) with volume spike (>1.5x 20-bar avg).
Bearish: Engulfing (0.5), shooting star (0.4 in Range, 0.2 else), evening star (0.2), dark cloud (0.2), double top (0.3 in Volatile, 0.15 else). Must be near resistance (high ≥ 0.99x 20-bar high) with volume spike.
Logic: Patterns are weighted higher in specific regimes (e.g., hammer in Range, double bottom in Volatile).
Additional Factors:
Trend: Fast EMA (20) > slow EMA (50) + 0.5x ATR (trend_bull, +0.2); opposite for trend_bear.
RSI: RSI (14) < 30 (rsi_bull, +0.15); > 70 (rsi_bear, +0.15).
MACD: MACD line > signal (12,26,9, macd_bull, +0.15); opposite for macd_bear.
Volume: ATR > 1.2x 50-bar avg (vol_expansion, +0.1).
HTF Confirmation: HTF RSI < 70 and MACD bullish (htf_bull_confirm, +0.2); RSI > 30 and MACD bearish (htf_bear_confirm, +0.2).
Scoring:
bull_score = sum of bullish factors; bear_score = sum of bearish. Entry requires score ≥ 1.0.
Example: Bullish engulfing (0.5) + trend_bull (0.2) + rsi_bull (0.15) + htf_bull_confirm (0.2) = 1.05, triggers long.
Why It’s Brilliant:
Multi-factor scoring ensures signals are confirmed by multiple market dynamics, reducing false positives.
Regime-specific weights make patterns more relevant (e.g., hammers shine in Range markets).
HTF confirmation aligns with the big picture, a quant edge over simplistic scripts.
3. Futures-Tuned Risk Management
The risk system is built for futures, calculating position sizes based on $ risk and offering flexible stops/TPs.
Position Sizing:
Logic: Risk per trade (default: $300) ÷ (stop distance in points * point value) = contracts, capped at max_contracts (default: 5). Point value = tick value (e.g., $12.5 for ES) * ticks per point (4) * contract multiplier (1 for ES, 0.1 for MES).
Example: $300 risk, 8-point stop, ES ($50/point) → 0.75 contracts, rounded to 1.
Impact: Precise sizing prevents over-leverage, critical for micro contracts like MES.
Stops and Take-Profits:
Fixed: Default stop = 8 points, TP = 16 points (2:1 reward/risk).
ATR-Based: Stop = 1.5x ATR (default), TP = 3x ATR, enabled via use_atr_for_stops.
Logic: Stops set at swing low/high ± stop distance; TPs at 2x stop distance from entry.
Impact: ATR stops adapt to volatility, while fixed stops suit stable markets.
Trailing Stops:
Logic: Activates at 50% of TP distance. Trails at close ± 1.5x ATR (atr_multiplier). Longs: max(trail_stop_long, close - ATR * 1.5); shorts: min(trail_stop_short, close + ATR * 1.5).
Impact: Locks in profits during trends, a game-changer in volatile sessions.
Circuit Breaker:
Logic: Pauses trading if daily drawdown > 5% (daily_drawdown = (max_equity - equity) / max_equity).
Impact: Protects capital during black swan events (e.g., April 27, 2025 ES slippage).
Why It’s Brilliant:
Futures-specific inputs (tick value, multiplier) make it plug-and-play for ES/MES.
Trailing stops and circuit breaker add pro-level safety, rare in off-the-shelf scripts.
Flexible stops (ATR or fixed) suit different trading styles.
4. Trade Entry and Exit Logic
Entries and exits are precise, driven by bull_score/bear_score and protected by drawdown checks.
Entry Conditions:
Long: bull_score ≥ 1.0, no position (position_size <= 0), drawdown < 5% (not pause_trading). Calculates contracts, sets stop at swing low - stop points, TP at 2x stop distance.
Short: bear_score ≥ 1.0, position_size >= 0, drawdown < 5%. Stop at swing high + stop points, TP at 2x stop distance.
Logic: Tracks entry_regime for PNL arrays. Closes opposite positions before entering.
Exit Conditions:
Stop-Loss/Take-Profit: Hits stop or TP (strategy.exit).
Trailing Stop: Activates at 50% TP, trails by ATR * 1.5.
Emergency Exit: Closes if price breaches stop (close < long_stop_price or close > short_stop_price).
Reset: Clears stop/TP prices when flat (position_size = 0).
Why It’s Brilliant:
Score-based entries ensure multi-factor confirmation, filtering out weak signals.
Trailing stops maximize profits in trends, unlike static exits in basic scripts.
Emergency exits add an extra safety layer, critical for futures volatility.
5. DAFE Visuals
The visuals are pure DAFE magic, blending function with cyberpunk flair to make signals intuitive and charts stunning.
Shimmering Bollinger Band Fill:
Display: BB basis (20, white), upper/lower (green/red, 45% transparent). Fill pulses (30–50 alpha) by regime, with glow (60–95 alpha) near bands (close ≥ 0.995x upper or ≤ 1.005x lower).
Purpose: Highlights volatility and key levels with a futuristic glow.
Visuals make complex regimes and signals instantly clear, even for newbies.
Pulsing effects and regime-specific colors add a DAFE signature, setting it apart from generic scripts.
BB glow emphasizes tradeable levels, enhancing decision-making.
Chart Background (Regime Heatmap):
Green — Trending Market: Strong, sustained price movement in one direction. The market is in a trend phase—momentum follows through.
Orange — Range-Bound: Market is consolidating or moving sideways, with no clear up/down trend. Great for mean reversion setups.
Red — Volatile Regime: High volatility, heightened risk, and larger/faster price swings—trade with caution.
Gray — Quiet/Low Volatility: Market is calm and inactive, with small moves—often poor conditions for most strategies.
Navy — Other/Neutral: Regime is uncertain or mixed; signals may be less reliable.
Bollinger Bands Glow (Dynamic Fill):
Neon Red Glow — Warning!: Price is near or breaking above the upper band; momentum is overstretched, watch for overbought conditions or reversals.
Bright Green Glow — Opportunity!: Price is near or breaking below the lower band; market could be oversold, prime for bounce or reversal.
Trend Green Fill — Trending Regime: Fills between bands with green when the market is trending, showing clear momentum.
Gold/Yellow Fill — Range Regime: Fills with gold/aqua in range conditions, showing the market is sideways/oscillating.
Magenta/Red Fill — Volatility Spike: Fills with vivid magenta/red during highly volatile regimes.
Blue Fill — Neutral/Quiet: A soft blue glow for other or uncertain market states.
Moving Averages:
Display: Blue fast EMA (20), red slow EMA (50), 2px.
Purpose: Shows trend direction, with trend_dir requiring ATR-scaled spread.
Dynamic SL/TP Lines:
Display: Pulsing colors (red SL, green TP for Trending; yellow/orange for Range, etc.), 3px, with pulse_alpha for shimmer.
Purpose: Tracks stops/TPs in real-time, color-coded by regime.
6. Dual Dashboards
Two dashboards deliver real-time insights, making the strat a quant command center.
Bottom-Left Metrics Dashboard (2x13):
Metrics: Mode (Active/Paused), trend (Bullish/Bearish/Neutral), ATR, ATR avg, volume spike (YES/NO), RSI (value + Oversold/Overbought/Neutral), HTF RSI, HTF trend, last signal (Buy/Sell/None), regime, bull score.
Display: Black (29% transparent), purple title, color-coded (green for bullish, red for bearish).
Purpose: Consolidates market context and signal strength.
Top-Right Position Dashboard (2x7):
Metrics: Regime, position side (Long/Short/None), position PNL ($), SL, TP, daily PNL ($).
Display: Black (29% transparent), purple title, color-coded (lime for Long, red for Short).
Purpose: Tracks live trades and profitability.
Why It’s Brilliant:
Dual dashboards cover market context and trade status, a rare feature.
Color-coding and concise metrics guide beginners (e.g., green “Buy” = go).
Real-time PNL and SL/TP visibility empower disciplined trading.
7. Performance Tracking
Logic: Arrays (regime_pnl_long/short, regime_win/loss_long/short) track PNL and win/loss by regime (1–5). Updated on trade close (barstate.isconfirmed).
Purpose: Prepares for future adaptive thresholds (e.g., adjust bull_score min based on regime performance).
Why It’s Brilliant: Lays the groundwork for self-optimizing logic, a quant edge over static scripts.
Key Features
Regime-Adaptive: Optimizes signals for Trending, Range, Volatile, Quiet markets.
Futures-Optimized: Precise sizing for ES/MES with tick-based risk inputs.
Multi-Factor Signals: Candlestick patterns, RSI, MACD, and HTF confirmation for robust entries.
Dynamic Exits: ATR/fixed stops, 2:1 TPs, and trailing stops maximize profits.
Safe and Smart: 5% drawdown breaker and emergency exits protect capital.
DAFE Visuals: Shimmering BB fill, pulsing SL/TP, and dual dashboards.
Backtest-Ready: Fixed qty and tick calc for accurate historical testing.
How to Use
Add to Chart: Load on a 5min ES/MES chart in TradingView.
Configure Inputs: Set instrument (ES/MES), tick value ($12.5/$1.25), multiplier (1/0.1), risk ($300 default). Enable ATR stops for volatility.
Monitor Dashboards: Bottom-left for regime/signals, top-right for position/PNL.
Backtest: Run in strategy tester to compare regimes.
Live Trade: Connect to Tradovate or similar. Watch for slippage (e.g., April 27, 2025 ES issues).
Replay Test: Try April 28, 2025 NQ drop to see regime shifts and stops.
Disclaimer
Trading futures involves significant risk of loss and is not suitable for all investors. Past performance does not guarantee future results. Backtest results may differ from live trading due to slippage, fees, or market conditions. Use this strategy at your own risk, and consult a financial advisor before trading. Dskyz (DAFE) Trading Systems is not responsible for any losses incurred.
Backtesting:
Frame: 2023-09-20 - 2025-04-29
Slippage: 3
Fee Typical Range (per side, per contract)
CME Exchange $1.14 – $1.20
Clearing $0.10 – $0.30
NFA Regulatory $0.02
Firm/Broker Commis. $0.25 – $0.80 (retail prop)
TOTAL $1.60 – $2.30 per side
Round Turn: (enter+exit) = $3.20 – $4.60 per contract
Final Notes
The Dskyz (DAFE) Adaptive Regime - Quant Machine Pro is more than a strategy—it’s a revolution. Crafted with DAFE’s signature precision, it rises above generic scripts with adaptive regimes, quant-grade signals, and visuals that make trading a thrill. Whether you’re scalping MES or swinging ES, this system empowers you to navigate markets with confidence and style. Join the DAFE crew, light up your charts, and let’s dominate the futures game!
(This publishing will most likely be taken down do to some miscellaneous rule about properly displaying charting symbols, or whatever. Once I've identified what part of the publishing they want to pick on, I'll adjust and repost.)
Use it with discipline. Use it with clarity. Trade smarter.
**I will continue to release incredible strategies and indicators until I turn this into a brand or until someone offers me a contract.
Created by Dskyz, powered by DAFE Trading Systems. Trade smart, trade bold.

Breadth-Driven Swing StrategyWhat it does
This script trades the S&P 500 purely on market breadth extremes:
• Data source : INDEX:S5TH = % of S&P 500 stocks above their own 200-day SMA (range 0–100).
• Buy when breadth is washed-out.
• Sell when breadth is overheated.
It is long-only by design; shorting and ATR trailing stops have been removed to keep the logic minimal and transparent.
⸻
Signals in plain English
1. Long entry
A. A 200-EMA trough in breadth is printed and the trough value is ≤ 40 %.
or
B. A 5-EMA trough appears, its prominence passes the user threshold, and the lowest breadth reading in the last 20 bars is ≤ 20 %.
(Toggle this secondary trigger on/off with “ Enter also on 5-EMA trough ”.)
2. Exit (close long)
First 200-EMA peak whose breadth value is ≥ 70 %.
3. Risk control
A fixed stop-loss (% of entry price, default 8 %) is attached to every long trade.
⸻
Key parameters (defaults shown)
• Long EMA length 200 • Short EMA length 5
• Peak prominence 0.5 pct-pts • Trough prominence 3 pct-pts
• Peak level 70 % • Trough level 40 % • 5-EMA trough level 20 %
• Fixed stop-loss 8 %
• “Enter also on 5-EMA trough” = true (allows additional entries on extreme momentum reversals)
Feel free to tighten or relax any of these thresholds to match your risk profile or account for different market regimes.
⸻
How to use it
1. Load the script on a daily SPX / SPY chart.
(The price chart drives order execution; the breadth series is pulled internally and does not need to be on the chart.)
2. Verify the breadth feed.
INDEX:S5TH is updated after each session; your broker must provide it.
3. Back-test across several cycles.
Two decades of daily data is recommended to see how the rules behave in bear markets, range markets, and bull trends.
4. Adjust position sizing in the Properties tab.
The default is “100 % of equity”; change it if you prefer smaller allocations or pyramiding caps.
⸻
Why it can help
• Breadth signals often lead price, allowing entries before index-level momentum turns.
• Simple, rule-based exits prevent “waiting for confirmation” paralysis.
• Only one input series—easy to audit, no black-box math.
Trade-offs
• Relies on a single breadth metric; other internals (advance/decline, equal-weight returns, etc.) are ignored.
• May sit in cash during shallow pullbacks that never push breadth ≤ 40 %.
• Signals arrive at the end of the session (breadth is EoD data).
⸻
Disclaimer
This script is provided for educational purposes only and is not financial advice. Markets are risky; test thoroughly and use your own judgment before trading real money.
ストラテジー概要
本スクリプトは S&P500 のマーケットブレッド(内部需給) だけを手がかりに、指数をスイングトレードします。
• ブレッドデータ : INDEX:S5TH
(S&P500 採用銘柄のうち、それぞれの 200 日移動平均線を上回っている銘柄比率。0–100 %)
• 買い : ブレッドが極端に売られたタイミング。
• 売り : ブレッドが過熱状態に達したタイミング。
余計な機能を削り、ロングオンリー & 固定ストップ のシンプル設計にしています。
⸻
シグナルの流れ
1. ロングエントリー
• 条件 A : 200-EMA がトラフを付け、その値が 40 % 以下
• 条件 B : 5-EMA がトラフを付け、
・プロミネンス条件を満たし
・直近 20 本のブレッドス最小値が 20 % 以下
• B 条件は「5-EMA トラフでもエントリー」を ON にすると有効
2. ロング決済
最初に出現した 200-EMA ピーク で、かつ値が 70 % 以上 のバーで手仕舞い。
3. リスク管理
各トレードに 固定ストップ(初期価格から 8 %)を設定。
⸻
主なパラメータ(デフォルト値)
• 長期 EMA 長さ : 200 • 短期 EMA 長さ : 5
• ピーク判定プロミネンス : 0.5 %pt • トラフ判定プロミネンス : 3 %pt
• ピーク水準 : 70 % • トラフ水準 : 40 % • 5-EMA トラフ水準 : 20 %
• 固定ストップ : 8 %
• 「5-EMA トラフでもエントリー」 : ON
相場環境やリスク許容度に合わせて閾値を調整してください。
⸻
使い方
1. 日足の SPX / SPY チャート にスクリプトを適用。
2. ブレッドデータの供給 (INDEX:S5TH) がブローカーで利用可能か確認。
3. 20 年以上の期間でバックテスト し、強気相場・弱気相場・レンジ局面での挙動を確認。
4. 資金配分 は プロパティ → 戦略実行 で調整可能(初期値は「資金の 100 %」)。
⸻
強み
• ブレッドは 価格より先行 することが多く、天底を早期に捉えやすい。
• ルールベースの出口で「もう少し待とう」と迷わずに済む。
• 入力 series は 1 本のみ、ブラックボックス要素なし。
注意点・弱み
• 単一指標に依存。他の内部需給(A/D ライン等)は考慮しない。
• 40 % を割らない浅い押し目では機会損失が起こる。
• ブレッドは終値ベースの更新。ザラ場中の変化は捉えられない。
⸻
免責事項
本スクリプトは 学習目的 で提供しています。投資助言ではありません。
実取引の前に必ず自己責任で十分な検証とリスク管理を行ってください。

Dskyz (DAFE) MAtrix with ATR-Powered Precision Dskyz (DAFE) MAtrix with ATR-Powered Precision
This cutting‐edge futures trading strategy built to thrive in rapidly changing market conditions. Developed for high-frequency futures trading on instruments such as the CME Mini MNQ, this strategy leverages a matrix of sophisticated moving averages combined with ATR-based filters to pinpoint high-probability entries and exits. Its unique combination of adaptable technical indicators and multi-timeframe trend filtering sets it apart from standard strategies, providing enhanced precision and dynamic responsiveness.
imgur.com
Core Functional Components
1. Advanced Moving Averages
A distinguishing feature of the DAFE strategy is its robust, multi-choice moving averages (MAs). Clients can choose from a wide array of MAs—each with specific strengths—in order to fine-tune their trading signals. The code includes user-defined functions for the following MAs:
imgur.com
Hull Moving Average (HMA):
The hma(src, len) function calculates the HMA by using weighted moving averages (WMAs) to reduce lag considerably while smoothing price data. This function computes an intermediate WMA of half the specified length, then a full-length WMA, and finally applies a further WMA over the square root of the length. This design allows for rapid adaptation to price changes without the typical delays of traditional moving averages.
Triple Exponential Moving Average (TEMA):
Implemented via tema(src, len), TEMA uses three consecutive exponential moving averages (EMAs) to effectively cancel out lag and capture price momentum. The final formula—3 * (ema1 - ema2) + ema3—produces a highly responsive indicator that filters out short-term noise.
Double Exponential Moving Average (DEMA):
Through the dema(src, len) function, DEMA calculates an EMA and then a second EMA on top of it. Its simplified formula of 2 * ema1 - ema2 provides a smoother curve than a single EMA while maintaining enhanced responsiveness.
Volume Weighted Moving Average (VWMA):
With vwma(src, len), this MA accounts for trading volume by weighting the price, thereby offering a more contextual picture of market activity. This is crucial when volume spikes indicate significant moves.
Zero Lag EMA (ZLEMA):
The zlema(src, len) function applies a correction to reduce the inherent lag found in EMAs. By subtracting a calculated lag (based on half the moving average window), ZLEMA is exceptionally attuned to recent price movements.
Arnaud Legoux Moving Average (ALMA):
The alma(src, len, offset, sigma) function introduces ALMA—a type of moving average designed to be less affected by outliers. With parameters for offset and sigma, it allows customization of the degree to which the MA reacts to market noise.
Kaufman Adaptive Moving Average (KAMA):
The custom kama(src, len) function is noteworthy for its adaptive nature. It computes an efficiency ratio by comparing price change against volatility, then dynamically adjusts its smoothing constant. This results in an MA that quickly responds during trending periods while remaining smoothed during consolidation.
Each of these functions—integrated into the strategy—is selectable by the trader (via the fastMAType and slowMAType inputs). This flexibility permits the tailored application of the MA most suited to current market dynamics and individual risk management preferences.
2. ATR-Based Filters and Risk Controls
ATR Calculation and Volatility Filter:
The strategy computes the Average True Range (ATR) over a user-defined period (atrPeriod). ATR is then used to derive both:
Volatility Assessment: Expressed as a ratio of ATR to closing price, ensuring that trades are taken only when volatility remains within a safe, predefined threshold (volatilityThreshold).
ATR-Based Entry Filters: Implemented as atrFilterLong and atrFilterShort, these conditions ensure that for long entries the price is sufficiently above the slow MA and vice versa for shorts. This acts as an additional confirmation filter.
Dynamic Exit Management:
The exit logic employs a dual approach:
Fixed Stop and Profit Target: Stops and targets are set at multiples of ATR (fixedStopMultiplier and profitTargetATRMult), helping manage risk in volatile markets.
Trailing Stop Adjustments: A trailing stop is calculated using the ATR multiplied by a user-defined offset (trailOffset), which captures additional profits as the trade moves favorably while protecting against reversals.
3. Multi-Timeframe Trend Filtering
The strategy enhances its signal reliability by leveraging a secondary, higher timeframe analysis:
15-Minute Trend Analysis:
By retrieving 15-minute moving averages (fastMA15m and slowMA15m) via request.security, the strategy determines the broader market trend. This secondary filter (enabled or disabled through useTrendFilter) ensures that entries are aligned with the prevailing market direction, thereby reducing the incidence of false signals.
4. Signal and Execution Logic
Combined MA Alignment:
The entry conditions are based primarily on the alignment of the fast and slow MAs. A long condition is triggered when the current price is above both MAs and the fast MA is above the slow MA—complemented by the ATR filter and volume conditions. The reverse applies for a short condition.
Volume and Time Window Validation:
Trades are permitted only if the current volume exceeds a minimum (minVolume) and the current hour falls within the predefined trading window (tradingStartHour to tradingEndHour). An additional volume spike check (comparing current volume to a moving average of past volumes) further filters for optimal market conditions.
Comprehensive Order Execution:
The strategy utilizes flexible order execution functions that allow pyramiding (up to 10 positions), ensuring that it can scale into positions as favorable conditions persist. The use of both market entries and automated exits (with profit targets, stop-losses, and trailing stops) ensures that risk is managed at every step.
5. Integrated Dashboard and Metrics
For transparency and real-time analysis, the strategy includes:
On-Chart Visualizations:
Both fast and slow MAs are plotted on the chart, making it easy to see the market’s technical foundation.
Dynamic Metrics Dashboard:
A built-in table displays crucial performance statistics—including current profit/loss, equity, ATR (both raw and as a percentage), and the percentage gap between the moving averages. These metrics offer immediate insight into the health and performance of the strategy.
Input Parameters: Detailed Breakdown
Every input is meticulously designed to offer granular control:
Fast & Slow Lengths:
Determine the window size for the fast and slow moving averages. Smaller values yield more sensitivity, while larger values provide a smoother, delayed response.
Fast/Slow MA Types:
Choose the type of moving average for fast and slow signals. The versatility—from basic SMA and EMA to more complex ones like HMA, TEMA, ZLEMA, ALMA, and KAMA—allows customization to fit different market scenarios.
ATR Parameters:
atrPeriod and atrMultiplier shape the volatility assessment, directly affecting entry filters and risk management through stop-loss and profit target levels.
Trend and Volume Filters:
Inputs such as useTrendFilter, minVolume, and the volume spike condition help confirm that a trade occurs in active, trending markets rather than during periods of low liquidity or market noise.
Trading Hours:
Restricting trade execution to specific hours (tradingStartHour and tradingEndHour) helps avoid illiquid or choppy markets outside of prime trading sessions.
Exit Strategies:
Parameters like trailOffset, profitTargetATRMult, and fixedStopMultiplier provide multiple layers of risk management and profit protection by tailoring how exits are generated relative to current market conditions.
Pyramiding and Fixed Trade Quantity:
The strategy supports multiple entries within a trend (up to 10 positions) and sets a predefined trade quantity (fixedQuantity) to maintain consistent exposure and risk per trade.
Dashboard Controls:
The resetDashboard input allows for on-the-fly resetting of performance metrics, keeping the strategy’s performance dashboard accurate and up-to-date.
Why This Strategy is Truly Exceptional
Multi-Faceted Adaptability:
The ability to switch seamlessly between various moving average types—each suited to particular market conditions—enables the strategy to adapt dynamically. This is a testament to the high level of coding sophistication and market insight infused within the system.
Robust Risk Management:
The integration of ATR-based stops, profit targets, and trailing stops ensures that every trade is executed with well-defined risk parameters. The system is designed to mitigate unexpected market swings while optimizing profit capture.
Comprehensive Market Filtering:
By combining moving average crossovers with volume analysis, volatility thresholds, and multi-timeframe trend filters, the strategy only enters trades under the most favorable conditions. This multi-layered filtering reduces noise and enhances signal quality.
-Final Thoughts-
The Dskyz Adaptive Futures Elite (DAFE) MAtrix with ATR-Powered Precision strategy is not just another trading algorithm—it is a multi-dimensional, fully customizable system built on advanced technical principles and sophisticated risk management techniques. Every function and input parameter has been carefully engineered to provide traders with a system that is both powerful and transparent.
For clients seeking a state-of-the-art trading solution that adapts dynamically to market conditions while maintaining strict discipline in risk management, this strategy truly stands in a class of its own.
****Please show support if you enjoyed this strategy. I'll have more coming out in the near future!!
-Dskyz
Caution
DAFE is experimental, not a profit guarantee. Futures trading risks significant losses due to leverage. Backtest, simulate, and monitor actively before live use. All trading decisions are your responsibility.

BTC Trading RobotOverview
This Pine Script strategy is designed for trading Bitcoin (BTC) by placing pending orders (BuyStop and SellStop) based on local price extremes. The script also implements a trailing stop mechanism to protect profits once a position becomes sufficiently profitable.
________________________________________
Inputs and Parameter Setup
1. Trading Profile:
o The strategy is set up specifically for BTC trading.
o The systemType input is set to 1, which means the strategy will calculate trade parameters using the BTC-specific inputs.
2. Common Trading Inputs:
o Risk Parameters: Although RiskPercent is defined, its actual use (e.g., for position sizing) isn’t implemented in this version.
o Trading Hours Filter:
SHInput and EHInput let you restrict trading to a specific hour range. If these are set (non-zero), orders will only be placed during the allowed hours.
3. BTC-Specific Inputs:
o Take Profit (TP) and Stop Loss (SL) Percentages:
TPasPctBTC and SLasPctBTC are used to determine the TP and SL levels as a percentage of the current price.
o Trailing Stop Parameters:
TSLasPctofTPBTC and TSLTgrasPctofTPBTC determine when and by how much a trailing stop is applied, again as percentages of the TP.
4. Other Parameters:
o BarsN is used to define the window (number of bars) over which the local high and low are calculated.
o OrderDistPoints acts as a buffer to prevent the entry orders from being triggered too early.
________________________________________
Trade Parameter Calculation
• Price Reference:
o The strategy uses the current closing price as the reference for calculations.
• Calculation of TP and SL Levels:
o If the systemType is set to BTC (value 1), then:
Take Profit Points (Tppoints) are calculated by multiplying the current price by TPasPctBTC.
Stop Loss Points (Slpoints) are calculated similarly using SLasPctBTC.
A buffer (OrderDistPoints) is set to half of the take profit points.
Trailing Stop Levels:
TslPoints is calculated as a fraction of the TP (using TSLTgrasPctofTPBTC).
TslTriggerPoints is similarly determined, which sets the profit level at which the trailing stop will start to activate.
________________________________________
Time Filtering
• Session Control:
o The current hour is compared against SHInput (start hour) and EHInput (end hour).
o If the current time falls outside the allowed window, the script will not place any new orders.
________________________________________
Entry Orders
• Local Price Extremes:
o The strategy calculates a local high and local low using a window of BarsN * 2 + 1 bars.
• Placing Stop Orders:
o BuyStop Order:
A long entry is triggered if the current price is less than the local high minus the order distance buffer.
The BuyStop order is set to trigger at the level of the local high.
o SellStop Order:
A short entry is triggered if the current price is greater than the local low plus the order distance buffer.
The SellStop order is set to trigger at the level of the local low.
Note: Orders are only placed if there is no current open position and if the session conditions are met.
________________________________________
Trailing Stop Logic
Once a position is open, the strategy monitors profit levels to protect gains:
• For Long Positions:
o The script calculates the profit as the difference between the current price and the average entry price.
o If this profit exceeds the TslTriggerPoints threshold, a trailing stop is applied by placing an exit order.
o The stop price is set at a distance below the current price, while a limit (profit target) is also defined.
• For Short Positions:
o The profit is calculated as the difference between the average entry price and the current price.
o A similar trailing stop exit is applied if the profit exceeds the trigger threshold.
________________________________________
Summary
In essence, this strategy works by:
• Defining entry levels based on recent local highs and lows.
• Placing pending stop orders to enter the market when those levels are breached.
• Filtering orders by time, ensuring trades are only taken during specified hours.
• Implementing a trailing stop mechanism to secure profits once the trade moves favorably.
This approach is designed to automate BTC trading based on price action and dynamic risk management, although further enhancements (like dynamic position sizing based on RiskPercent) could be added for a more complete risk management system.

ThinkTech AI SignalsThink Tech AI Strategy
The Think Tech AI Strategy provides a structured approach to trading by integrating liquidity-based entries, ATR volatility thresholds, and dynamic risk management. This strategy generates buy and sell signals while automatically calculating take profit and stop loss levels, boasting a 64% win rate based on historical data.
Usage
The strategy can be used to identify key breakout and retest opportunities. Liquidity-based zones act as potential accumulation and distribution areas and may serve as future support or resistance levels. Buy and sell zones are identified using liquidity zones and ATR-based filters. Risk management is built-in, automatically calculating take profit and stop loss levels using ATR multipliers. Volume and trend filtering options help confirm directional bias using a 50 EMA and RSI filter. The strategy also allows for session-based trading, limiting trades to key market hours for higher probability setups.
Settings
The risk/reward ratio can be adjusted to define the desired stop loss and take profit calculations. The ATR length and threshold determine ATR-based breakout conditions for dynamic entries. Liquidity period settings allow for customized analysis of price structure for support and resistance zones. Additional trend and RSI filters can be enabled to refine trade signals based on moving averages and momentum conditions. A session filter is included to restrict trade signals to specific market hours.
Style
The strategy includes options to display liquidity lines, showing key support and resistance areas. The first 15-minute candle breakout zones can also be visualized to highlight critical market structure points. A win/loss statistics table is included to track trade performance directly on the chart.
This strategy is intended for descriptive analysis and should be used alongside other confluence factors. Optimize your trading process with Think Tech AI today!

Premarket Gap MomoTrader(SC)🚀 Pre-Market Momentum Trader | Dynamic Position Sizing 🔥
📈 Trade explosive pre-market breakouts with confidence! This algorithmic strategy automatically detects high-momentum setups, dynamically adjusts position size, and ensures risk control with a one-trade-per-day rule.
⸻
🎯 Key Features
✅ Pre-Market Trading (4:00 - 9:30 AM EST) – Only trades during the most volatile session for early breakouts.
✅ Dynamic Position Sizing – Adapts trade size based on candle strength:
• ≥90% body → 100% position
• ≥85% body → 50% position
• ≥75% body → 25% position
✅ 1 Trade Per Day – Avoids overtrading by allowing only one high-quality trade daily.
✅ Momentum Protection – Stays in the trade as long as:
• Every candle remains green (no red candles).
• Each new candle has increasing volume (confirming strong buying).
✅ Automated Exit – Closes position if:
• A red candle appears.
• Volume fails to increase on a green candle.
⸻
🔍 How It Works
📌 Entry Conditions:
✔️ Candle gains ≥5% from previous close.
✔️ Candle is green & body size ≥75% of total range.
✔️ Volume >15K (confirming liquidity).
✔️ Occurs within pre-market session (4:00 - 9:30 AM EST).
✔️ Only the first valid trade of the day is taken.
📌 Exit Conditions:
❌ First red candle after entry → Exit trade.
❌ First green candle with lower volume → Exit trade.
⸻
🏆 Why Use This?
🔹 Eliminates Fake Breakouts – No trade unless volume & momentum confirm.
🔹 Prevents Overtrading – Restricts to one quality trade per day.
🔹 Adaptable to Any Market – Works on stocks, crypto, or forex.
🔹 Hands-Free Execution – No manual chart watching required!
⸻
🚨 Important Notes
📢 Not financial advice. Trading involves risk—always backtest & practice on paper trading before using real money.
📢 Enable pre-market data in your TradingView settings for accurate results.
📢 Optimized for 1-minute & 5-minute timeframes.
🔔 Like this strategy? Leave a comment, share your results, and don’t forget to hit Follow for more strategies! 🚀🔥

Breakouts With Timefilter Strategy [LuciTech]This strategy captures breakout opportunities using pivot high/low breakouts while managing risk through dynamic stop-loss placement and position sizing. It includes a time filter to limit trades to specific sessions.
How It Works
A long trade is triggered when price closes above a pivot high, and a short trade when price closes below a pivot low.
Stop-loss can be set using ATR, prior candle high/low, or a fixed point value. Take-profit is based on a risk-reward multiplier.
Position size adjusts based on the percentage of equity risked.
Breakout signals are marked with triangles, and entry, stop-loss, and take-profit levels are plotted.
moving average filter: Bullish breakouts only trigger above the MA, bearish breakouts below.
The time filter shades the background during active trading hours.
Customization:
Adjustable pivot length for breakout sensitivity.
Risk settings: percentage risked, risk-reward ratio, and stop-loss type.
ATR settings: length, smoothing method (RMA, SMA, EMA, WMA).
Moving average filter (SMA, EMA, WMA, VWMA, HMA) to confirm breakouts.

Sunil WMA 5Sunil WMA 5 – Precision Trend Following Strategy
Overview
The Sunil WMA 5 is a trend-following trading strategy designed to identify optimal entry and exit points based on price action and momentum confirmation. The strategy is fully non-repainting and works effectively across various markets, including stocks, forex, commodities, indices, and cryptocurrencies.
This strategy employs a Weighted Moving Average (WMA) filter to enhance trend identification. It is particularly useful for scalping, day trading, and swing trading in volatile markets.
Key Features
🔹 Adaptive Trading Window – Allows users to define a specific time range for trade execution, preventing unnecessary entries outside active hours.
🔹 Flexible Trade Direction – Users can configure the strategy to trade Long Only, Short Only, or Long/Short mode.
🔹 Automated Alerts for Trade Execution – Webhook-compatible alerts allow seamless integration with brokers and automated trading platforms.
🔹 Strict Entry & Exit Rules – Ensures a disciplined approach to trading with clear logic for opening and closing positions.
🔹 Optimized for Various Timeframes – Can be used on lower timeframes (e.g., 1s, 5s, 15s) for high-frequency trading or on higher timeframes for swing trading.
Default Input Parameters & Settings
1. Trading Session (Time Window)
📌 Parameter: Trading Window
Default Value: "0000-0000" (Trades 24/7 unless a specific window is set)
Description: Allows traders to define a specific time range for trade execution. If a trade is open when the window closes, the position is automatically exited.
2. Trade Direction
📌 Parameter: Strategy Direction
Default Value: "Long/Short"
Options: "Long Only", "Short Only", "Long/Short"
Description: Determines whether the strategy will take only long trades, only short trades, or both.
3. Automated Trading Alerts (Webhook-Compatible)
📌 Parameters:
Long_Entry_Jason – (Default: "") Webhook JSON for long entries.
Long_Exit_Jason – (Default: "") Webhook JSON for long exits.
Short_Entry_Jason – (Default: "") Webhook JSON for short entries.
Short_Exit_Jason – (Default: "") Webhook JSON for short exits.
💡 Purpose: These parameters allow the strategy to send automated alerts, which can be connected to external trading platforms for trade execution.
4. Moving Average Settings
📌 Indicator Used: Weighted Moving Average (WMA)
Period: 5 (Fixed)
Description: The strategy calculates a short-term 5-period WMA as a trend filter. Trade signals are generated based on price interaction with this WMA.
How the Strategy Works
📌 1. Trade Entry Logic
The strategy identifies potential buy or sell opportunities when price action meets certain trend-confirmation criteria.
Long trades are triggered when price crosses above the 5-period WMA.
Short trades are triggered when price crosses below the 5-period WMA.
Only one position (long or short) is held at a time, ensuring clear and structured trade management.
📌 2. Trade Exit Logic
A position is closed when an opposite trade condition occurs.
If a long position is open and a short signal is triggered, the long trade is closed.
If a short position is open and a long signal is triggered, the short trade is closed.
If the trading session ends while a trade is open, the position is closed automatically.
📌 3. Automated Trading & Alerts
Users can integrate this strategy with TradingView Alerts to receive notifications or execute trades automatically.
The webhook-compatible alerts allow seamless execution with third-party trading platforms.
Best Use Cases
✅ Scalping & High-Frequency Trading – Works well on lower timeframes such as 1s, 5s, and 15s.
✅ Day Trading & Swing Trading – Can also be applied to longer timeframes for structured trend-following setups.
✅ Crypto, Forex, Stocks, and Indices – Best suited for assets with strong volatility and liquidity.

Sunil BB Blast Heikin Ashi StrategySunil BB Blast Heikin Ashi Strategy
The Sunil BB Blast Heikin Ashi Strategy is a trend-following trading strategy that combines Bollinger Bands with Heikin-Ashi candles for precise market entries and exits. It aims to capitalize on price volatility while ensuring controlled risk through dynamic stop-loss and take-profit levels based on a user-defined Risk-to-Reward Ratio (RRR).
Key Features:
Trading Window:
The strategy operates within a user-defined time window (e.g., from 09:20 to 15:00) to align with market hours or other preferred trading sessions.
Trade Direction:
Users can select between Long Only, Short Only, or Long/Short trade directions, allowing flexibility depending on market conditions.
Bollinger Bands:
Bollinger Bands are used to identify potential breakout or breakdown zones. The strategy enters trades when price breaks through the upper or lower Bollinger Band, indicating a possible trend continuation.
Heikin-Ashi Candles:
Heikin-Ashi candles help smooth price action and filter out market noise. The strategy uses these candles to confirm trend direction and improve entry accuracy.
Risk Management (Risk-to-Reward Ratio):
The strategy automatically adjusts the take-profit (TP) level and stop-loss (SL) based on the selected Risk-to-Reward Ratio (RRR). This ensures that trades are risk-managed effectively.
Automated Alerts and Webhooks:
The strategy includes automated alerts for trade entries and exits. Users can set up JSON webhooks for external execution or trading automation.
Active Position Tracking:
The strategy tracks whether there is an active position (long or short) and only exits when price hits the pre-defined SL or TP levels.
Exit Conditions:
The strategy exits positions when either the take-profit (TP) or stop-loss (SL) levels are hit, ensuring risk management is adhered to.
Default Settings:
Trading Window:
09:20-15:00
This setting confines the strategy to the specified hours, ensuring trading only occurs during active market hours.
Strategy Direction:
Default: Long/Short
This allows for both long and short trades depending on market conditions. You can select "Long Only" or "Short Only" if you prefer to trade in one direction.
Bollinger Band Length (bbLength):
Default: 19
Length of the moving average used to calculate the Bollinger Bands.
Bollinger Band Multiplier (bbMultiplier):
Default: 2.0
Multiplier used to calculate the upper and lower bands. A higher multiplier increases the width of the bands, leading to fewer but more significant trades.
Take Profit Multiplier (tpMultiplier):
Default: 2.0
Multiplier used to determine the take-profit level based on the calculated stop-loss. This ensures that the profit target aligns with the selected Risk-to-Reward Ratio.
Risk-to-Reward Ratio (RRR):
Default: 1.0
The ratio used to calculate the take-profit relative to the stop-loss. A higher RRR means larger profit targets.
Trade Automation (JSON Webhooks):
Allows for integration with external systems for automated execution:
Long Entry JSON: Customizable entry condition for long positions.
Long Exit JSON: Customizable exit condition for long positions.
Short Entry JSON: Customizable entry condition for short positions.
Short Exit JSON: Customizable exit condition for short positions.
Entry Logic:
Long Entry:
The strategy enters a long position when:
The Heikin-Ashi candle shows a bullish trend (green close > open).
The price is above the upper Bollinger Band, signaling a breakout.
The previous candle also closed higher than it opened.
Short Entry:
The strategy enters a short position when:
The Heikin-Ashi candle shows a bearish trend (red close < open).
The price is below the lower Bollinger Band, signaling a breakdown.
The previous candle also closed lower than it opened.
Exit Logic:
Take-Profit (TP):
The take-profit level is calculated as a multiple of the distance between the entry price and the stop-loss level, determined by the selected Risk-to-Reward Ratio (RRR).
Stop-Loss (SL):
The stop-loss is placed at the opposite Bollinger Band level (lower for long positions, upper for short positions).
Exit Trigger:
The strategy exits a trade when either the take-profit or stop-loss level is hit.
Plotting and Visuals:
The Heikin-Ashi candles are displayed on the chart, with green candles for uptrends and red candles for downtrends.
Bollinger Bands (upper, lower, and basis) are plotted for visual reference.
Entry points for long and short trades are marked with green and red labels below and above bars, respectively.
Strategy Alerts:
Alerts are triggered when:
A long entry condition is met.
A short entry condition is met.
A trade exits (either via take-profit or stop-loss).
These alerts can be used to trigger notifications or webhook events for automated trading systems.
Notes:
The strategy is designed for use on intraday charts but can be applied to any timeframe.
It is highly customizable, allowing for tailored risk management and trading windows.
The Sunil BB Blast Heikin Ashi Strategy combines two powerful technical analysis tools (Bollinger Bands and Heikin-Ashi candles) with strong risk management, making it suitable for both beginners and experienced traders.
Feebacks are welcome from the users.

[3Commas] DCA Bot TesterDCA Bot Tester
🔷What it does: A tool designed to simulate the behavior of a Dollar Cost Averaging (DCA) strategy based on input signals from a source indicator. Additionally, it enables you to send activation signals to 3Commas Bots via TradingView webhooks.
🔷Who is it for: This tool is ideal for those who want a visual representation and strategy report of how a DCA Bot would perform under specific conditions. By adjusting the parameters, you can assess whether the strategy aligns with your risk/reward expectations before implementation, helping you save time and protect your capital.
🔷How does it work: The tool leverages a pyramiding function to simulate price averaging, mimicking how a DCA Bot operates. It calculates volume-based averaging and, upon reaching the target, closes the positions. Conversely, if the target isn't reached, a Stop Loss is triggered, potentially resulting in significant losses if improperly configured.
🔷Why It’s Unique
Easy visualization of DCA Bot entry and exit points according to user preferences.
DCA Bot Summary table same as the one shown in the new 3Commas interface.
Use plots from other indicators as Entry Trigger Source, with a small modification of the code.
Option to Review message format before sending Signals to 3Commas. Compatibility with Multi-Pair, and futures contract pairs.
Option to filter signals by session and day according to the user’s timezone.
👉 Before continuing with the explanation of the tool, please take a few minutes to read this information, paying special attention to the risks of using DCA strategies.
DCA Bot: What is it, how does it work, and what are its advantages and risks?
A DCA Bot is an automated tool designed to simplify and optimize your trading operations, particularly in cryptocurrencies. Based on the concept of Dollar Cost Averaging (DCA) , this bot implements scaled strategies that allow you to distribute your investments intelligently. The key lies in dividing your capital into multiple orders, known as base orders and safety orders, which are executed at different price levels depending on market conditions.
These bots are highly customizable, meaning you can adapt them to your goals and trading style, whether you're operating Long (expecting a price increase) or Short (expecting a price decrease). Their primary purpose is to reduce the impact of entries that move against the estimated direction and ensure you achieve a more favorable average price.
🔸 Key Features of DCA Bots
Customizable configuration: DCA bots allow you to adjust the size of your initial investment, the number of safety orders, and the price levels at which these orders execute. These orders can be equal or incremental, depending on your risk tolerance.
Scaled safety orders: If the asset's price moves against your position, the bot executes safety orders at strategic levels to average your entry price and increase your chances of closing in profit.
Automatic Take Profit: When the predefined profit level is reached, the bot closes the position, ensuring net gains by averaging all entries made using the DCA strategy.
Stop Loss option: To protect your capital, you can set a stop loss level that limits losses if the market moves drastically against your position.
Flexibility: Bots can integrate with 3Commas technical indicators or external signals from TradingView, allowing you to trade in any trend, whether bullish or bearish.
Support for multiple assets: You can trade cryptocurrency pairs and exchanges compatible with 3Commas, offering a wide range of possibilities to diversify your strategies.
✅ Advantages of DCA Bots
Time-saving automation: DCA bots eliminate the need for constant market monitoring, executing your trades automatically and efficiently based on predefined settings.
Favorable averages in volatile markets: By averaging your entries, the bot can offer more competitive prices even under adverse market conditions. This increases your chances of recovering a position and closing it profitably.
Advanced capital management: With customizable settings, you can adjust the size of base and safety orders to optimize capital usage and reduce risk.
Additional protection: The ability to set a stop loss ensures your losses are limited, safeguarding your capital in extreme scenarios.
⚠️ Risks of Using a DCA Bot
Requires significant capital: Safety orders can accumulate quickly if the price moves against your position. This issue is compounded if increasing amounts are used for safety orders, which can immobilize large portions of capital in adverse markets.
Markets lacking clear direction: During consolidation periods or erratic movements, the bot may generate unrealized losses and make position recovery difficult.
Opportunity cost: Investing in an asset that doesn't show favorable behavior can prevent you from seizing opportunities in other markets.
Emotional pressure: Large investments in advanced stages of the DCA strategy can cause stress, especially if an asset takes too long to reach your take profit level.
Dependence on market recovery: DCA assumes that the price will eventually move in your favor, which does not always happen, especially in assets without solid fundamentals.
📖 Key Considerations for Effectively Using a DCA Bot
Use small amounts for your base and safety orders: Setting small initial orders not only limits capital usage but also allows you to manage multiple bots simultaneously, maximizing portfolio diversification.
Capital management: Define a clear budget and never risk more than you are willing to lose. This is essential for maintaining sustainable operations.
Select assets with strong fundamentals: Apply DCA to assets you understand and that have solid fundamentals and a proven historical growth record. Additionally, analyze each cryptocurrency's fundamentals: What problem does it solve? Does it have a clear use case? Is it viable in the long term? These questions will help you make more informed decisions.
Diversification: Do not concentrate all your capital on a single asset or strategy. Spread your risk across multiple bots or assets.
Monitor regularly: While bots are automated and eliminate the need to monitor the market constantly, it is essential to monitor the bots themselves to ensure they are performing as expected. This includes reviewing their performance and making adjustments if market conditions change. Remember, the goal is to automate trades, but active bot management is crucial to avoid surprises.
A DCA Bot is a powerful tool for traders looking to automate their strategies and reduce the impact of market fluctuations. However, like any tool, its success depends on how it is configured and used. By applying solid capital management principles, carefully selecting assets, and using small amounts in your orders, you can maximize its potential and minimize risks.
🔷FEATURES & HOW TO USE
🔸Strategy: Here you must select the type of signal you are going to analyze and send signals to the DCA Bot, either Long for buy signals or Short for sell signals. This must match the Bot created in 3Commas.
🔸Add a Source Indicator for Entry Triggers
Tradingview allows us to use indicator plots as a source in other indicators, we will use this functionality so that the buy or sell signals of an indicator are processed by the DCA Bot Tester.
In this EXAMPLE we will use a simple strategy that uses a Donchian Channel (DC) and an Exponential Moving Average (EMA).
Trigger to buy or long signal will be when: the price closes above the previous upper level and the average of the upper and lower level (basis) is greater than the EMA.
Trigger sell or short signal will be when: the price closes below the previous lower level and the average of the upper and lower level (basis) is less than the EMA.
trigger_buy = ta.crossover (close,upper ) and basis > ema and barstate.isconfirmed
trigger_sell = ta.crossunder(close,lower ) and basis < ema and barstate.isconfirmed
Then we create the plots that will be used as input source in the DCA Bot Tester indicator.
When a buy condition is given the plot "🟢 Trigger Buy" will have a value of 1 otherwise it will remain at 0.
When a sell condition is given the plot "🔴 Trigger Sell" will have a value of -1 otherwise it will remain at 0.
plot(trigger_buy ? 1 : 0 , '🟢 Trigger Buy' , color = na, display = display.data_window)
plot(trigger_sell? -1 : 0 , '🔴 Trigger Sell', color = na, display = display.data_window)
Here you have the complete code so you can use it and do tests. Basically you just have to define the buy or sell conditions of your preferred indicator or strategy and then create the plots with the same format that will be used in DCA Bot Tester.
//@version=6
indicator(title="Simple Strategy Example", overlay= false)
// Indicator and Signal Triggers
length = input.int(10, title = "DC Length" , display = display.none)
length_ema = input.int(50, title = "EMA Length", display = display.none)
lower = ta.lowest (length)
upper = ta.highest(length)
ema = ta.ema (close, length_ema)
basis = math.avg (upper, lower)
plot(basis, "Basis", color = color.orange, display = display.all-display.status_line)
plot(upper, "Upper", color = color.blue , display = display.all-display.status_line)
plot(lower, "Lower", color = color.blue , display = display.all-display.status_line)
plot(ema , "EMA" , color = color.red , display = display.all-display.status_line)
candlecol = open < close ? color.teal : color.red
plotcandle(open, high, low, close, title='Candles', color = candlecol, wickcolor = candlecol, bordercolor = candlecol, display = display.pane)
trigger_buy = ta.crossover (close,upper ) and basis > ema and barstate.isconfirmed
trigger_sell = ta.crossunder(close,lower ) and basis < ema and barstate.isconfirmed
plotshape(trigger_buy ?close:na, title="Label Buy" , style=shape.labelup , location= location.belowbar, color=color.green, text="B", textcolor=color.white, display=display.pane)
plotshape(trigger_sell?close:na, title="Label Sell", style=shape.labeldown, location= location.abovebar, color=color.red , text="S", textcolor=color.white, display=display.pane)
// ――――――――――――――――――――――――――――――――――――――――――――――――――――――――――――――――――――――――――――――――――――――――――――――――――――――――――――――――――――
// 👇 Plots to be used in the DCA Bot Indicator as source triggers.
// ――――――――――――――――――――――――――――――――――――――――――――――――――――――――――――――――――――――――――――――――――――――――――――――――――――――――――――――――――――
plot(trigger_buy ? 1 : 0 , '🟢 Trigger Buy' , color = na, display = display.data_window)
plot(trigger_sell? -1 : 0 , '🔴 Trigger Sell', color = na, display = display.data_window)
To use the example code
Open the Pine Editor, paste the code and then click Add to chart.
Then in the Plot Entry Trigger Source option, we will select 🟢 Trigger Buy, as the plot that will give us the buy signals when it is worth 1, otherwise for the sell signals you must change the value to -1 in the Plot Entry Trigger Value and remember to change the strategy mode to Short.
🔸DCA Settings: Here you need to configure the DCA values of the strategy, you can see the meaning of each value in the Settings Section. Once you are satisfied with the tests configure the 3Commas DCA Bot with the same values so that the Summary Table matches the 3Commas Table. Pay close attention to the Total Volume that the Bot will use, according to the amount of Safety Orders you are going to execute, and that all the values in the table adapt to your risk tolerance.
🔸DCA Bot Deal Start: Once you create the Bot in 3Commas with the same settings it will give you a Deal Start Message, you must copy and paste it in this section, verify that it is the same in the summary table, this is used to be sent through tradingview alerts to the Bot and it can process the signals.
🔸DCA Bot Multi-Pair: A Multi-Pair Bot allows you to manage several pairs with a single bot, but you must specify which pair it will run on. You must activate it if you want to use the signals in a DCA Bot Multi-pair. In the text box you must enter (using the 3Commas format) the symbol for each pair before you create the alert so that the bot understands which pair to work on.
In the following image we would be configuring the indicator to send a signal to activate the bot in the BTCUSDT pair using the given format it would be USDT_BTC, but if we wanted to send a signal in another pair we must change the pair in the chart and also in the configuration, an example with ETHUSDT would be USDT_ETH. After this we could create the alert, and the Mult-Pair Bot would detect it correctly.
🔸Strategy Tester Filters: This is useful if you want to test the strategy's result on a certain time window, the indicator will only enter this range. If disabled it will use all historical data available on the chart. If you are going to use the tool to send signals, make sure to disable the Use Custom Test Period. If you want the entries to only run at a certain time and day, in that case make sure that the timezone matches the one you are using in the chart.
🔸Properties: Adjust your initial capital and exchange commission appropriately to achieve realistic results.
🔸Create alerts to trigger the DCA Bot
Check that the message is the same as the one indicated by the DCA Bot.
In the case of Multi-Pair, enable the option to add the symbol with the correct format.
When creating an alert, select Any alert() function call.
Enter the any name of the alert.
Open the Notifications tab and enable Webhook URL
Paste Webhook URL provided by 3Commas looking in the section How to use TradingView custom signals.
Done, alerts will be sent with the correct format automatically to 3Commas.
🔷 INDICATOR SETTINGS
🔸3Commas DCA Bot Settings
Strategy: Select the direction of the strategy to test Long or Short, this must be the same as the Bot created in 3Commas, so that the signals are processed properly.
DCA Bot Deal Start: Copy and paste the message for the deal start signal of the DCA Bot you created in 3Commas. This is the message that will be sent with the alert to the Bot, you must verify that it is the same as the 3Commas bot so that it can process properly so that it executes and starts the trade.
DCA Bot Multi-Pair: A Multi-Pair Bot allows you to manage several pairs with a single bot, but you must specify which pair it will run on.
DCA Bot Summary Table: Here you can activate the display of table as well as change the size, position, text color and background color.
🔸Source Indicator Settings
Plot Entry Trigger Source: Select a Plot for Entries of the Source Indicator. This refers to the Long or Short entry signal that the indicator will use as BO (Base Order).
Plot Entry Trigger Value: Value of the Source Indicator to Deal Start Condition Trigger. The default value is 1, this means that when a signal is given for example Long in the source indicator, we will use 1 or for Short -1 if there is no signal it will be 0 so it will not execute any entry, please review the example code and adjust the indicator you are going to use in the same way.
🔸DCA Settings
Base Order: The Base Order is the first order the bot will create when starting a new deal.
Safety Order: Enter the amount of funds your safety orders will use to average the cost of the asset being traded.Safety orders are also known as Dollar Cost Averaging and help when prices move in the opposite direction to your bot's take profit target.
Safety Orders Deviation %: Enter the percentage difference in price to create the first Safety Order. All Safety Orders are calculated from the price the initial Base Order was filled on the exchange account.
Safety Orders Max Count: This is the total number of Safety Orders the bot is allowed to use per deal that is opened. All Safety Orders created by the bot are placed as Limit Orders on the exchange's order book.
Safety Orders Volume Scale: The Safety Order Volume Scale is used to multiply the amount of funds used by the last Safety Order that was created. Using a larger amount of funds for Safety Orders allows your bot to be more aggressive at Dollar Cost Averaging the price of the asset being traded.
Safety Orders Step Scale: The Safety Order Step Scale is used to multiply the Price Deviation percentage used by the last Safety Order placed on the exchange account. Using a larger value here will reduce the amount of Safety Orders your bot will require to cover a larger move in price in the opposite direction to the active deal's take profit target.
Take Profit %: The Take Profit section offers tools for flexible management of target parameters: automatic profit upon reaching one or more target levels in percentage.
Stop Loss % | Use SL: To enable Stop Loss, please check the "Use SL" box. This is the percentage that price needs to move in the opposite direction to close the deal at a loss. This must be greater than the sum of the deviations from the safety orders.
🔸Strategy Tester Filters
Use Custom Test Period: When enabled signals only works in the selected time window.. If disabled it will use all historical data available on the chart.
Test Start and End: Once the Custom Test Period is enabled, here you select the start and end date that you want to analyze.
Session Filter | Days | Background: Here you can choose a time zone in which signals will be sent or your strategy will be tested, as well as the days and a background of it. It is important that you use the same timezone as your chart so that it matches.
👨🏻💻💭 If this tool helps you, don’t forget to give it a boost! Feel free to share in the comments how you're using it or if you have any questions.
_________________________________________________________________
The information and publications within the 3Commas TradingView account are not meant to be and do not constitute financial, investment, trading, or other types of advice or recommendations supplied or endorsed by 3Commas and any of the parties acting on behalf of 3Commas, including its employees, contractors, ambassadors, etc.

MicuRobert EMA Cross StrategyThis is a repost of a old strategy that cant be updated anymore, it was a request for a user made in Oct, 6, 2015
Here's a possible engaging description for the tradingview script:
**MicuRobert EMA Cross V2: A Powerful Trading Strategy**
Join the ranks of successful traders with this advanced strategy, designed to help you profit from market trends. The MicuRobert EMA Cross V2 combines two essential indicators - Exponential Moving Average (EMA) and Divergence EMA (DEMA) - to generate buy and sell signals.
**Key Features:**
* **Trading Session Filter**: Only trade during your preferred session, ensuring you're in sync with market conditions.
* **Trailing Stop**: Automatically adjust stop-loss levels to lock in profits or limit losses.
* **Customizable Trade Size**: Set the size of each trade based on your risk tolerance and trading goals.
**How it Works:**
The script uses two EMAs (5-period and 34-period) to identify trends. When the shorter EMA crosses above the longer one, a buy signal is generated. Conversely, when the shorter EMA falls below the longer one, a sell signal is triggered. The strategy also incorporates divergence analysis between price action and the EMAs.
**Visual Aids:**
* **EMA Plots**: Visualize the two EMAs on your chart to gauge market momentum.
* **Buy/Sell Signals**: See when buy or sell signals are generated, along with their corresponding entry prices.
* **Trailing Stop Lines**: Monitor stop-loss levels as they adjust based on price action.
**Get Started:**
Download this script and start trading like a pro! With its robust features and customizable settings, the MicuRobert EMA Cross V2 is an excellent addition to any trader's arsenal.
~Llama3

LuxAlgo - Backtester (PAC)The PAC Backtester is an innovative strategy script that allows users to create a wide variety of strategies derived from price action-related concepts for a data-driven approach to discretionary trading strategies.
Thanks to our 'Step' and 'Match' algorithm, users can create custom and complex strategy entries and exits from features such as market structure, order blocks, imbalances, as well as any external indicators, allowing users to create entries from a sequence of conditions and/or multiple matching conditions.
We included a complete alert system that will send a notification for each action taken by the strategy and we also allow users to set custom messages for each action taken by a strategy.
🔶 Features
🔹 Step & Match Algorithm
More complex entry rules can be created by using multiple conditions together, this is done thanks to the Step dropdown setting on the right of each condition.
The Step setting is directly related to the Step & Match algorithm and works in two ways:
When two or more conditions have the same step number, both conditions are evaluated. Used to test matching conditions.
When two or more conditions have different step numbers, each condition will be evaluated in order, testing for the first step and switching to the next step once the previous one is true. When the final step is true the strategy will open a market order. Used to create a sequence of conditions.
This operation is complementary, as you can create a sequence of conditions with one step consisting of two or more matching conditions as long as they have the same step number.
🔹 Fully Customizable Price Action Concepts As Entries
We allow the users to use market structures, order blocks, imbalances, and external sources together to set their custom entry and exit conditions.
Market structures are commonly used to determine trend direction by indicating when prices break prior swing points. Their occurrence can be used as entry conditions.
Order blocks highlight areas where institutional market participants open positions, one can use order blocks to determine confirmation entries or potential targets as we can expect there is a large amount of liquidity at these order blocks. Price entering, being within, or mitigating an order block can be used as an entry condition.
Market imbalances highlight areas where there is a disparity between supply and demand. Price entering, being within, or mitigating an imbalance can be used as an entry condition.
This system also allows the use of external sources to create entry and exit conditions, such as moving averages, bands, trailing stops...etc.
🔹 Complete Alert System
Users can get alerted for any action executed by a strategy, from opening positions to closing them.
The message field in the Alert Messages setting section allows for the strategy to send a custom alert message depending on the action taken by the strategy, if no messages are set the strategy will send default messages.
🔶 Usage
Users can create complete price action strategies from this script, let's see an example using the following entry conditions:
Long: Mitigated bearish order block occurring during the New York session after a mitigated bearish imbalance.
Short: Mitigated bullish order block occurring during the New York session after a mitigated bullish imbalance.
Take Profit: 2 points away from the entry price.
Stop Loss: 1 point away from the entry price.
We can also use features from Price Action Concepts™ to construct custom exit conditions, leading to the following strategy conditions:
Long: Bullish CHoCH and price mitigates bearish FVG.
Short: Bearish CHoCH and price mitigates bullish FVG.
Exit Long: Price mitigates bearish order block.
Exit Short: Price mitigates bullish order block.
Users can achieve a wide variety of results by using external indicators as an input source for entries and exits, combining the best from price action and technical indicators. We might for example be interested in exiting a position when the RSI oscillator is overbought or oversold.
🔶 Strategy Properties (Important)
This script backtest is done on daily EURGBP, using the following backtesting properties:
Balance (default): 10 000 (default base currency)
Order Size: 10% of the equity
Comission: 3.4 pips (average spread for EURGBP)
Slippage: 1 tick
Stop Loss: 0.01 points away from entry price
We use these properties to ensure a realistic preview of the backtesting system, do note that default properties can be different for various reasons described below:
Order Size: 1 contract by default, this is to allow the strategy to run properly on most instruments such as futures.
Comission: Comission can vary depending on the market and instrument, there is no default value that might return realistic results.
We strongly recommend all users to ensure they adjust the Properties within the script settings to be in line with their accounts & trading platforms of choice to ensure results from strategies built are realistic.
🔶 How to access
You can see the Author's Instructions below to learn how to get access.
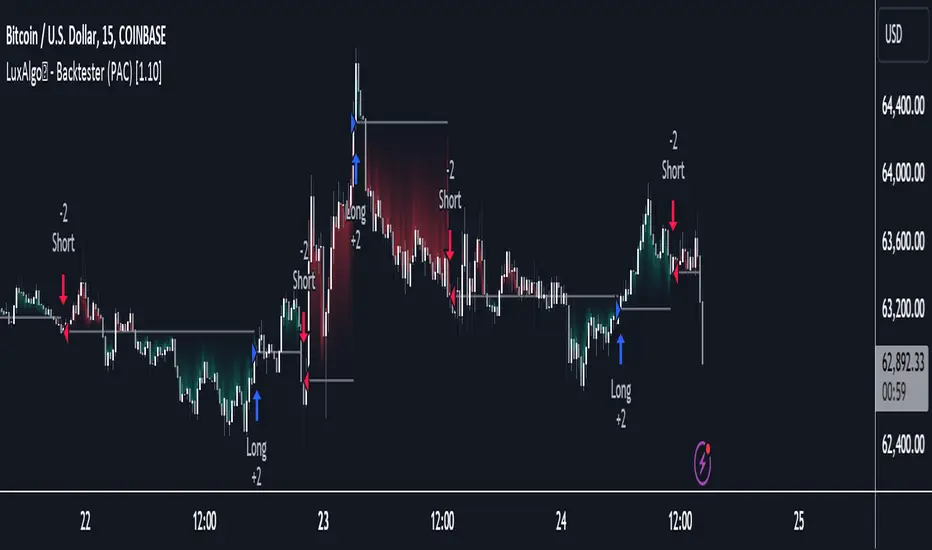
[Round Numbers] Signal Clean Up Analysis with Backtest (TSO)Round Numbers NEW GEN indicator!
===========================================================================
===========================================================================
This is a full-cycle trading system indicator - it will show and alert each step of the trade from open to close. The algorithm here uses Round Numbers for generating signals, TP (Take Profit) and SL (Stop Loss) levels. Round numbers play big role in trading and can easily become strong support and resistance levels where price can bounce and go the opposite way or go through with a very nice run afterwards.
In addition there is a chained (NOTE: You can select several or ALL of the features, this is not limited to either one) signal cleanup and analysis approach with scheduling and alerting capabilities. Works with most popular timeframes: 1M, 3M, 5M, 15M, 30M, 1H, 4H, D.
NOTE: Every action of the trade is calculated on a confirmed closed candle bar state (barstate.isconfirmed), so the indicator will never repaint!
NOTE: At position open - there will be calculated Take-Profit and Stop-Loss targets, however each target is considered hit, when candle bar closes breaking that target, so Take-Profit and Stop-Loss when hit will slightly differ then what you see at trade/position open.
===========================================================================
===========================================================================
Round Numbers up|down unit setting and overall explanation
---------------------------------------------------------------------------
Round Number up|down unit: is the distance between round numbers on the chart. Since these round number levels are also used by the algorithm to open/close trades, it is important to set this setting to a logical number, which will correspond to an average price movement of the instrument.
Here are some examples for a few popular instruments on what will the default 1 round number unit correspond to and what would be suggested:
BTCUSD > $1 (this won't work for Bitcoin, try at least $100 - 100units)
SPY: > $1 (one of the best settings for SPY or QQQ, 50cents shows good results as well - 0.5units)
FOREX (all major pairs): > 10PIPs (that may be a bit small, unless scalping, try 50PIPs - 5units)
===========================================================================
===========================================================================
Explanation of all the Features | Strategy Configuration Guide | Indicator Settings | Signal Cleanup Analysis
---------------------------------------------------------------------------
>>> Customizable Backtesting for a specific date range, results via TradingView strategy, which includes “Deep Backtesting” for largest amounts of data on trading results.
>>> Trading Schedule with customizable trading daily time range, automatic closing/alert trades before Power Hour or right before market closes or leave it open until next day.
>>> 3 Trading Systems.
>>> Static/Dynamic/Trailing Take-Profit and Stop-Loss setups (HIGHLIGHT: Stop-Loss will be moved to Entry after TP1 is taken or a smart trailing Stop-Loss can be used with Stop-Loss dynamically following the trade to minimize risk).
>>> Single or Multiple profit targets (up to 5).
>>> Take-Profit customizable offset feature (set your Take-Profit targets slightly before everyone is expecting it!).
>>> Candle bar signal analysis (matching candle color, skip opposite structured and/or doji candle uncertain signals).
>>> Additional analysis of VWAP/EMA/ATR/EWO (Elliot Wave Oscillator)/Divergence MACD+RSI/Volume signal confirmation (clean up your chart with indicator showing only the best potential signals!).
>>> Advanced Alerts setup, which can be potentially setup with a trading bot over TradingView Webhook (NOTE: This will require advanced programming knowledge).
===========================================================================
Labels, plots, colors explanations:
---------------------------------------------------------------------------
>>>>> LONG open: green "house" looking arrow below candle bar.
>>>>> SHORT open: red "house" looking arrow above candle bar.
>>>>> LONG/SHORT take-profit target: green/red circles (multi-profit > TP2/3/4/5 smaller circles).
>>>>> LONG/SHORT stop-loss target: green/red + crosses.
>>>>> LONG/SHORT take-profit hits: green/red diamonds.
>>>>> LONG/SHORT stop-loss hits: green/red X-crosses.
>>>>> LONG/SHORT EOD (End of Day | Intraday style) close (profitable trade): green/red squares.
>>>>> LONG/SHORT EOD (End of Day | Intraday style) close (loss trade): green/red PLUS(+)-crosses.
===========================================================================
Date Range and Trading Schedule Settings
---------------------------------------------------------------------------
>>>>> Date Range: Select your start and/or end dates (uncheck “End” for indicator to show results up to the very moment and to use for LIVE trading) for backtesting results, if not using backtesting – uncheck “Start”/“End” to turn it off.
>>>>> Use TradingView “Strategy Tester” to see backtesting results
NOTE: If Strategy Tester does not show any results with Date Ranged fully unchecked, there may be an issue where a script opens a trade, but there is not enough TradingView power to set the Take-Profit and Stop-Loss and somehow an open trade gets stuck and never closes, so there are “no trades present”. In such case you will need to manually check “Start”/“End” dates or use “Depp Backtesting” feature!
>>>>> Trading Schedule: This is where you can setup Intraday Session or any custom session schedule you wish. Turn it ON. Select trading hours. Select EOD (End of Day) setting (NOTE: If it will be OFF, the indicator will assume you are holding your position open until next day!). Please note the EOD trade closure times with the 2 different Intraday close settings when turned on:
At Market Close:
1/3/5min > will close at 15:55pm ET
15min > will close at 15:45pm ET
30min > will close at 15:30pm ET
45min > will close at 15:45pm ET
60min > will close at 15:00pm ET
Before Power Hour:
1/3/5min > will close at 15:00pm ET
15min > will close at 15:00pm ET
30min > will close at 15:00pm ET
45min > will close at 15:00pm ET
60min > will close at 15:00pm ET
>>> Trading Systems: 1) "Open Until Closed by TP or SL": the signal will only open a trade if no trades are currently open/trunning, a trade can only be closed by Take Profit, Stop Loss or End of Day close (if turned on) | 2) "Open Until Closed by TP or SL + OCA": Same as 1), but if there is an opposite signal to the trade which is currently open > it will immediately be closed with new trade open or End of Day close (if turned on) | 3) "OCA (no TP or SL)": There are is Take Profit or Stop Loss, only an opposite signal will close current trade and open an opposite one or End of Day close (if turned on).
>>> Turn On/Off: Current Position SL + Opposite Position Open Signal on the same closing candle bar (If current trade hits Stop-Loss and at that same closing candle bar there is a signal for an opposite direction trade > indicator will close current position as Stop-Loss and immediately open an opposite position). NOTE: With this option turned on, there will be more trades, but not necessarily better results, since after Stop-Loss is hit, it may make sense to wait a little before opening an opposite trade, even if it matches the condition at the same time when Stop-Loss is hit, but sometimes it shows great results, so this setting/feature is included. NOTE: This setting only will work/make sense with TP and SL style/behavior both be set to "Fully Closed Candle"!
>>> Turn On/Off: Turn On/Off: Current Position REGULAR SL | Only the SL + Opposite Position Open will trigger if turned on, IF NOT - THERE WILL BE NO STOP-LOSS AT ALL!!! NOTE: It is very dangerous to trade without Stop-Loss!
>>>>> Signal Candle Bar consuming Take-Profits - position/trade signal candle bar is big enough to "consume"/close ahead the first TP setting > the signal can either be skipped, or all Take-Profit areas pushed ahead using smart formula)
>>>>> MULTIPROFIT | TP (Take-Profit) System: 1) Static – Once the trade is open, all Take-Profit target(s) are immediately calculated and set for the trade > once the target(s) is hit > trade will be partially closed (if candle bar closes beyond several Take-Profit targets > trade will be reduced accordingly to the amount of how many Take-Profit targets were hit) ||| 2) Dynamic – Once the trade is open, only the 1st Take-Profit target is calculated, once the 1st Take-Profit is hit > next Take-Profit distance is calculated based on the distance from trade Entry to where 1st Take-Profit was taken, once 2nd Take-Profit is taken > 3rd Take-Profit is calculated per same logic, these are good for price momentum as with price speeding up – profits increase as well!
>>>>> MULTIPROFIT: SL (stop loss) System | Static: SL is set at position open and remains such; Dynamic: Once ANY TP is taken > SL will be moved to Entry; Trailing: SL will be moved along the position (smart trailing stop-loss), at TP1 taken > SL moves to Entry, at TP2 taken > SL moves to TP1, at TP3 taken > SL moves to TP2 and so on.
>>>>> # of TPs (number of take profit targets): Just like it is named, this is where you select the number of Take-Profit targets for your trading system (NOTE: If "OCA (no TP or SL)" Trading System is selected, this setting won’t do anything, since there are no TP or SLs for that system).
>>>>> TP(s) offset: This is a special feature for all Take-Profit targets, where you can turn on a customizable offset, so that if the price is almost hitting the Take-Profit target, but never actually touches it > you will capture it. This is good to use with HHLL (Highest High Lowest Low), which is pretty much a Support/Resistance as often the price will nearly touch these strong areas and turn around…
===========================================================================
Dynamic/Static/Trailing Take-Profit and Stop-Loss visual examples:
---------------------------------------------------------------------------
1) Fully Static Take-Profit and Stop-Loss
This one is a fully static setup for both Take-Profit and Stop-Loss, you can also observe how trade is closed right before the Power Hour (trade can be closed right before Power Hour or right before Market Closes or left overnight as desired).
2) Static/Dynamic, Static Take-Profit and Dynamic Stop-Loss
You can see a static Take-Profit set at position open, while Stop-Loss moves to Entry once TP1 target is taken.
3) Static/Trailing, Static Take-Profit and Trailing Stop-Loss
In here with each Take-Profit taken, Stop-Loss moves along the trade to previous Take-Profit level, you can notice how stop-loss literally follows the trade and reduces the potential loss.
4) Dynamic/Trailing, Dynamic Take-Profit and Trailing Stop-Loss
See how Take-Profit distances increase with price momentum. Just like in previous example - Trailing Stop-Loss is following the trade and reducing the riks.
===========================================================================
Signal Analysis and Cleanup Settings
---------------------------------------------------------------------------
>>>>> Candle Analysis | Candle Color signal confirmation: If closed candle bar color does not match the signal direction > no trade will be open.
>>>>> Candle Analysis | Skip opposite candle signals: If closed candle bar color will match the signal direction, but candle structure will be opposite (for example: bearish green hammer, long high stick on top of a small green square) > no trade will be open.
>>>>> Candle Analysis | Skip doji candle signals: If closed candle bar will be the uncertain doji > no trade will be open.
>>>>> Divergence/Oscillator Analysis | EWO (Elliot Wave Oscillator) signal confirmation: LONG will only be open if at signal, EWO is green or will be at bullish slope (you can select which setting you desire), SHORT if EWO is red or will be at bearish slope.
>>>>> Divergence/Oscillator Analysis | VWAP signal confirmation: LONG will only be open if at signal, the price will be above VWAP, SHORT if below.
>>>>> Divergence/Oscillator Analysis | Moving Average signal confirmation: LONG will only be open if at signal, the price will be above selected Moving Average, SHORT if below.
>>>>> Divergence/Oscillator Analysis | ATR signal confirmation: LONG will only be open if at signal, the price will be above ATR, SHORT if below.
>>>>> Divergence/Oscillator Analysis | RSI + MACD signal confirmation: LONG will only be open if at signal, RSI + MACD will be bullish, SHORT if RSI + MACD will be bearish.
>>>>> Volume signal confirmation: LONG/SHORT will only be opened with strong Volume matching the signal direction, by default, strong Volume percentage is set to 150% and weak to 50%, but you can change it as you desire.
===========================================================================
||||||||||||||||||||||||||||||||||| *** ||||||||||||||||||||||||||||||||||| *** |||||||||||||||||||||||||||||||||||
||||||||||||||||||||||||||||||||||| *** ||||||||||||||||||||||||||||||||||| *** |||||||||||||||||||||||||||||||||||
TP System - VERY IMPORTANT INFO!
-------------------------------------------------------------------------------------------------------------------
"TP PERCENTAGE" - amount by which current trade/position needs to be reduced/partially closed/sold.
-------------------------------------------------------------------------------------------------------------------
TP System: Dynamic
"TP PERCENTAGE" - will always be the same amount (trade/position size divided by the # of take-profit(TP) targets) and percentage to be closed will always be of the ORIGINAL trade/position.
-------------------------------------------------------------------------------------------------------------------
TP System: Static
"TP PERCENTAGE" - will always be the same amount IF take-profit(TP) targets are hit 1-by-1 (TP1 > TP2 > TP3 > TP4 > TP5), otherwise it will vary and unless it is a 1st take-profit(TP1), the REMAINING trade/position size will always be smaller than original and therefore the percentage to be closed will always be of the REMAINING trade/position and NOT the original one!
-------------------------------------------------------------------------------------------------------------------
"TP PERCENTAGE" CheatSheet (these are the only percentages you may see)
-----------------------------------------------------------------------
TP PERCENTAGE---Close/Sell Amount-------------Example (trade size: 50 stocks)
20%-------------trade size * 0.2--------------50 * 0.2 = 10 stocks
25%-------------trade size * 0.25-------------50 * 0.25 = 12.5(~13) stocks
34%-------------trade size * 0.34-------------50 * 0.34 = 17 stocks
40%-------------trade size * 0.4--------------50 * 0.4 = 20 stocks
50%-------------trade size * 0.5--------------50 * 0.5 = 25 stocks
60%-------------trade size * 0.6--------------50 * 0.6 = 30 stocks
66%-------------trade size * 0.66-------------50 * 0.66 = 33 stocks
75%-------------trade size * 0.75-------------50 * 0.75 = 37.5(~38) stocks
80%-------------trade size * 0.8--------------50 * 0.8 = 40 stocks
100%------------trade size--------------------50 = 50 stocks
-----------------------------------------------------------------------
If for any reason a portion of the current/remaining trade closed at such occurrence was slightly wrong, it is not an issue. Such occurrences are rare and with slight difference in partial TP closed is not significant to overall performance of our algorithms.
||||||||||||||||||||||||||||||||||| *** ||||||||||||||||||||||||||||||||||| *** |||||||||||||||||||||||||||||||||||
||||||||||||||||||||||||||||||||||| *** ||||||||||||||||||||||||||||||||||| *** |||||||||||||||||||||||||||||||||||
Alert Settings (you don’t have to touch this section unless you will be using TradingView alerts through a Webhook to use with trading bot)
---------------------------------------------------------------------------
Here is how a LONG OPEN alert looks like.
NOTE: Each label , , etc. is customizable, you can change the text of it within indicator Input settings.
ALERT >>>>>>>>>>>>>>>>>>>>>>>>>>>>>>>>>>>>>>>>>>>>>>>
COIN: BTCUSD
TIMEFRAME: 15M
LONG: OPEN
ENTRY: 20000
TP1: 20500
TP2: 21000
TP3: 21500
TP4: 22500
TP5: 23500
SL: 19000
Leverage: 0
---------------------------------------------------------------------------
Here is how a TP1 alert will look with 5 TPs breakdown of the trade.
NOTE1: Next to TP1 taken it will show at which price it was triggered.
NOTE2: Next to "TP Percentage" it shows how much of the CURRENT/ACTIVE/REMAINING trade needs to be closed.
NOTE2: If TP2/3/4/5 comes before TP1 - the alert will tell you exactly how many percent of the trade needs to be closed!
ALERT >>>>>>>>>>>>>>>>>>>>>>>>>>>>>>>>>>>>>>>>>>>>>>>
COIN: BTCUSD
TIMEFRAME: 15M
LONG: TP1
TP1: 20500
TP Percentage: 20%
---------------------------------------------------------------------------
Here is how an alert will look for LONG - STOP-LOSS.
ALERT >>>>>>>>>>>>>>>>>>>>>>>>>>>>>>>>>>>>>>>>>>>>>>>
COIN: BTCUSD
TIMEFRAME: 15M
ENTRY: 20000
LONG: SL
SL: 19000
---------------------------------------------------------------------------
Here is how an alert will look for LONG - EOD (End of Day) In Profit close.
ALERT >>>>>>>>>>>>>>>>>>>>>>>>>>>>>>>>>>>>>>>>>>>>>>>
COIN: BTCUSD
TIMEFRAME: 15M
LONG: EOD-Close (profit)
ENTRY: 20000
EOD-Close: 21900
===========================================================================
Adding Alerts in TradngView
---------------------------------------------------------------------------
-Add indicator to chart and make sure the correct strategy is configured (check Backtesting results)
-Right-click anywhere on the TradingView chart
-Click on Add alert
-Condition: Select this indicator by it’s name
-Immediately below, change it to "alert() function calls only", as other wise there will be 2 alerts for every alert!
-Expiration: Open-ended (that may require higher tier TradingView account, otherwise the alert will need to be occasionally re-triggered)
-Alert name: Whatever you desire
-Hit “Create”
-Note: If you change ANY Settings within the indicator – you must DELETE the current alert and create a new one per steps above, otherwise it will continue triggering alerts per old Settings!
===========================================================================
If you have any questions or issues with the indicator, please message me directly via TradingView.
---------------------------------------------------------------------------
Good Luck! (NOTE: Trading is very risky, past performance is not necessarily indicative of future results, so please trade responsibly!)
---------------------------------------------------------------------------
NOTE: There seems to be a strange glitch when strategy is running live, it will show "double-take" take-profits labels on the chart. This is not affecting the script logic and backtesting results, if you simply change the timeframe real quick to something else then back - it will no longer show the duplicate orders... this must be some sort of a glitch as every alert was thoroughly tested to make sure everything is working!

TASC 2023.09 The Weekly Factor█ OVERVIEW
TASC's September 2023 edition of Traders' Tips features an article written by Andrea Unger titled “The Weekly Factor", discussing the application of price patterns as filters for trade entries. This script implements a sample trading strategy presented in the article for demonstration purposes only. It explores how the strategy's equity curve might benefit from filtering trade entries using a specific price pattern.
█ CONCEPTS
Pattern filters represent valuable tools that assess current market conditions based on price movements and determine when those conditions become more favorable for trade entries.
The filter used and tested in this article is a metric called the "weekly factor", which measures the price range over the last five trading days and compares it to the open of the session five days ago and the close of the session one day ago (i.e., the "body" of the five-day period). When the five-day body is small compared to the five-day range, this could indicate "indecision" or "compression", potentially followed by a price expansion. Thus, the weekly factor metric can help identify areas in the market where a period of compression might signal a potential breakout.
This script demonstrates the use of the weekly factor for a sample intraday trading strategy (intended for educational and exploratory purposes only). In this strategy, the entry signal is triggered when a 15-minute bar breaks out of the previous day's high-low range, and the position is closed at the end of the day.
█ CALCULATIONS
The script uses two timeframes:
• The strategy entries are processed on the 15-minute timeframe.
• The weekly factor is obtained from the daily timeframe using the request.security function and the following formula:
math.abs(open - close ) < RangeFilter * (ta.highest(5) - ta.lowest(5) )
Here, RangeFilter is an input that can be optimized to find the favorable ratio between the five-day body and the five-day range. Smaller RangeFilter values will lead to fewer trade entries. A RangeFilter value of 1 is equivalent to turning off the filtering altogether.

[Camarilla Pivots] Signal Clean Up Analysis with Backtest (TSO)Camarilla Pivots NEW GEN Indicator!
This is a full-cycle trading system indicator, which uses Camarilla Pivots for generating signals using a custom developed algorithm, TP (Take Profit) and SL (Stop Loss) levels. There are 3 SOURCES for signals (each can be used separately or in combination or all 3 can be used at the same time, each signal SOURCE is using Camarilla Pivots levels to open optimal trade direction) with chained (NOTE: There are many potential profitable setups available, by combining clean up features availabe in the indicator settings!) signal cleanup and analysis approach with scheduling and alerting capabilities. Works best with shorter timeframes: 1M, 5M, 15M, 1H.
NOTE: Every calculation is done on a confirmed closed candle bar state, so the indicator will never repaint!
NOTE: At position open - there will be calculated Take-Profit and Stop-Loss targets, however each target is considered hit, when candle bar closes breaking that target, so Take-Profit and Stop-Loss when hit will slightly differ then what you see at position open!
===========================================================================
Explanation of all the Features | Configuration Guide | Indicator Settings | Signal Cleanup Analysis
---------------------------------------------------------------------------
>>> Customizable Backtesting for a specific date range, results via TradingView strategy, which includes “Deep Backtesting” for largest amounts of data on trading results.
>>> Trading Schedule with customizable trading daily time range, automatic closing/alert trades before Power Hour or right before market closes or leave it open until next day.
>>> 3 Trading Systems.
>>> Multiple Signal SOURCEs for opening trades, either SOURCE can be used or both at the same time!
>>> Static/Dynamic Stop-Loss setups (HIGHLIGHT: Stop-Loss will be moved to Entry after TP1 is taken, which minimizes risk).
>>> Single or Multiple profit targets (up to 5).
>>> Take-Profit customizable offset feature (set your Take-Profit targets slightly before everyone is expecting it!).
>>> Candle bar signal analysis (matching candle color, skip opposite structured and/or doji candle uncertain signals).
>>> Additional analysis of VWAP/EMA/ATR/EWO (Elliot Wave Oscillator)/Divergence MACD+RSI/Volume signal confirmation (clean up your chart with indicator showing only the best potential signals!).
>>> Advanced Alerts setup, which can be potentially setup with a trading bot over TradingView Webhook (NOTE: This will require advanced programming knowledge).
===========================================================================
Labels, plots, colors explanations:
---------------------------------------------------------------------------
>>>>> LONG open: green "house" looking arrow below candle bar.
>>>>> SHORT open: red "house" looking arrow above candle bar.
>>>>> LONG/SHORT take-profit target: green/red circles (multi-profit > TP2/3/4/5 smaller circles).
>>>>> LONG/SHORT stop-loss target: green/red + crosses.
>>>>> LONG/SHORT take-profit hits: green/red diamonds.
>>>>> LONG/SHORT stop-loss hits: green/red X-crosses.
>>>>> LONG/SHORT EOD (End of Day | Intraday style) close (profitable trade): green/red squares.
>>>>> LONG/SHORT EOD (End of Day | Intraday style) close (loss trade): green/red PLUS(+)-crosses.
===========================================================================
Date Range and Trading Schedule Settings
---------------------------------------------------------------------------
>>>>> Date Range: Select your start and/or end dates (uncheck “End” for indicator to show results up to the very moment and to use for LIVE trading) for backtesting results, if not using backtesting – uncheck “Start”/“End” to turn it off.
>>>>> Use TradingView “Strategy Tester” to see backtesting results
NOTE: If Strategy Tester does not show any results with Date Ranged fully unchecked, there may be an issue where a script opens a trade, but there is not enough TradingView power to set the Take-Profit and Stop-Loss and somehow an open trade gets stuck and never closes, so there are “no trades present”. In such case you will need to manually check “Start”/“End” dates or use “Depp Backtesting” feature!
>>>>> Trading Schedule: This is where you can setup Intraday Session or any custom session schedule you wish. Turn it ON. Select trading hours. Select EOD (End of Day) setting (NOTE: If it will be OFF, the indicator will assume you are holding your position open until next day!). Please note the EOD trade closure times with the 2 different Intraday close settings when turned on:
At Market Close:
1/3/5min > will close at 15:55pm ET
15min > will close at 15:45pm ET
30min > will close at 15:30pm ET
45min > will close at 15:45pm ET
60min > will close at 15:00pm ET
Before Power Hour:
1/3/5min > will close at 15:00pm ET
15min > will close at 15:00pm ET
30min > will close at 15:00pm ET
45min > will close at 15:00pm ET
60min > will close at 15:00pm ET
>>> Trading Systems: 1) "Open Until Closed by TP or SL": the signal will only open a trade if no trades are currently open/trunning, a trade can only be closed by Take Profit, Stop Loss or End of Day close (if turned on) | 2) "Open Until Closed by TP or SL + OCA": Same as 1), but if there is an opposite signal to the trade which is currently open > it will immediately be closed with new trade open or End of Day close (if turned on) | 3) "OCA (no TP or SL)": There are is Take Profit or Stop Loss, only an opposite signal will close current trade and open an opposite one or End of Day close (if turned on).
>>> Position Open sources:
>>>>> Position Open - SOURCE1 | LONG: S3, SL: S4, TP1: R3, TP2: R4, TP3: R5, TP4/5: Smart Formula | SHORT: R3, SL: R4, TP1: S3, TP2: S4, TP3: S5, TP4/5: Smart Formula
>>>>> Position Open - SOURCE2 | LONG: R4, SL: R3, TP1: R5, TP2/3/4/5: Smart Formula | SHORT: S4, SL: S3, TP1: S5, TP2/3/4/5: Smart Formula
>>>>> Position Open - SOURCE3 | LONG: R5, SL: R4, TP1/2/3/4/5: Smart Formula | SHORT: S5, SL: S4, TP1/2/3/4/5: Smart Formula
>>> Turn On/Off: Current Position SL + Opposite Position Open Signal on the same closing candle bar (If current trade hits Stop-Loss and at that same closing candle bar there is a signal for an opposite direction trade > indicator will close current position as Stop-Loss and immediately open an opposite position). NOTE: With this option turned on, there will be more trades, but not necessarily better results, since after Stop-Loss is hit, it may make sense to wait a little before opening an opposite trade, even if it matches the condition at the same time when Stop-Loss is hit, but sometimes it shows great results, so this setting/feature is included.
>>> Turn On/Off: Turn On/Off: Current Position REGULAR SL | Only the SL + Opposite Position Open will trigger if turned on, IF NOT - THERE WILL BE NO STOP-LOSS AT ALL!!! NOTE: It is very dangerous to trade without Stop-Loss!
>>>>> Signal Candle Bar consuming Take-Profits - position/trade signal candle bar is big enought to "consume"/close ahead the first TP setting > the signal can either be skipped, or all Take-Profit areas pushed ahead using smart formula)
>>>>> MULTIPROFIT | TP (Take-Profit) System: Once the trade is open, all Take-Profit target(s) are immediately calculated and set for the trade > once the target(s) is hit > trade will be partially closed (if candle bar closes beyond several Take-Profit targets > trade will be reduced accordingly to the amount of how many Take-Profit targets were hit)
>>>>> MULTIPROFIT | SL (Stop-Loss) System: 1) Static – Once the trade is open, Stop-Loss is calculated and set for the remaining of the trade ||| 2) Dynamic – At trade open, Stop-Loss is calculated and set the same way, however once 1st Take-Profit is taken > Stop-Loss is moved to Entry, reducing the risk.
>>>>> # of TPs (number of take profit targets): Just like it is named, this is where you select the number of Take-Profit targets for your trading system (NOTE: If "OCA (no TP or SL)" Trading System is selected, this setting won’t do anything, since there are no TP or SLs for that system).
>>>>> TP(s) offset: This is a special feature for all Take-Profit targets, where you can turn on a customizable offset, so that if the price is almost hitting the Take-Profit target, but never actually touches it > you will capture it. This is good to use with HHLL (Highest High Lowest Low), which is pretty much a Support/Resistance as often the price will nearly touch these strong areas and turn around…
===========================================================================
Signal Analysis and Cleanup Settings
---------------------------------------------------------------------------
>>>>> Candle Analysis | Candle Color signal confirmation: If closed candle bar color does not match the signal direction > no trade will be open.
>>>>> Candle Analysis | Skip opposite candle signals: If closed candle bar color will match the signal direction, but candle structure will be opposite (for example: bearish green hammer, long high stick on top of a small green square) > no trade will be open.
>>>>> Candle Analysis | Skip doji candle signals: If closed candle bar will be the uncertain doji > no trade will be open.
>>>>> Divergence/Oscillator Analysis | EWO (Elliot Wave Oscillator) signal confirmation: LONG will only be open if at signal, EWO is green or will be at bullish slope (you can select which setting you desire), SHORT if EWO is red or will be at bearish slope.
>>>>> Divergence/Oscillator Analysis | VWAP signal confirmation: LONG will only be open if at signal, the price will be above VWAP, SHORT if below.
>>>>> Divergence/Oscillator Analysis | Moving Average signal confirmation: LONG will only be open if at signal, the price will be above selected Moving Average, SHORT if below.
>>>>> Divergence/Oscillator Analysis | ATR signal confirmation: LONG will only be open if at signal, the price will be above ATR, SHORT if below.
>>>>> Divergence/Oscillator Analysis | RSI + MACD signal confirmation: LONG will only be open if at signal, RSI + MACD will be bullish, SHORT if RSI + MACD will be bearish.
>>>>> Volume signal confirmation: LONG/SHORT will only be opened with strong Volume matching the signal direction, by default, strong Volume percentage is set to 150% and weak to 50%, but you can change it as you desire.
===========================================================================
||||||||||||||||||||||||||||||||||| *** ||||||||||||||||||||||||||||||||||| *** |||||||||||||||||||||||||||||||||||
||||||||||||||||||||||||||||||||||| *** ||||||||||||||||||||||||||||||||||| *** |||||||||||||||||||||||||||||||||||
TP System - VERY IMPORTANT INFO!
-------------------------------------------------------------------------------------------------------------------
"TP PERCENTAGE" - amount by which current trade/position needs to be reduced/partially closed/sold.
-------------------------------------------------------------------------------------------------------------------
TP System: Dynamic
"TP PERCENTAGE" - will always be the same amount (trade/position size divided by the # of take-profit(TP) targets) and percentage to be closed will always be of the ORIGINAL trade/position.
-------------------------------------------------------------------------------------------------------------------
TP System: Static
"TP PERCENTAGE" - will always be the same amount IF take-profit(TP) targets are hit 1-by-1 (TP1 > TP2 > TP3 > TP4 > TP5), otherwise it will vary and unless it is a 1st take-profit(TP1), the REMAINING trade/position size will always be smaller than original and therefore the percentage to be closed will always be of the REMAINING trade/position and NOT the original one!
-------------------------------------------------------------------------------------------------------------------
"TP PERCENTAGE" CheatSheet (these are the only percentages you may see)
-----------------------------------------------------------------------
TP PERCENTAGE---Close/Sell Amount-------------Example (trade size: 50 stocks)
20%-------------trade size * 0.2--------------50 * 0.2 = 10 stocks
25%-------------trade size * 0.25-------------50 * 0.25 = 12.5(~13) stocks
34%-------------trade size * 0.34-------------50 * 0.34 = 17 stocks
40%-------------trade size * 0.4--------------50 * 0.4 = 20 stocks
50%-------------trade size * 0.5--------------50 * 0.5 = 25 stocks
60%-------------trade size * 0.6--------------50 * 0.6 = 30 stocks
66%-------------trade size * 0.66-------------50 * 0.66 = 33 stocks
75%-------------trade size * 0.75-------------50 * 0.75 = 37.5(~38) stocks
80%-------------trade size * 0.8--------------50 * 0.8 = 40 stocks
100%------------trade size--------------------50 = 50 stocks
-----------------------------------------------------------------------
If for any reason a portion of the current/remaining trade closed at such occurrence was slightly wrong, it is not an issue. Such occurrences are rare and with slight difference in partial TP closed is not significant to overall performance of our algorithms.
||||||||||||||||||||||||||||||||||| *** ||||||||||||||||||||||||||||||||||| *** |||||||||||||||||||||||||||||||||||
||||||||||||||||||||||||||||||||||| *** ||||||||||||||||||||||||||||||||||| *** |||||||||||||||||||||||||||||||||||
Alert Settings (you don’t have to touch this section unless you will be using TradingView alerts through a Webhook to use with trading bot)
---------------------------------------------------------------------------
Here is how a LONG OPEN alert looks like.
NOTE: Each label , , etc. is customizable, you can change the text of it within indicator Input settings.
ALERT >>>>>>>>>>>>>>>>>>>>>>>>>>>>>>>>>>>>>>>>>>>>>>>
COIN: BTCUSD
TIMEFRAME: 15M
LONG: OPEN
ENTRY: 20000
TP1: 20500
TP2: 21000
TP3: 21500
TP4: 22500
TP5: 23500
SL: 19000
Leverage: 0
---------------------------------------------------------------------------
Here is how a TP1 alert will look with 5 TPs breakdown of the trade.
NOTE1: Next to TP1 taken it will show at which price it was triggered.
NOTE2: Next to "TP Percentage" it shows how much of the CURRENT/ACTIVE/REMAINING trade needs to be closed.
NOTE2: If TP2/3/4/5 comes before TP1 - the alert will tell you exactly how many percent of the trade needs to be closed!
ALERT >>>>>>>>>>>>>>>>>>>>>>>>>>>>>>>>>>>>>>>>>>>>>>>
COIN: BTCUSD
TIMEFRAME: 15M
LONG: TP1
TP1: 20500
TP Percentage: 20%
---------------------------------------------------------------------------
Here is how an alert will look for LONG - STOP-LOSS.
ALERT >>>>>>>>>>>>>>>>>>>>>>>>>>>>>>>>>>>>>>>>>>>>>>>
COIN: BTCUSD
TIMEFRAME: 15M
ENTRY: 20000
LONG: SL
SL: 19000
---------------------------------------------------------------------------
Here is how an alert will look for LONG - EOD (End of Day) In Profit close.
ALERT >>>>>>>>>>>>>>>>>>>>>>>>>>>>>>>>>>>>>>>>>>>>>>>
COIN: BTCUSD
TIMEFRAME: 15M
LONG: EOD-Close (profit)
ENTRY: 20000
EOD-Close: 21900
===========================================================================
Adding Alerts in TradngView
---------------------------------------------------------------------------
-Add indicator to chart and make sure it is configured (check back-testing results)
-Right-click anywhere on the TradingView chart
-Click on Add alert
-Condition: Select this indicator by it’s name
-Alert name: Whatever you want
-Hit “Create”
-Note: If you change ANY Settings within the indicator – you must DELETE the current alert and create a new one per steps above, otherwise it will continue triggering alerts per old Settings!
===========================================================================
If you have any questions or issues with the indicator, please message me directly via TradingView.
---------------------------------------------------------------------------
Good Luck! (NOTE: Trading is very risky, past performance is not necessarily indicative of future results, so please trade responsibly!)
---------------------------------------------------------------------------
NOTE: There seems to be a strange glitch when strategy is running live, it will show "double-take" take-profits labels on the chart. This is not affecting the script logic and backtesting results, if you will remove/re-add the script afterwards, it will no longer show the duplicate orders... this must be some sort of a glitch as every alert was thoroughly tested to make sure everything is working!

[Volume Profile] Signal Clean Up Analysis with Backtest (TSO) This is a full-cycle trading system indicator, which uses Volume Profile for generating signals using a custom developed algorithm, TP (Take Profit) and SL (Stop Loss) levels. There are 2 SOURCES for signals (each can be used separately or both can be used at the same time, each signal SOURCE is using Volume Profile levels to open optimal trade direction) with chained (NOTE: You can select several or ALL of the features, this is not limited to either one) signal cleanup and analysis approach with scheduling and alerting capabilities. Works with most popular timeframes: 1M, 5M, 15M, 1H, 4H, D, great for intraday trading!
NOTE: Every calculation is done on a confirmed closed candle bar state, so the indicator will never repaint!
===========================================================================
Explanation of all the Features | Configuration Guide | Indicator Settings | Signal Cleanup Analysis
---------------------------------------------------------------------------
>>> Customizable Backtesting for a specific date range, results via TradingView strategy, which includes “Deep Backtesting” for largest amounts of data on trading results.
>>> Trading Schedule with customizable trading daily time range, automatic closing/alert trades before Power Hour or right before market closes or leave it open until next day.
>>> 3 Trading Systems.
>>> Multiple Signal SOURCEs for opening trades, either SOURCE can be used or both at the same time!
>>> Static/Dynamic Stop-Loss setups (HIGHLIGHT: Stop-Loss will be moved to Entry after TP1 is taken, which minimizes risk).
>>> Single or Multiple profit targets (up to 3).
>>> Take-Profit customizable offset feature (set your Take-Profit targets slightly before everyone is expecting it!).
>>> Candle bar signal analysis (matching candle color, skip opposite structured and/or doji candle uncertain signals).
>>> Additional analysis of VWAP/EMA/ATR/EWO (Elliot Wave Oscillator)/Divergence MACD+RSI/Volume signal confirmation (clean up your chart with indicator showing only the best potential signals!).
>>> Advanced Alerts setup, which can be potentially setup with a trading bot over TradingView Webhook (NOTE: This will require advanced programming knowledge).
===========================================================================
Labels, plots, colors explanations:
---------------------------------------------------------------------------
>>>>> Signal SOURCE(s): Green/Red arrows, which will be shown unconditionally, outside of trade engine and can be hidden if desired.
>>>>> LONG open: green "house" looking arrow below candle bar.
>>>>> SHORT open: red "house" looking arrow above candle bar.
>>>>> LONG/SHORT take-profit target: green/red circles (multi-profit > TP2/3/4/5 smaller circles).
>>>>> LONG/SHORT take-profit hits: green/red diamonds.
>>>>> LONG/SHORT stop-loss target: green/red + crosses.
>>>>> LONG/SHORT stop-loss hits: green/red X-crosses.
>>>>> LONG/SHORT EOD close (profitable trade): green/red squares.
>>>>> LONG/SHORT EOD close (loss trade): green/red PLUS(+)-crosses.
===========================================================================
Date Range and Trading Schedule Settings
---------------------------------------------------------------------------
>>>>> Date Range: Select your start and/or end dates (uncheck “End” for indicator to show results up to the very moment and to use for LIVE trading) for backtesting results, if not using backtesting – uncheck “Start”/“End” to turn it off.
>>>>> Use TradingView “Strategy Tester” to see backtesting results
NOTE: If Strategy Tester does not show any results with Date Ranged fully unchecked, there may be an issue where a script opens a trade, but there is not enough TradingView power to set the Take-Profit and Stop-Loss and somehow an open trade gets stuck and never closes, so there are “no trades present”. In such case you will need to manually check “Start”/“End” dates or use “Depp Backtesting” feature!
>>>>> Trading Schedule: This is where you can setup Intraday Session or any custom session schedule you wish. Turn it ON. Select trading hours. Select EOD (End of Day) setting (NOTE: If it will be OFF, the indicator will assume you are holding your position open until next day!).
>>> Trading Systems: 1) "Open Until Closed by TP or SL": the signal will only open a trade if no trades are currently open/trunning, a trade can only be closed by Take Profit, Stop Loss or End of Day close (if turned on) | 2) "Open Until Closed by TP or SL + OCA": Same as 1), but if there is an opposite signal to the trade which is currently open > it will immediately be closed with new trade open or End of Day close (if turned on) | 3) "OCA (no TP or SL)": There are is Take Profit or Stop Loss, only an opposite signal will close current trade and open an opposite one or End of Day close (if turned on)
>>>>> MULTIPROFIT | TP (Take-Profit) System: Once the trade is open, all Take-Profit target(s) are immediately calculated and set for the trade > once the target(s) is hit > trade will be partially closed (if candle bar closes beyond several Take-Profit targets > trade will be reduced accordingly to the amount of how many Take-Profit targets were hit)
>>>>> MULTIPROFIT | SL (Stop-Loss) System: 1) Static – Once the trade is open, Stop-Loss is calculated and set for the remaining of the trade ||| 2) Dynamic – At trade open, Stop-Loss is calculated and set the same way, however once 1st Take-Profit is taken > Stop-Loss is moved to Entry, reducing the risk.
>>>>> # of TPs (number of take profit targets): Just like it is named, this is where you select the number of Take-Profit targets for your trading system (NOTE: If "OCA (no TP or SL)" Trading System is selected, this setting won’t do anything, since there are no TP or SLs for that system).
>>>>> TP(s) offset: This is a special feature for all Take-Profit targets, where you can turn on a customizable offset, so that if the price is almost hitting the Take-Profit target, but never actually touches it > you will capture it. This is good to use with HHLL (Highest High Lowest Low), which is pretty much a Support/Resistance as often the price will nearly touch these strong areas and turn around…
===========================================================================
Take-Profit and Stop-Loss visual example:
---------------------------------------------------------------------------
1) A simply nice intraday trading day for SPY (S&P500 ETF TRUST) with a single Take-Profit target on each trade.
See how Take-Profit distances increase with price momentum and how Stop-Loss is following the trade reducing the risk!
2) Same intraday trading day for SPY (S&P500 ETF TRUST) with 3 Take-Profit targets with static Stop-Loss.
3) Same intraday trading day for SPY (S&P500 ETF TRUST) with 3 Take-Profit targets with dynamic Stop-Loss.
You can see how Stop-Loss was moved once TP1 is taken!
===========================================================================
Trade Analysis and Cleanup Settings
---------------------------------------------------------------------------
>>>>> Candle Analysis | Candle Color signal confirmation: If closed candle bar color does not match the signal direction > no trade will be open.
>>>>> Candle Analysis | Skip opposite candle signals: If closed candle bar color will match the signal direction, but candle structure will be opposite (for example: bearish green hammer, long high stick on top of a small green square) > no trade will be open.
>>>>> Candle Analysis | Skip doji candle signals: If closed candle bar will be the uncertain doji > no trade will be open.
>>>>> Divergence/Oscillator Analysis | EWO (Elliot Wave Oscillator) signal confirmation: LONG will only be open if at signal, EWO is green or will be at bullish slope (you can select which setting you desire), SHORT if EWO is red or will be at bearish slope.
>>>>> Divergence/Oscillator Analysis | VWAP signal confirmation: LONG will only be open if at signal, the price will be above VWAP, SHORT if below.
>>>>> Divergence/Oscillator Analysis | Moving Average signal confirmation: LONG will only be open if at signal, the price will be above selected Moving Average, SHORT if below.
>>>>> Divergence/Oscillator Analysis | ATR signal confirmation: LONG will only be open if at signal, the price will be above ATR, SHORT if below.
>>>>> Divergence/Oscillator Analysis | RSI + MACD signal confirmation: LONG will only be open if at signal, RSI + MACD will be bullish, SHORT if RSI + MACD will be bearish.
>>>>> Volume signal confirmation: LONG/SHORT will only be open if closing candle volume is 150% above average Volume based on the Volume Length.
===========================================================================
Alert Settings (you don’t have to touch this section unless you will be using TradingView alerts through a Webhook to use with trading bot)
---------------------------------------------------------------------------
Here is how a LONG OPEN alert looks like (each label is customizable + I can add up more items/labels if needed):
COIN: BTCUSD
TIMEFRAME: 15M
LONG: OPEN
ENTRY: 20000
TP1: 20500
TP2: 21000
TP3: 21500
SL: 19000
Leverage: 0
===========================================================================
Adding Alerts in TradngView
---------------------------------------------------------------------------
-Right-click anywhere on the TradingView chart
-Click on Add alert
-Condition: Select this indicator by it’s name
-Alert name: Whatever you want
-Hit “Create”
-Note: If you change ANY Settings within the indicator – you must DELETE the current alert and create a new one per steps above, otherwise it will continue triggering alerts per old Settings!
===========================================================================
If you have any questions or issues with the indicator, please message me directly via TradingView.
---------------------------------------------------------------------------
Good Luck! (NOTE: Trading is very risky, past performance is not necessarily indicative of future results, so please trade responsibly!)

[SMA Cross + HHLL] Signal Clean Up Analysis with Backtest (TSO) This is a DEMO indicator with a simple 2 SMAs cross for signals + HHLL for TP/SL. It mainly demonstrates chained (NOTE: You can select several or ALL of the features, this is not limited to either one) signal cleanup and analysis approach with scheduling and alerting capabilities. Works with most popular timeframes: 1M, 5M, 15M, 1H, 4H, D.
===========================================================================
Here are some pre-set examples with nice Backtesting results (try em out!):
---------------------------------------------------------------------------
>>> Indexes – SPY (INTRADAY SETUP ): Timeframe: 5M | Trading Schedule: ON, 10:00-15:45 ET, EOD: At Market Close | Trading System: Open Until Closed by TP or SL | MULTIPROFIT: TP (take profit) System: Dynamic | MULTIPROFIT: SL (stop loss) System (This is only for “Dynamic” TP System ONLY!!!): Dynamic | # of TPs: 5 | Skip opposite candle types in signals, which are opposite to direction of candle color (for example: bearish green hammer) | Everything else: Default
>>> Bitcoin – BTCUSD (24/7 SETUP): Timeframe: 1H | Trading Schedule: OFF, End of Day (EOD): OFF | Trading System: Open Until Closed by TP or SL | MULTIPROFIT: TP (take profit) System: Dynamic | MULTIPROFIT: SL (stop loss) System (This is only for “Dynamic” TP System ONLY!!!): Dynamic | # of TPs: 3 | TP(s) Offset: on, TP(s) offset amount: 50 | ATR confirmation | Everything else: Default
===========================================================================
Explanation of all the Features | Configuration Guide | Indicator Settings
---------------------------------------------------------------------------
---------------------------------------------------------------------------
Signal cleanup analysis:
---------------------------------------------------------------------------
>>> Customizable Backtesting for a specific date range, results via TradingView strategy, which includes “Deep Backtesting” for largest amounts of data on trading results.
>>> Trading Schedule with customizable trading daily time range, automatic closing/alert trades before Power Hour or right before market closes or leave it open until next day.
>>> 3 Trading Systems.
>>> Static/Dynamic Take-Profit setups (HILIGHT: momentum catch dynamic Take-Profit approach).
>>> Static/Dynamic Stop-Loss setups (HIGHLIGHT: smart trailing Stop-Loss which minimizes risk).
>>> Single or Multiple profit targets (up to 5).
>>> Take-Profit customizable offset feature (set your Take-Profit targets slightly before everyone is expecting it!).
>>> Candle bar signal analysis (skip opposite structured and/or doji candle uncertain signals).
>>> Additional analysis of VWAP/EMA/ATR/EWO (Elliot Wave Oscillator)/Divergence MACD+RSI signal confirmation (clean up your chart with indicator showing only the best potential signals!).
>>> Advanced Alerts setup, which can be potentially setup with a trading bot over TradingView Webhook (NOTE: This will require advanced programming knowledge).
>>> Customize your signal SOURCE and your Take-Profit/Stop-Loss SOURCES as you desire.
===========================================================================
Labels, plots, colors explanations:
---------------------------------------------------------------------------
>>>>> Signal SOURCE: SMA crossings (green and red BIG circles) .
>>>>> Take-profit/Stop-loss SOURCE: HHLL (Highest High Lowest Low) .
>>>>> LONG open: green arrow below candle bar.
>>>>> SHORT open: red arrow above candle bar.
>>>>> LONG/SHORT take-profit target: green/red circles (multi-profit > TP2/3/4/5 smaller circles).
>>>>> LONG/SHORT take-profit hits: green/red diamonds.
>>>>> LONG/SHORT stop-loss target: green/red + crosses.
>>>>> LONG/SHORT stop-loss hits: green/red X-crosses.
>>>>> LONG/SHORT EOD close (profitable trade): green/red squares.
>>>>> LONG/SHORT EOD close (loss trade): green/red PLUS(+)-crosses.
===========================================================================
Date Range and Trading Schedule Settings
---------------------------------------------------------------------------
>>>>> Date Range: Select your start and/or end dates (uncheck “End” for indicator to show results up to the very moment and to use for LIVE trading) for backtesting results, if not using backtesting – uncheck “Start”/“End” to turn it off.
---------------------------------------------------------------------------
>>>>> Use TradingView “Strategy Tester” to see backtesting results
---------------------------------------------------------------------------
NOTE: If Strategy Tester does not show any results with Date Ranged fully unchecked, there may be an issue where a script opens a trade, but there is not enough TradingView power to set the Take-Profit and Stop-Loss and somehow an open trade gets stuck and never closes, so there are “no trades present”. In such case you will need to manually check “Start”/“End” dates or use “Depp Backtesting” feature!
---------------------------------------------------------------------------
>>>>> Trading Schedule: This is where you can setup Intraday Session or any custom session schedule you wish. Turn it ON. Select trading hours. Select EOD (End of Day) setting (NOTE: If it will be OFF, the indicator will assume you are holding your position open until next day!).
>>>>> Trading System: 1) Open Until Closed by TP or SL – once the trade is open, it can only be closed by Take-Profit, Stop-Loss or at EOD (if turned on) ||| 2) OCA – Opposite Trade will Open Closing Current Trade – Same as 1), except that when and if an OPPOSITE signal is received > indicator will close current trade immediately (profit or loss) and open a new one(NOTE: This will only happen with an OPPOSITE direction trade!) ||| 3) Open Until Opposite Signal or EOD (if turned on) – This approach is the simplest one, there are no Take-Profits or Stop-Losses, the trade is open until an OPPOSITE signal is received or until EOD (if turned on).
Take-Profit, Stop-Loss and Multi-Profit Settings
>>>>> MULTIPROFIT | TP (Take-Profit) System: 1) Static – Once the trade is open, all Take-Profit target(s) are immediately calculated and set for the trade > once the target(s) is hit > trade will be partially closed (if candle bar closes beyond several Take-Profit targets > trade will be reduced accordingly to the amount of how many Take-Profit targets were hit) ||| 2) Dynamic – Once the trade is open, only the 1st Take-Profit target is calculated, once the 1st Take-Profit is hit > next Take-Profit distance is calculated based on the distance from trade Entry to where 1st Take-Profit was taken, once 2nd Take-Profit is taken > 3rd Take-Profit is calculated per same logic, these are good for price momentum as with price speeding up – profits increase as well!
NOTE: Below 2 settings, each correspond to only 1 setting of the TP (Take-Profit) System, please pay attention to the above TP system setting before changing SL settings!
>>>>> MULTIPROFIT | SL (Stop-Loss) System : 1) Static – Once the trade is open, Stop-Loss is calculated and set for the remaining of the trade ||| 2) Dynamic – At trade open, Stop-Loss is calculated and set the same way, however once 1st Take-Profit is taken > Stop-Loss is moved to Entry, reducing the risk.
>>>>> MULTIPROFIT | SL (Stop-Loss) System : 1) Static - Once the trade is open, Stop-Loss is calculated and set for the remaining of the trade ||| 2) Dynamic – At trade open, Stop-Loss is calculated and set the same way, however with each Take-Profit taken, Stop-Loss will be moved to previous Take-Profit (TP1 taken > SL:Entry | TP2 taken > SL:TP1 | TP3 taken > SL:TP2 | TP4 taken > SL:TP3 | TP5 taken > trade closed), this is basically a smart Stop-Loss trailing system!
>>>>> # of TPs (number of take profit targets): Just like it is named, this is where you select the number of Take-Profit targets for your trading system (NOTE: If “3) Open Until Opposite Signal or EOD (if turned on)” Trading System is selected, this setting won’t do anything, since there are no TP or SLs for that system).
>>>>> TP(s) offset: This is a special feature for all Take-Profit targets, where you can turn on a customizable offset, so that if the price is almost hitting the Take-Profit target, but never actually touches it > you will capture it. This is good to use with HHLL (Highest High Lowest Low), which is pretty much a Support/Resistance as often the price will nearly touch these strong areas and turn around…
---------------------------------------------------------------------------
Dynamic/Static Take-Profit and Stop-Loss visual examples:
1) Fully Dynamic Take-Profit and Stop-Loss setup for BTCUSD
See how Take-Profit distances increase with price momentum and how Stop-Loss is following the trade reducing the risk!
2) Static/Dynamic, Static Take-Profit and Dynamic Stop-Loss setup for SPY (S&P500 ETF TRUST)
You can see a static Take-Profit set at position open, while Stop-Loss is semi-dynamic adjusting to Entry once TP1 target is taken!
3) Fully Static Take-Profit and Stop-Loss setup for SPY (S&P500 ETF TRUST)
This one is a fully static setup for both Take-Profit and Stop-Loss, you can also observe how trade is closed right before the Power Hour (trade can be closed right before Power Hour or right before Market Closes or left overnight as you desire).
---------------------------------------------------------------------------
Trade Analysis and Cleanup Settings
>>>>> Candle Analysis | Candle Color signal confirmation: If closed candle bar color does not match the signal direction > no trade will be open.
>>>>> Candle Analysis | Skip opposite candle signals: If closed candle bar color will match the signal direction, but candle structure will be opposite (for example: bearish green hammer, long high stick on top of a small green square) > no trade will be open.
>>>>> Candle Analysis | Skip doji candle signals: If closed candle bar will be the uncertain doji > no trade will be open.
>>>>> Divergence/Oscillator Analysis | EWO (Elliot Wave Oscillator) signal confirmation: LONG will only be open if at signal, EWO is green or will be at bullish slope (you can select which setting you desire), SHORT if EWO is red or will be at bearish slope.
>>>>> Divergence/Oscillator Analysis | VWAP signal confirmation: LONG will only be open if at signal, the price will be above VWAP, SHORT if below.
>>>>> Divergence/Oscillator Analysis | Moving Average signal confirmation: LONG will only be open if at signal, the price will be above selected Moving Average, SHORT if below.
>>>>> Divergence/Oscillator Analysis | ATR signal confirmation: LONG will only be open if at signal, the price will be above ATR, SHORT if below.
>>>>> Divergence/Oscillator Analysis | RSI + MACD signal confirmation: LONG will only be open if at signal, RSI + MACD will be bullish, SHORT if RSI + MACD will be bearish.
===========================================================================
Alert Settings (you don’t have to touch this section unless you will be using TradingView alerts through a Webhook to use with trading bot)
---------------------------------------------------------------------------
Here is how a LONG OPEN alert looks like (each label is customizable + I can add up more items/labels if needed):
COIN: BTCUSD
TIMEFRAME: 15M
LONG: OPEN
ENTRY: 20000
TP1: 20500
TP2: 21000
TP3: 21500
SL: 19000
Leverage: 0
===========================================================================
Trade Open Signal SOURCE + Take-Profit/Stop-Loss SOURCE
---------------------------------------------------------------------------
>>> Customize your signal SOURCE, Take-Profit and Stop-Loss SOURCE as desired (NOTE: These are pre-configured and should be usable on majority of markets, however feel free to play around with these settings as there is nearly an infinite amount of setups out there!
===========================================================================
Adding Alerts in TradngView
---------------------------------------------------------------------------
-Right-click anywhere on the TradingView chart
-Click on Add alert
-Condition: Select this indicator by it’s name
-Alert name: Whatever you want
-Hit “Create”
-Note: If you change ANY Settings within the indicator – you must DELETE the current alert and create a new one per steps above, otherwise it will continue triggering alerts per old Settings!
===========================================================================
If you have any questions or issues with the indicator, please message me directly via TradingView.
---------------------------------------------------------------------------
Good Luck! (NOTE: Trading is very risky, so please trade responsibly!)
