BSL/SSL Sweep + FVG Strategy Jobin (c) The New York ATM Model is a structured intraday strategy designed to capture algorithmic stop-hunts and reversals during the New York session open. It focuses on liquidity sweeps—either Buy-Side or Sell-Side—followed by a confirmation using Fair Value Gaps (FVGs).
Cari dalam skrip untuk "session"

Hilly's 0010110 Reversal Scalping Strategy - 5 Min CandlesKey Features and Rationale:
Timeframe: Restricted to 5-minute candles as requested.
Pattern Integration: Includes single (Hammer, Shooting Star, Doji), two (Engulfing, Harami), and three-plus (Morning Star, Evening Star) candlestick patterns, plus reversal patterns based on RSI extremes.
VWAP Cross: Incorporates bullish (price crosses above VWAP) and bearish (price crosses below VWAP) signals, enhanced by trend context.
Volume Analysis: Uses a volume spike threshold to filter noise, with a simple day-start volume comparison for financial environment context.
Financial Environment: Approximates the day's sentiment using early-hour volume compared to current volume, adjusted by trend.
Aggregation: Scores each condition (e.g., 1 for basic patterns, 2 for strong patterns like Engulfing, 3 for three-candle patterns) and decides based on weighted consensus, with trendStrength as a tunable threshold.
Risky Approach: Minimal filtering and a low trendStrength (default 0.5) allow frequent signals, aligning with your $100-to-$200 goal, but expect higher risk.
Suggested Inputs:
EMA Length: 10 (short enough for 5-minute sensitivity).
VWAP Lookback: 1 (uses current session VWAP).
Volume Threshold Multiplier: 1.2 (moderate spike requirement).
RSI Length: 14 (standard, adjustable to 7 for more sensitivity).
Trend Strength Threshold: 0.5 (balance between signals; lower to 0.4 for more trades, raise to 0.6 for fewer).


QZ Trend (Crypto Edition) v1.1a: Donchian, EMA, ATR, Liquidity/FThe "QZ Trend (Crypto Edition)" is a rules-based trend-following breakout strategy for crypto spot or perpetual contracts, focusing on following trends, prioritizing risk control, seeking small losses and big wins, and trading only when advantageous.
Key mechanisms include:
- Market filters: Screen favorable conditions via ADX (trend strength), dollar volume (liquidity), funding fee windows, session/weekend restrictions, and spot-long-only settings.
- Signals & entries: Based on price position relative to EMA and EMA trends, combined with breaking Donchian channel extremes (with ATR ratio confirmation), plus single-position rules and post-exit cooldowns.
- Position sizing: Calculate positions by fixed risk percentage; initial stop-loss is ATR-based, complying with exchange min/max lot requirements.
- Exits & risk management: Include initial stop-loss, trailing stop (tightens only), break-even rule (stop moves to entry when target floating profit is hit), time-based exit, and post-exit cooldowns.
- Pyramiding: Add positions only when profitable with favorable momentum, requiring ATR-based spacing; add size is a fraction of the base position, with layers sharing stop logic but having unique order IDs.
Charts display EMA, Donchian channels, current stop lines, and highlight low ADX, avoidable funding windows, and low-liquidity periods.
Recommend starting with 4H or 1D timeframes, with typical parameters varying by cycle. Liquidity settings differ by token; perpetuals should enable funding window filters, while spot requires "long-only" and matching fees. The strategy performs well in trends with quick stop-losses but faces whipsaws in ranges (filters mitigate but don’t eliminate noise). Share your symbol and timeframe for tailored parameters.

Sr.Ram.GodSoun.Market StructureDisclaimer: This chart is for educational purposes only. Please do your own due diligence — this is not trade advice. Any signals for buys, sells, calls, or puts are purely strategy outputs and should not be considered trading recommendations.
This strategy is designed for "SPY" and "QQQ" on a 3-minute time frame. It is built on market-structure breakouts, identifying swing highs and lows using a configurable Market Structure Duration.
A bullish breakout triggers a Calls (long) entry, while a bearish breakout triggers a Puts (short) entry.
Signals are filtered with session-based exclusions, ensuring no entries or exits occur during the following EST time windows:
09:30 – 09:45
12:00 – 13:00
15:30 – 16:00
Risk management is enforced through percentage-based exits:
Close Longs and switch to Puts if price moves 0.2%
Close Puts and switch to Calls if price moves 0.2%
The strategy also incorporates re-entry logic after a stop-out:
Re-enter Puts on a further 0.3% breakdown.
Re-enter Calls on a further 0.3% breakout.
Built-in alerts cover all entries, exits, and re-entries, enabling seamless use with automated trading or notifications.

Tristan's Box: Pre-Market Range Breakout + RetestMarket Context:
This is designed for U.S. stocks, focusing on pre-market price action (4:00–9:30 AM ET) to identify key support/resistance levels before the regular session opens.
Built for 1 min and 5 min timelines, and is intended for day trading / scalping.
Core Idea:
Pre-market range (high/low) often acts as a magnet for price during regular hours.
The first breakout outside this range signals potential strong momentum in that direction.
Retest of the breakout level confirms whether the breakout is valid, avoiding false moves.
Step-by-Step Logic:
Pre-Market Range Identification:
Track high and low from 4:00–9:30 AM ET.
Draw a box spanning this range for visual reference and calculation.
Breakout Detection:
When the first candle closes above the pre-market high → long breakout.
When the first candle closes below the pre-market low → short breakout.
The first breakout candle is highlighted with a “YOLO” label for visual confirmation.
Retest Confirmation:
Identify the first candle whose wick touches the pre-market box (high touches top for short, low touches bottom for long).
Wait for the next candle: if it closes outside the box, it confirms the breakout.
Entry Execution:
Long entry: on the confirming candle after a wick-touch above the pre-market high.
Short entry: on the confirming candle after a wick-touch below the pre-market low.
Only the first valid entry per direction per day is taken.
Visuals & Alerts:
Box represents pre-market high/low.
Top/bottom box border lines show the pre-market high / low levels cleanly.
BUY/SELL markers are pinned to the confirming candle.
Added a "YOLO" marker on breakout candle.
Alert conditions trigger when a breakout is confirmed by the retest.
Strategy Type:
Momentum breakout strategy with confirmation retest.
Combines pre-market structure and risk-managed entries.
Designed to filter false breakouts by requiring confirmation on the candle after the wick-touch.
In short, it’s a pre-market breakout momentum strategy: it uses the pre-market high/low as reference, waits for a breakout, and then enters only after a confirmation retest, reducing the chance of entering on a false spike.
Always use good risk management.

Gann Fan Strategy [KedarArc Quant]Description
A single-concept, rule-based strategy that trades around a programmatic Gann Fan.
It anchors to a swing (or a manual point), builds 1×1 and related fan lines numerically, and triggers entries when price interacts with the 1×1 (breakout or bounce). Management is done entirely with the fan structure (next/previous line) plus optional ATR trailing.
What TV indicators are used
* Pivots: `ta.pivothigh/ta.pivotlow` to confirm swing highs/lows for anchor selection.
* ATR: `ta.atr` only to scale the 1×1 slope (optional) and for an optional trailing stop.
* EMA: `ta.ema` as a trend filter (e.g., only long above the EMA, short below).
No RSI/MACD/Stoch/Heikin/etc. The logic is one coherent framework: Gann price–time geometry, with ATR as a scale and EMA as a risk filter.
How it works
1. Anchor
* Auto: chooses the most recent *confirmed* pivot (you control Left/Right).
* Manual: set a price and bar index and the fan will hold that point (no re-anchoring).
* Optional Re-anchor when a newer pivot confirms.
2. 1×1 Slope (numeric, not cosmetic)
* ATR mode: `1×1 = ATR(Length) × Multiplier` (adapts to volatility).
* Fixed mode: `ticks per bar` (constant slope).
Because slope is numeric, it doesn’t change with chart zoom, unlike the drawing tool.
3. Fan Lines
Builds classic ratios around the 1×1: 1/8, 1/4, 1/3, 1/2, 1/1, 2/1, 3/1, 4/1, 8/1.
4. Signals
* Breakout: cross of price over/under the 1×1 in the EMA-aligned direction.
* Bounce (optional): touch + reversal across the 1×1 to reduce whipsaw.
5. Exits & Risk
* Take-profit at the next fan line; Stop at the previous fan line.
* If a level is missing (right after re-anchor), a fallback Risk-Reward (RR) is used.
* Optional ATR trailing stop.
Why this is unique
* True numeric fan: The 1×1 slope is calculated from ATR or fixed ticks—not from screen geometry—so it is scale-invariant and reproducible across users/timeframes.
* Deterministic anchor logic: Uses confirmed pivots (with your L/R settings). No look-ahead; anchors update only when the right bars complete.
* Fan-native trade management: Both entries and exits come from the fan structure itself (with a minimal ATR/EMA assist), keeping the method pure.
* Two entry archetypes: Breakout for momentum days; Bounce for range days—switchable without changing the core model.
* Manual mode: Lock a session’s bias by anchoring to a chosen swing (e.g., day’s first major low/high) and keep the fan constant all day.
Inputs (quick guide)
* Auto Anchor (Left/Right): pivot sensitivity. Higher values = fewer, stronger anchors.
* Re-anchor: refresh to newer pivots as they confirm.
* Manual Anchor Price / Bar Index: fixes the fan (turn Auto off).
* Scale 1×1 by ATR: on = adaptive; off = use ticks per bar.
* ATR Length / ATR Multiplier: controls adaptive slope; start around 14 / 0.25–0.35.
* Ticks per bar: exact fixed slope (match a hand-drawn fan by computing slope ÷ mintick).
* EMA Trend Filter: e.g., 50–100; trades only in EMA direction.
* Use Bounce: require touch + reverse across 1×1 (helps in chop).
* TP/SL at fan lines; Fallback RR for missing levels; ATR Trailing Stop optional.
* Transparency/Plot EMA: visual preferences.
Tips
* Range days: larger pivots (L/R 8–12), Bounce ON, ATR Multiplier \~0.30–0.40, EMA 100.
* Trend days: L/R 5–6, Breakout, Multiplier \~0.20–0.30, EMA 50, ATR trail 1.0–1.5.
* Match the TV Gann Fan drawing: turn ATR scale OFF, set ticks per bar = `(Δprice between anchor and 1×1 target) / (bars) / mintick`.
Repainting & testing notes
* Pivots require Right bars to confirm; anchors are set after confirmation (no look-ahead).
* Signals use the current bar close with TradingView strategy mechanics; real-time vs. bar-close can differ slightly, as with any strategy.
* Re-anchoring legitimately moves the structure when new pivots confirm—by design.
⚠️ Disclaimer
This script is provided for educational purposes only.
Past performance does not guarantee future results.
Trading involves risk, and users should exercise caution and use proper risk management when applying this strategy.

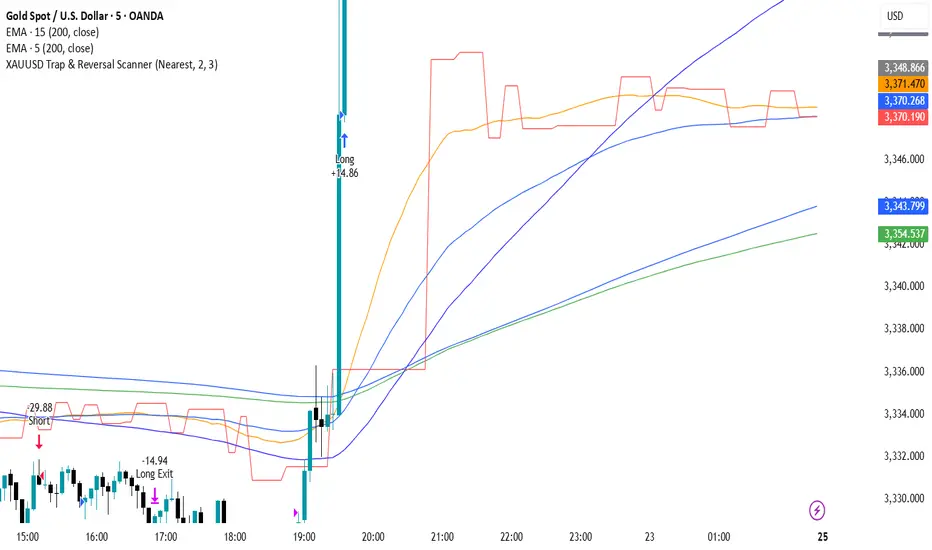
XAUUSD Trap & Reversal ScannerThis strategy is designed for XAUUSD (Gold) on 5m/15m timeframes.
It detects and trades reversal traps confirmed by classic patterns:
Double Tops / Double Bottoms
Head & Shoulders / Inverse H&S
Fair Value Gaps (FVG / IFVG)
Trap Sweeps (stop hunts)
Additional filters:
EMA200 trend confirmation
London & New York trading session filter (12:00–17:00 UTC)
Risk management with ATR-based stop loss
Partial profit-taking (50% at 1:1, remainder at 1:RR up to 1:4)
PowerTrend Pro Strategy – Gold OptimizedTired of false signals on Gold?
PowerTrend Pro combines VWAP, Supertrend, RSI, and smart MA filters with trailing stops & break-even logic to deliver high-probability trades on XAUUSD.
PowerTrend Pro Strategy is a professional-grade trading system designed to capture high-probability swing and intraday opportunities on XAUUSD (Gold) and other volatile markets.
🔑 Core Features
VWAP Anchoring – institutional fair value reference to filter trades.
Supertrend (ATR-based) – adaptive trend filter tuned for Gold’s volatility.
Multi-Timeframe RSI – confirms momentum alignment across intraday and higher timeframe.
EMA + SMA Combo – ensures trades follow strong directional bias, reducing false signals.
Dynamic Risk Management
Adjustable Take Profit / Stop Loss (%)
Trailing Stop that locks in profits on extended moves
Break-Even Logic (stop loss moves to entry once price is in profit)
⚡ Gold-Tuned Presets
XAUUSD 1H → tighter TP/SL & faster entries for active intraday trading.
XAUUSD 4H → wider ATR filter & trailing stops to capture bigger swings.
Generic Mode → works on Forex, Indices, and Crypto (fully customizable).
🎯 Why It Works
Gold is notoriously volatile — quick spikes wipe out weak strategies. PowerTrend Pro solves this by combining:
✅ Institutional bias (VWAP)
✅ Adaptive trend filter (Supertrend)
✅ Momentum confirmation (RSI MTF)
✅ Robust trend structure (EMA + SMA)
✅ Smart exits (TP, SL, trailing & breakeven)
This multi-layer confirmation makes entries stronger and keeps risk under control.
🛠️ Usage
Add the strategy to your chart.
Choose a preset (XAUUSD 1H, 4H, or Generic).
Run Strategy Tester for performance metrics.
Optimize TP/SL and ATR values for your broker & market conditions.
🔥 Pro Tip: Combine this strategy with a session filter (London/NY overlap) or volume confirmation to boost accuracy in Gold.

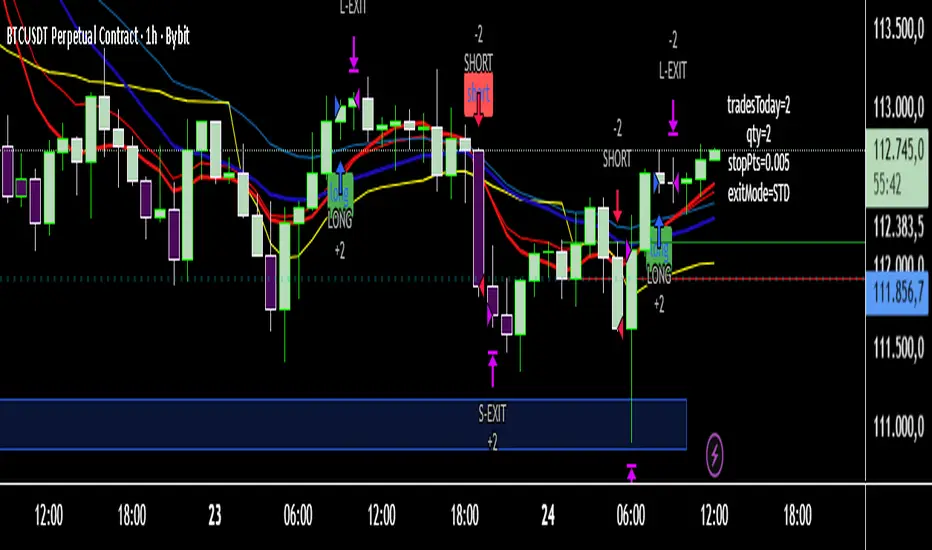
BlackZone Strategy Pro v6 — single declarationSymbol: BTCUSD/BTCUSDT, TF: 1D/4H/1H/30m/15m.
Fine-tune the Entry Mode (Trend Flip or F2) with the ATR Period/Factor in "Inputs" and the Position % in "Properties."
Why will it work this time?
There's only one strategy() in the file.
All series are safe initialized (var + nz + na() checks).
Everything is written in v6 syntax.
You can continue here if you like:
Fixed RR target (1.5R/2R) + trail hybrid,
MTF confirmation (e.g., 15m trade but 1H Trend==1 requirement),
Session filter (London/NY),

Opening Range Breakout🚀 ORB – Optimized for Peak Performance 🚀
Catch the morning breakout moves with zero guesswork!
This plug-and-play Opening Range Breakout strategy is fully optimized ; no settings to tweak, no parameters to adjust.
✅ Pre-tuned for U.S. market open on 5-minute charts.
✅ Built-in risk management with stop loss, take profit, and one trade per day.
✅ Auto exit before market close to lock in gains and avoid late-day whipsaws.
Perfect for day traders who want to focus on execution, not experimentation.
Just load it, trade it, and let the strategy do the heavy lifting.
⚠ Disclaimer : Educational use only. Always backtest and paper trade before using with real capital.
Key Features
• No Guesswork – Pre-set with the best-performing configuration.
• Opening Range Breakout Logic – Identifies the early range of the market and trades strong breakouts.
• Strict Risk Management – Stop loss and take profit levels are automatically calculated from the range size.
• One Trade Per Day – Prevents overtrading and keeps the focus on quality setups.
• End-of-Day Auto Exit – Closes all open trades at 3:30 PM EST to avoid late-session volatility.
How It Works
1. Opening Range Calculation: At market open (9:30 AM EST), the strategy monitors opening range.
2. Breakout Entry: Monitors the breakouts with moment.
3. Risk & Profit Targets: Stop loss and take profit are calculated automatically based on the range size. Risk-to-reward ratio is set for balanced performance.
4. Trade Control: Only one trade per day (either long or short). All trades are force-closed at 3:30 PM EST.

MNQ Gap-Fade (ETH) — RTH 08:30–15:00 CT, +/-3m refsStrategy overview
This strategy tests a gap-fade idea on MNQ when trading an ETH chart but referencing RTH timing. It measures the overnight move from 3 minutes before the prior RTH close (14:57 CT) to 3 minutes after today’s RTH open (08:33 CT). If that gap is big enough, it bets on mean reversion at the open:
Short after a large gap up
Long after a large gap down
How it works
Sampling windows (RTH, Chicago time):
Prev close sample: the 14:57 bar (3 min before 15:00 close)
Open sample: the 08:33 bar (3 min after 08:30 open)
These offsets help avoid opening/closing bar noise and ensure the bars have formed.
Overnight % move:
(OpenSample−PrevCloseSample)/PrevCloseSample × 100
Signals (at 08:33 pulse):
If gap % ≥ Gap-Up threshold → enter SHORT
If gap % ≤ −Gap-Down threshold → enter LONG
Risk management:
Per-trade TP and SL as percentages from entry (both adjustable)
If still in a position at 14:57, the strategy forces flat (closes all) before the RTH close
Plots & visibility:
Plots the computed Overnight Gap % line
Horizontal lines at your Gap-Up and Gap-Down thresholds for quick visual checks
Alerts:
alertcondition() events fire on:
the open-sample ready pulse,
gap-up short, and gap-down long conditions
(Pine requires static alert messages; the % gap itself is visible on the chart.)
Inputs you can adjust
Times (CT): RTH open/close and the ±3 min offsets (use different values if desired)
Gap thresholds (%): separate values for gap-up (short) and gap-down (long)
Take-profit / Stop-loss (%): per-side percentage targets from average entry price
Instrument & session notes
Designed for MNQ; works on an ETH chart while internally referencing CME/Chicago (CT) RTH times via 1-minute sampling.
If you prefer different markets or exact ET timestamps, change the time inputs accordingly.
Assumptions & limitations
This is a research/backtest tool for a simple gap-fade rule, not a complete trading system.
Slippage, fills, and overnight liquidity may differ from backtest assumptions.
Mean reversion can fail on trend days and during news events; use filters or wider thresholds if needed.
That should be everything reviewers and users need to understand what it does and how to tune it. Want me to add a short “Suggested defaults” block (e.g., 0.75–1.25% gaps, 1% TP/SL) or a “Known gotchas” section for ETH vs. RTH charts?
Ask ChatGPT

Inascript PRO (Elliott + TP System)Inascript PRO (Elliott + TP System) is an intraday strategy for gold (XAUUSD), based on simplified Elliott Wave logic.
It features 3 Take Profits, dynamic Stop Loss, break-even logic, and session filters (London & New York).
Precise alerts include entry, TP, and SL levels.
Developed by Inaskan for clean and smart intraday trading.

Matrix Trading Strategy**Matrix Trading Strategy** is a multi-signal framework designed to identify and exploit intraday trends with controlled precision. It combines three independent entry engines—Opening Range Breakout (ORB), Ultimate Trend via ATR trailing, and a moving average crossover (MA Cross)—which can operate alone or in any combination, offering traders maximum flexibility.
Risk management is fully parameterizable: position sizing by percent of equity, fixed cash amount, or fixed quantity; SL/TP in pips aligned to the instrument’s tick size (`pipSize`); automatic break-even; ATR-based trailing stop (with an option to anchor to the UT line itself); and configurable partial exits (TP1/TP2). Daily trade limits, entry cooldowns, and forced end-of-session liquidation enforce strict discipline.
Visually, the script plots EMAs, a 1-minute VWAP, ORB levels, the UT trailing line, and signal markers, and it colors candles by RSI for rapid momentum assessment. Ready-to-use alerts for ORB, UT, and MA signals support seamless automation via webhooks.
All together, Matrix Trading is a modular framework that adapts effortlessly to cryptocurrencies, metals, or global indices, delivering realistic executions and transparent metrics in both backtests and live trading.
US Index First 30m Candle Strategy (10m Chart)Strategy Description for Publishing
Title: US Index First 30-Minute Candle Strategy (10m Chart)
Overview:
This Pine Script implements a trading strategy designed to capitalize on price movements within the first 30 minutes of the U.S. stock market opening. It is specifically tailored for use on a 15-minute chart and is optimized for trading U.S. indices during regular market hours.
Features:
Session Time Configuration: The strategy operates within the U.S. market hours, specifically from 9:30 AM to 4:00 PM (Eastern Time).
First 30-Minute Candle Aggregation: The script identifies the high and low of the first 30-minute candle, which is considered a critical time frame for market momentum.
Single Trade Per Day: To minimize risk, the strategy is designed to execute only one trade per day based on the established range of the first 30 minutes.
Dynamic Trade Conditions: Buy and sell signals are generated when the price breaks above the high or below the low of the first 30-minute candle, with defined stop-loss and take-profit levels based on a customizable risk-reward ratio.
How It Works:
Initialization:
At the start of each trading day, the script resets the high and low values for the first 30 minutes.
Range Locking: After the first 30 minutes, the high and low values are locked, allowing for trade entries based on these levels.
Trade Execution:
Long Entry: Triggered when the price moves above the locked high.
Short Entry: Triggered when the price drops below the locked low.
Risk Management: Each trade comes with a stop-loss and take-profit mechanism to manage potential losses and secure profits.
Visuals:
The script also plots the locked high and low levels on the chart, providing a visual reference for traders.
Conclusion:
This strategy leverages the volatility often seen in the first 30 minutes of trading, aiming to capture significant price movements while maintaining a disciplined trading approach. It is suitable for traders looking to implement a systematic strategy based on early market behavior.
Usage:
To use this strategy, simply add the script to your TradingView chart, set your desired parameters, and monitor for trade signals during the specified market hours. Adjust the risk-reward ratio as needed to align with your trading style.

US30 Stealth StrategyOnly works on US30 (CAPITALCOM) 5 Minute chart
📈 Core Concept:
This is a trend-following strategy that captures strong market continuations by entering on:
The 3rd swing in the current trend,
Confirmed by a volume-verified engulfing candle,
With adaptive SL/TP and position sizing based on risk.
🧠 Entry Logic:
✅ Trend Filter
Uses a 50-period Simple Moving Average (SMA).
Buy only if price is above SMA → Uptrend
Sell only if price is below SMA → Downtrend
✅ Swing Count Logic
For buy: Wait for the 3rd higher low
For sell: Wait for the 3rd lower high
Uses a 5-bar lookback to detect highs/lows
This ensures you’re not buying early — but after trend is confirmed with structure.
✅ Engulfing Candle Confirmation
Bullish engulfing for buys
Bearish engulfing for sells
Candle must engulf previous bar completely (body logic)
✅ Volume Filter
Current candle volume must be greater than the 20-period volume average
Ensures trades only occur with institutional participation
✅ MA Slope Filter
Requires the slope of the 50 SMA over the last 3 candles to exceed 0.1
Avoids chop or flat trends
Adds momentum confirmation to the trade
✅ Session Filter (Time Filter)
Trades only executed between:
2:00 AM to 11:00 PM Oman Time (UTC+4)
Helps avoid overnight chop and illiquidity
📊 Position Sizing & Risk Management
✅ Smart SL (Adaptive Stop Loss)
SL is based on full size of the signal candle (including wick)
But if candle is larger than 25 points, SL is cut to half the size
This prevents oversized risk from long signals during volatile moves.

Multi-Timeframe Wolfe Wave StrategyThis invite-only strategy implements an advanced multi-timeframe Wolfe Wave pattern recognition system specifically designed for institutional-grade algorithmic trading environments.
**Core Mathematical Framework:**
The strategy employs sophisticated mathematical calculations across 10 distinct timeframes (377, 233, 144, 89, 55, 34, 21, 13, 8, 5 periods), utilizing Elliott Wave ratio theory combined with proprietary algorithmic enhancements. Unlike standard Wolfe Wave implementations that rely on visual pattern recognition, this system uses quantitative analysis to identify precise entry and exit points.
**Technical Implementation:**
• **Pattern Detection Algorithm:** Calculates price relationships using configurable ratio sets including Fibonacci sequences, Elliott Wave ratios, Golden Ratio, Harmonic Patterns, Pi-based calculations, and custom mathematical progressions
• **Multi-Timeframe Confluence:** Simultaneously analyzes patterns across all timeframes to ensure signal reliability and reduce false positives
• **Dynamic Target Calculation:** Employs advanced mathematical modeling to project optimal profit targets based on historical price behavior and pattern completion theory
• **Risk Management Engine:** Implements position-based stop losses calculated as percentages of target profits, with liquidation price monitoring for leveraged positions
**Originality and Innovation:**
This implementation differs significantly from traditional Wolfe Wave indicators through several key innovations:
1. **Algorithmic Pattern Validation:** Uses mathematical confirmation across multiple timeframes rather than subjective visual analysis
2. **Adaptive Ratio Selection:** Offers 24 different ratio calculation methods, allowing optimization for various market conditions
3. **Institutional Integration:** Features comprehensive webhook messaging for automated execution via external trading systems
4. **Advanced Position Management:** Includes sophisticated position sizing controls with maximum concurrent position limits
**Strategy Logic:**
For bullish conditions, the algorithm identifies when price action meets specific mathematical criteria:
- Point validation through ratio analysis between swing highs/lows
- Confluence confirmation across multiple timeframes
- Minimum profit threshold filtering to ensure trade quality
- Dynamic stop-loss positioning based on pattern geometry
The mathematical approach uses proprietary calculations that extend beyond traditional Fibonacci levels, incorporating elements from chaos theory, fractal geometry, and advanced statistical analysis.
**Risk Management Features:**
• Configurable stop-loss percentages relative to profit targets
• Maximum position limits to control portfolio exposure
• Liquidation price monitoring for margin trading
• Time-based filtering options for market session control
• Minimum profit threshold settings to filter low-quality signals
**Intended Markets and Conditions:**
Optimized for cryptocurrency markets with high volatility and sufficient liquidity. Works effectively in trending and ranging market conditions due to its multi-timeframe approach. Best suited for assets with clear swing structure and adequate price movement.
**Performance Characteristics:**
The strategy is designed for active trading with frequent position entries across multiple timeframes. Position holding periods vary from short-term scalping to medium-term swing trading depending on pattern completion timeframes.
**Technical Requirements:**
Requires understanding of advanced pattern recognition theory, risk management principles, and algorithmic trading concepts. Users should be familiar with Wolfe Wave methodology and Elliott Wave theory fundamentals.

Antony.N4A -NQ ORB Quartile Str v6.3Antony.N4A – NQ ORB Quartile Strategy v6.3
A precision-engineered intraday breakout system built for the Nasdaq futures market, combining the Opening Range Breakout (ORB) logic with dynamic standard deviation targets, structural filters, and multi-layer risk management.
🧠 Key Features
Opening Range Breakout (ORB):
Automatically defines a breakout window (default: 09:30–09:45) and triggers entries when price breaks the high or low of that range.
Standard Deviation Profit Targets:
Supports SD0.5, SD1.0, SD1.5, and SD2.0 targets relative to the ORB range.
EMA Filtering (200-period):
Filters trades based on EMA direction and price position to validate breakout direction and avoid false entries.
Range Filtering:
Detects directional bias and volatility trends using smoothed range logic.
Momentum Triggering:
Validates breakout momentum and allows entries when directional momentum is positive and increasing.
⚙️ User Inputs
ORB Settings: Timeframe, session, and timezone customization
Entry Window: Define when trades are allowed to trigger
Day Filters: Enable/disable trading by weekday
SD Targets: Configure exit % and active levels (SD0.5 – SD2.0)
EMA Filter & Sensitivity
Cross Filter (Anti-chop logic)
Range Filter Parameters
Visual Toggles: ORB range, SD levels, EMA clouds
🎯 Trade Management Rules
Entry:
Triggered at the close of a 5-minute candle confirming a breakout of the ORB range.
Stop Loss:
Defined by structural invalidation (quartile boundaries & mid-range buffers).
Take Profit Strategy:
75% closed at SD1.0 level
Remaining 25% trailed to further SD2 target
SL is moved to breakeven after partial exit
Execution Controls:
No pyramiding
No re-entries (cooldown enforced)
🔧 Trading Modes
✅ Safe Mode
EMA Filter: Enabled
EMA Sensitivity: 19
Range Filter: Disabled
Ideal for conservative setups and reduced noise environments
🔥 Aggressive Mode
EMA Filter: Enabled
EMA Sensitivity: 5
Range Filter: Disabled
Suited for high-frequency setups and faster breakouts
📊 Backtest Performance (7-Month Sample)
Safe Mode:
Win Rate: 66%
Total Trades: 29
Net PnL: +21.79R (~$4,357 with R = $200)
Max Red Days: 3
Max Drawdown: -$663
Best Month: +9R, Worst Month: -2R
Aggressive Mode:
Win Rate: 63%
Total Trades: 52
Net PnL: +30R (~$6,080)
Max Red Days: 6
Max Drawdown: -$1,357
Best Month: +12R, Worst Month: -3.2R
👨💻 Developed by Antony.N4A
This tool is crafted for strategic intraday traders, system developers, and backtesters.
For access, customization, or licensing options, contact the developer directly.
Protected script. Redistribution or reuse without permission is prohibited.
MACD + RSI + EMA + BB + ATR Day Trading StrategyEntry Conditions and Signals
The strategy implements a multi-layered filtering approach to entry conditions, requiring alignment across technical indicators, timeframes, and market conditions .
Long Entry Requirements
Trend Filter: Fast EMA (9) must be above Slow EMA (21), price must be above Fast EMA, and higher timeframe must confirm uptrend
MACD Signal: MACD line crosses above signal line, indicating increasing bullish momentum
RSI Condition: RSI below 70 (not overbought) but above 40 (showing momentum)
Volume & Volatility: Current volume exceeds 1.2x 20-period average and ATR shows sufficient market movement
Time Filter: Trading occurs during optimal hours (9:30-11:30 AM ET) when market volatility is typically highest
Exit Strategies
The strategy employs multiple exit mechanisms to adapt to changing market conditions and protect profits :
Stop Loss Management
Initial Stop: Placed at 2.0x ATR from entry price, adapting to current market volatility
Trailing Stop: 1.5x ATR trailing stop that moves up (for longs) or down (for shorts) as price moves favorably
Time-Based Exits: All positions closed by end of trading day (4:00 PM ET) to avoid overnight risk
Best Practices for Implementation
Settings
Chart Setup: 5-minute timeframe for execution with 15-minute chart for trend confirmation
Session Times: Focus on 9:30-11:30 AM ET trading for highest volatility and opportunity

Rawstocks 15 Minute ModelRawstocks 15-Minute Model
The Rawstocks 15-Minute Model is a precision intraday trading strategy designed for the US stock market (9:30 AM - 4:00 PM ET), optimized for the 15-minute timeframe. It combines institutional order flow concepts with Fibonacci retracements to identify high-probability reversal setups while enforcing strict risk management and session-based rules.
Key Features
Time-Based Execution
Trading Hours: 9:30 AM - 4:00 PM ET (no new entries after 4:00 PM)
Force Close: All positions auto-exit at 4:30 PM ET (prevents overnight risk)
Entry Logic
Order Block + Fib Confluence:
Identifies institutional order blocks (previous swing highs/lows)
Requires price pullback to 61.8% or 79% Fibonacci level
Liquidity Confirmation:
Waits for stop runs (liquidity sweeps) before reversal entries
Exit Rules
Stop Loss: 1x ATR (14) from entry
Take Profit: 2:1 Risk-Reward (adjustable)
Visual Signals
Green Triangle: Valid long setup (pullback to bullish OB + Fib)
Red Triangle: Valid short setup (pullback to bearish OB + Fib)
Blue/Purple Background: Highlights active trading vs. close period
How It Works
Identify the Setup
Wait for a strong impulse move (break of structure)
Mark the order block (institutional zone)
Confirm Pullback
Price must retrace to 61.8% or 79% Fib level
Must occur within trading hours (9:30 AM - 4:00 PM)
Enter on Confirmation
Long: Break of pullback candle high (stop below recent swing low)
Short: Break of pullback candle low (stop above recent swing high)
Manage the Trade
Trail stop or exit at 2R (risk-to-reward)
All positions close at 4:30 PM sharp

Dskyz Adaptive Futures Edge (DAFE)imgur.com/a/igj9lFj
Dskyz Adaptive Futures Edge (DAFE) is a futures trading strategy designed to adapt dynamically to market volatility and price action using a blend of technical indicators. The strategy combines adaptive moving averages, optional RSI filtering, candlestick pattern recognition, and multi-timeframe trend analysis to generate long and short trade signals. It incorporates robust risk management techniques including ATR-based stop-losses and trailing stops, ensuring trades are sized and managed within sustainable risk limits.
Key Components and Logic
-Adaptive Moving Averages
Dynamic Calculation: Fast and slow Simple Moving Averages (SMAs) adapt to changing volatility, making them sensitive to high-momentum shifts and smoothing during quieter price action.
Signal Generation: Entry signals are triggered when the fast SMA crosses the slow SMA in conjunction with price direction confirmation (e.g., price above both for long positions).
-RSI Filtering (Optional)
Momentum Confirmation: The RSI filter provides momentum confirmation to avoid overextended entries. It can be toggled on or off for both long and short conditions.
User Control: Adjustable parameters such as lookback period, oversold/overbought thresholds, and enable/disable switches give full control over its influence.
-Candlestick Pattern Recognition
Engulfing Logic: Recognizes strong bullish or bearish engulfing patterns with configurable strength criteria like range and volume. Patterns are filtered by trend direction and strength for confirmation.
Signal Conflict Handling: When both bullish and bearish engulfing patterns occur within the lookback window, the strategy avoids entry to reduce whipsaws in indecisive markets.
-Multi-Timeframe Trend Filter
Higher Timeframe Filtering: Incorporates 15-minute trend direction as a macro-level filter to align intrabar trades with larger trend momentum.
Smoothed Entry Logic: Prevents entering trades that go against the broader market structure, reducing false signals in choppy or low-conviction moves.
-Trade Execution and Risk Management
imgur.com
Entry Logic
Priority System: Users can define whether moving average signals or candlestick patterns should take priority when both are present.
Volume & Volatility Checks: Ensures sufficient market participation and action before entering a position, improving the odds of reliable follow-through.
Stop-Loss and Trailing Exit
ATR-Based Initial Stops: Dynamically adjusts stop-loss distance based on market volatility using a multiple of ATR (Average True Range), keeping risk proportional to price swings.
Trailing Stop: Protects open profits and enables winners to run by following price action at a set distance (also ATR-based).
-Cooldown Period & Minimum Bar Hold (Trade Discipline Logic)
Cooldown Bars: After an exit, the strategy imposes a mandatory pause before opening a new position.
Why: This avoids rapid-fire re-entries triggered by minor fluctuations that could lead to overtrading and degradation of profitability.
Minimum Bar Hold: A trade must be held for a minimum number of bars before it can be exited.
Why: This prevents the strategy from immediately exiting trades due to fleeting volatility spikes, which previously caused premature exits that often reversed back in favor of the original signal. This ensures trades have adequate time to develop, filtering out noise from true reversals.
-Visual Elements and Transparency Tools
Chart Overlays: Moving averages, RSI values, and trade entry/exit points are shown directly on the chart for complete visibility.
Dashboard UI: Displays critical live metrics—current position, PnL, time held, ATR values, etc.
Debug Logs: Optional toggles allow verbose condition tracking for deep inspection into why a trade occurred (or didn't), useful for both live optimization and debugging.
-Input Parameter Reference Guide
Input Name Function & Suggested Use
Use RSI Filter - Enables or disables RSI-based entry confirmation. Disable if price action alone is desired for entry decisions.
RSI Length - RSI lookback period. Lower values (e.g., 7–14) are more responsive; higher values reduce false signals.
Overbought / Oversold Levels - Used to detect exhaustion zones. E.g., avoid long entries above 70 or short entries below 30.
Use Candlestick Patterns - Enable detection of bullish/bearish engulfing patterns as trade signals. Disable to rely only on trend/MA.
Pattern Strength Thresholds (Range, Volume) - Filters out weak engulfing signals. Higher values require stronger patterns to trigger.
Use 15min Trend Filter - Adds multi-timeframe trend confirmation. Recommended for filtering entries against larger trend direction.
Fast MA - Base Length for fast adaptive moving average. Suggested: 10–25.
Slow MA - Base length for slow adaptive moving average. Suggested: 30–60.
Volatility Sensitivity Multiplier - Multiplies volatility adjustments for adaptive MA length. Higher = more reactive to volatility.
Entry Volume Filter - Filters out trades during low volume. Recommended to prevent entries in illiquid conditions.
ATR Length - Lookback period for ATR calculation. Suggested: 14.
Trailing Stop ATR Offset - Defines how far the stop-loss is from entry. 1.5–2.5 is typical for medium-volatility environments.
Trailing Stop ATR Multiplier - Determines trailing stop distance. 1.5 is tight; 3+ gives more room for trending trades.
Cooldown Bars After Exit - Prevents immediate re-entries. Suggested: 3–10 bars depending on timeframe.
Minimum Bars to Hold Trade - Ensures trades are held long enough to avoid knee-jerk exits. Suggested: 5–10 for intraday strategies.
Trading Hours (Start / End) - Sets the window of allowed trading. Prevents entries outside key session times (e.g., avoid pre-market).
Enable Logging / Debugging - Shows internal trade decision data for tuning and understanding the logic.
Compliance with TradingView Regulations
Realistic Backtesting: The strategy uses proper initial capital, fixed trade quantities, and risk parameters to reflect realistic scenarios.
Transparent Trade Logic: Every condition used for signal generation is documented and controllable by the user. Users can view each signal's rationale.
Risk Mitigation: Cooldown bars, ATR stops, and minimum trade duration ensure the strategy behaves predictably and prevents reckless trade behavior.
Customization: Full control over each module (MA, RSI, Candlestick, Trend, etc.) gives users the ability to tailor the strategy to suit various futures contracts or timeframes.
imgur.com
imgur.com
imgur.com
imgur.com
imgur.com
Summary
DAFE was built for high-stakes micro futures trading environments such as the MNQ, where milliseconds of volatility matter. This strategy's modular architecture, adaptive logic, and advanced risk controls make it an ideal framework for scalpers and swing traders alike.
BTCUSDT.P
Backtesting: www.dropbox.com
Deep Backtesting:
www.dropbox.com
****Currently testing on a prop account.
Caution Statement
This strategy is designed for educational and experimental purposes and should not be considered financial advice or a guaranteed method of profitability. While the DAFE (Dskyz Adaptive Futures Edge) strategy incorporates advanced filters, adaptive logic, and volatility-based risk management, its performance is subject to market conditions, data accuracy, and user configuration.
Futures trading involves substantial risk, and the leverage inherent in futures contracts can amplify both gains and losses. This strategy may execute trades rapidly and frequently under certain conditions—particularly when filters are disabled or thresholds are set too tightly—potentially leading to increased slippage, commissions, or unanticipated losses.
Users are strongly advised to:
Backtest thoroughly across various market regimes.
Adjust parameters responsibly and understand the implication of each input.
Paper trade in a simulated environment before going live.
Monitor trades actively and use discretion when market volatility increases.
-By using this strategy, you accept all risks and responsibility for any trading decisions made based on its output.

VWAP StrategyVWAP and volatility filters for structured intraday trades.
How the Strategy Works
1. VWAP Anchored to Session
VWAP is calculated from the start of each trading day.
Standard deviations are used to create bands above/below the VWAP.
2. Entry Triggers: Al Brooks H1/H2 and L1/L2
H1/H2 (Long Entry): Opens below 2nd lower deviation, closes above it.
L1/L2 (Short Entry): Opens above 2nd upper deviation, closes below it.
3. Volatility Filter (ATR)
Skips trades when deviation bands are too tight (< 3 ATRs).
4. Stop Loss
Based on the signal bar’s high/low ± stop buffer.
Longs: signalBarLow - stopBuffer
Shorts: signalBarHigh + stopBuffer
5. Take Profit / Exit Target
Exit logic is customizable per side:
VWAP, Deviation Band, or None
6. Safety Exit
Exits early if X consecutive bars go against the trade.
Longs: X red bars
Shorts: X green bars
Explanation of Strategy Inputs
- Stop Buffer: Distance from signal bar for stop-loss.
- Long/Short Exit Rule: VWAP, Deviation Band, or None
- Long/Short Target Deviation: Standard deviation for target exit.
- Enable Safety Exit: Toggle emergency exit.
- Opposing Bars: Number of opposing candles before safety exit.
- Allow Long/Short Trades: Enable or disable entry side.
- Show VWAP/Entry Bands: Toggle visual aids.
- Highlight Low Vol Zones: Orange shading for low volatility skips.
Tuning Tips
- Stop buffer: Use 1–5 points.
- Target deviation: Start with VWAP. In strong trends use 2nd deviation and turn off the counter-trend entry.
- Safety exit: 3 bars recommended.
- Disable short/long side to focus on one type of reversal.
Backtest Setup Suggestions
- initial_capital = 2000
- default_qty_value = 1 (fixed contracts or percent-of-equity)

Trendline Breaks with Multi Fibonacci Supertrend StrategyTMFS Strategy: Advanced Trendline Breakouts with Multi-Fibonacci Supertrend
Elevate your algorithmic trading with institutional-grade signal confluence
Strategy Genesis & Evolution
This advanced trading system represents the culmination of a personal research journey, evolving from my custom " Multi Fibonacci Supertrend with Signals " indicator into a comprehensive trading strategy. Built upon the exceptional trendline detection methodology pioneered by LuxAlgo in their " Trendlines with Breaks " indicator, I've engineered a systematic framework that integrates multiple technical factors into a cohesive trading system.
Core Fibonacci Principles
At the heart of this strategy lies the Fibonacci sequence application to volatility measurement:
// Fibonacci-based factors for multiple Supertrend calculations
factor1 = input.float(0.618, 'Factor 1 (Weak/Fibonacci)', minval = 0.01, step = 0.01)
factor2 = input.float(1.618, 'Factor 2 (Medium/Golden Ratio)', minval = 0.01, step = 0.01)
factor3 = input.float(2.618, 'Factor 3 (Strong/Extended Fib)', minval = 0.01, step = 0.01)
These precise Fibonacci ratios create a dynamic volatility envelope that adapts to changing market conditions while maintaining mathematical harmony with natural price movements.
Dynamic Trendline Detection
The strategy incorporates LuxAlgo's pioneering approach to trendline detection:
// Pivotal swing detection (inspired by LuxAlgo)
pivot_high = ta.pivothigh(swing_length, swing_length)
pivot_low = ta.pivotlow(swing_length, swing_length)
// Dynamic slope calculation using ATR
slope = atr_value / swing_length * atr_multiplier
// Update trendlines based on pivot detection
if bool(pivot_high)
upper_slope := slope
upper_trendline := pivot_high
else
upper_trendline := nz(upper_trendline) - nz(upper_slope)
This adaptive trendline approach automatically identifies key structural market boundaries, adjusting in real-time to evolving chart patterns.
Breakout State Management
The strategy implements sophisticated state tracking for breakout detection:
// Track breakouts with state variables
var int upper_breakout_state = 0
var int lower_breakout_state = 0
// Update breakout state when price crosses trendlines
upper_breakout_state := bool(pivot_high) ? 0 : close > upper_trendline ? 1 : upper_breakout_state
lower_breakout_state := bool(pivot_low) ? 0 : close < lower_trendline ? 1 : lower_breakout_state
// Detect new breakouts (state transitions)
bool new_upper_breakout = upper_breakout_state > upper_breakout_state
bool new_lower_breakout = lower_breakout_state > lower_breakout_state
This state-based approach enables precise identification of the exact moment when price breaks through a significant trendline.
Multi-Factor Signal Confluence
Entry signals require confirmation from multiple technical factors:
// Define entry conditions with multi-factor confluence
long_entry_condition = enable_long_positions and
upper_breakout_state > upper_breakout_state and // New trendline breakout
di_plus > di_minus and // Bullish DMI confirmation
close > smoothed_trend // Price above Supertrend envelope
// Execute trades only with full confirmation
if long_entry_condition
strategy.entry('L', strategy.long, comment = "LONG")
This strict requirement for confluence significantly reduces false signals and improves the quality of trade entries.
Advanced Risk Management
The strategy includes sophisticated risk controls with multiple methodologies:
// Calculate stop loss based on selected method
get_long_stop_loss_price(base_price) =>
switch stop_loss_method
'PERC' => base_price * (1 - long_stop_loss_percent)
'ATR' => base_price - long_stop_loss_atr_multiplier * entry_atr
'RR' => base_price - (get_long_take_profit_price() - base_price) / long_risk_reward_ratio
=> na
// Implement trailing functionality
strategy.exit(
id = 'Long Take Profit / Stop Loss',
from_entry = 'L',
qty_percent = take_profit_quantity_percent,
limit = trailing_take_profit_enabled ? na : long_take_profit_price,
stop = long_stop_loss_price,
trail_price = trailing_take_profit_enabled ? long_take_profit_price : na,
trail_offset = trailing_take_profit_enabled ? long_trailing_tp_step_ticks : na,
comment = "TP/SL Triggered"
)
This flexible approach adapts to varying market conditions while providing comprehensive downside protection.
Performance Characteristics
Rigorous backtesting demonstrates exceptional capital appreciation potential with impressive risk-adjusted metrics:
Remarkable total return profile (1,517%+)
Strong Sortino ratio (3.691) indicating superior downside risk control
Profit factor of 1.924 across all trades (2.153 for long positions)
Win rate exceeding 35% with balanced distribution across varied market conditions
Institutional Considerations
The strategy architecture addresses execution complexities faced by institutional participants with temporal filtering and date-range capabilities:
// Time Filter settings with flexible timezone support
import jason5480/time_filters/5 as time_filter
src_timezone = input.string(defval = 'Exchange', title = 'Source Timezone')
dst_timezone = input.string(defval = 'Exchange', title = 'Destination Timezone')
// Date range filtering for precise execution windows
use_from_date = input.bool(defval = true, title = 'Enable Start Date')
from_date = input.time(defval = timestamp('01 Jan 2022 00:00'), title = 'Start Date')
// Validate trading permission based on temporal constraints
date_filter_approved = time_filter.is_in_date_range(
use_from_date, from_date, use_to_date, to_date, src_timezone, dst_timezone
)
These capabilities enable precise execution timing and market session optimization critical for larger market participants.
Acknowledgments
Special thanks to LuxAlgo for the pioneering work on trendline detection and breakout identification that inspired elements of this strategy. Their innovative approach to technical analysis provided a valuable foundation upon which I could build my Fibonacci-based methodology.
This strategy is shared under the same Attribution-NonCommercial-ShareAlike 4.0 International (CC BY-NC-SA 4.0) license as LuxAlgo's original work.
Past performance is not indicative of future results. Conduct thorough analysis before implementing any algorithmic strategy.
