High & Low Of Custom Session - Breakout True Open [cognyto]This indicator is based on the High & Low Of Custom Session - OpeningRange Breakout (Expo) created by Zeiierman.
It adds new functionality and enhances existing settings, targeting ES, NQ, and YM:
Manages session defaults to 12:00 to 13:00
New true opening fully customizable (default 13:00)
Manages timeframe visualization (default 15m and below)
Manages session draw length until the end of the current session (default NY)
Manages previous sessions, allowing the to be hidden
Improves timezone selection (default NY)
Following the strategy called Paradox detailed by DayTradingRauf, it works with indices like ES, NQ, and YM.
The rules consider three possible profiles:
First
AM session as consolidation (08:00-12:00)
Lunch hour range as consolidation (less than 100 points)
PM session breaking either side of the session range
Second
AM session trending lower (08:00-12:00)
Lunch hour range as consolidation (less than 100 points)
PM session trending higher
Third
AM session trending higher (08:00-12:00)
Lunch hour range as consolidation (less than 100 points)
PM session trending lower
After the session ends, the opening price at 13:00 is automatically drawn as it is a key point for the entry strategy.
The strategy can be monitored using a 5-minute or 15-minute timeframe as follows:
- Wait for a liquidity hunt (either the high or low of the lunch session range or AM is taken).
- If liquidity is taken, switch to the 1-minute timeframe and wait for a CISD (change in the state of delivery), where the price closes below an OB, or consider a breaker block or iFVG to enter the trade.
- Bullish entries should happen below the opening price at 13:00, and bearish entries should happen above.
- Consider a 1:2 reward ratio. However, runners can target the opposite side of the range that was not yet taken.
This indicator is for informational purposes only and you should not rely on any information it provides as legal, tax, investment, financial or other advice. Nothing provided by this indicator constitutes a solicitation, recommendation, endorsement or offer by cognyto or any third party service provider to buy or sell any securities or other financial instruments in this or any other jurisdiction in which such solicitation or offer would be unlawful under the securities laws of such jurisdiction.
Cari dalam skrip untuk "session"

Volatility Weighted Moving Average + Session Average linesHi Traders !
Just finished my Y2 university finals exams, and thought I would cook up a quick and hopefully useful script.
VWAP + Session Average Lines :
Volatility Weighted Average Price in the standard case is a trading indicator that measures the average trading price for the user defined period, usually a standard session (D timeframe), & is used by traders as a trend confirmation tool.
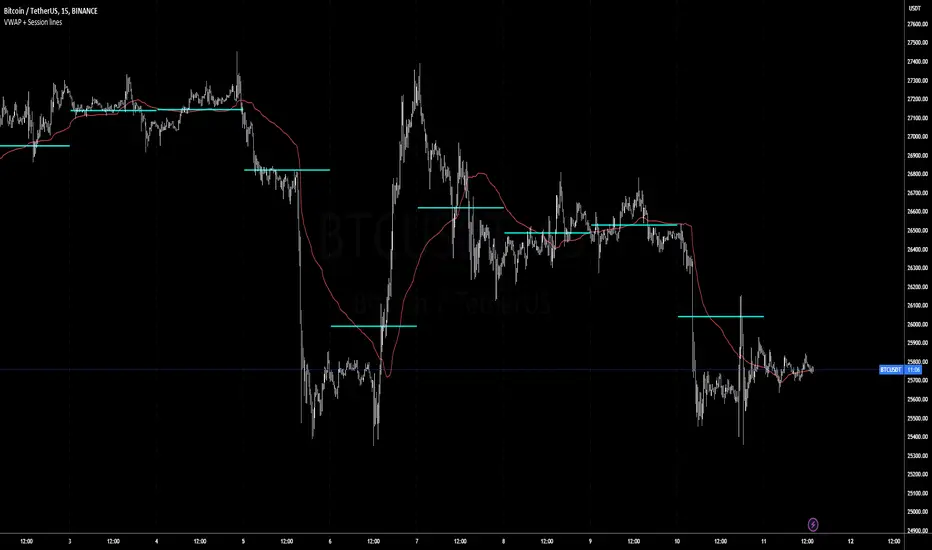
This VWAP script allows for altering of the session to higher dimensions (D, W, M) or those of lower dimension (H4, or even H1 timeframes), furthermore this script allows the lookback of data to be switched from the standard session to a user defined amount of bars (e.g. the VWAP of 200 bars as opposed to the VWAP of a standard session which contains 95 bars in M15 timeframe for 24/7 traded assets e.g. BTCUSD), lastly this script plots Session VWAP Average Lines (if true in settings) so tradaes can gauge the area of highest liquidity within a session, this can be interpreted as the fair price within a session. If Average lines are increasing and decreasing consistently like a monotonic function this singles traders interest is at higher / lower prices respectively (Bullish / Bearish bias respectively ?), However if Average lines are centered around the same zones without any major fluctuations this signals a ranging market.
VWAP calculation :
VWAP is derived from the ratio of the assets value to total volume of transactions where value is the product of typical price (Average of high, low and close bars / candles) and corresponding bar volume, value can be thought of as the dollar value traded per bar.
How is VWAP used by Institutions / Market movers :
For some context and general information, VWAP is typically used by Market movers (e.g. Hedge funds, Mutual funds ,..., ...) in their trade execution, as trading at the VWAP equals the area of highest market volume, trading in line with the volume of the market reduces transaction costs by minimizing market impact (extra liquidity lowers spreads and lag time between order fills), this overall improves market efficiency.
In my opinion the script is best used with its standard settings on the M15 timeframe, note as of now the script is not functional on certain timeframes, however this script is not intended to be used in these timeframes, i will try fix this code bug as soon as possible.
Custom Trading Session HighlighterThe Custom Trading Session Highlighter is a simple yet powerful indicator that allows you to visualize specific trading sessions on your chart by highlighting the background within the specified time range. This indicator can be helpful for traders who want to focus on specific market hours or analyze the market behavior during certain time periods.
Features:
>Customizable start and end times: Input your desired trading session start and end times using the format "HHMM" (e.g., "0930" for 9:30 AM). The indicator allows you to select the time range in 30-minute intervals.
>Trading session background color: The specified trading session will be highlighted with a semi-transparent green color, making it easy to differentiate the session from the rest of the chart.
>Overlay: The indicator overlays on the price chart, so it doesn't take up any additional space on your screen.
How to use:
>Add the Custom Trading Session Highlighter to your chart.
>Configure the start and end times of the session you want to highlight using the input fields in the indicator settings.
>Observe the highlighted trading session on your chart to analyze market behavior within that specific time range.

Daily Session Windows background highlight indicatorIn intraday studies of stock indexes and Forex I have this weird habit of highlighting premarket, core session, lunch break and extended session with different backgrounds. If done by hand, this is tedious work that has to be repeated daily.
I think this feature should be built-in in TradingView. But it isn't.
For a few months now, I have been using this tiny indicator that does precisely that job. It saved me literally hours of focus time and mistakes. I have decided to revamp it and release it. I'm sure it can be useful to others.
Features:
Background color highlighting for premarket , core session , lunch hour and extended session of the trading day.
Session timing preset to match US session, but can be customized.
Can be enabled or disabled on a day of the week basis, including week-end.
Timezone is selectable, matches the chart's instrument but can be set independently to track a different timezone.
Not affected by the timezone you decided to assign to the chat's time scale.
Ready for stock indexes, but can be used to highlight Forex sessions too.

BTMM OFJ FOR BEST RESULTS PLEASE SWITCH TO LINE CHART OR DISABLE THE CHART CANDLES. BELOW IS A LINE WITH OPACITY TURNED DOWN TO 15%
ASIA, LONDON, AND NEW YORK SESSIONS CAN BE CUSTOMIZED (1ST 3 HRS DEFAULT)
VOLUME CANDLES CAN BE APPLIED WITH SUPPLY AND DEMAND OR MARKET MAKER METHOD. IN A STRONG TREND YOU WANT TO SEE REPEATED HIGH VOLUME CLUSTERS IN THE DIRECTION OFTHE TREND AND FADING LOW VOLUME ON THE RETRACE
BASICK KEY LEVELS WEEKLY INITIAL BALANCE (MONDAY+TUESDAY HIGHEST HIGH AND LOWEST LOW) YESTERDAY AND LASY WKHI/LO
QUICK APPLICATON

Pre and Market OpeningsPre and Market Openings is to enable you to quickly visualize the opening markets and how they could influence trading.
The below script has used the market time data from the below links:
Tokyo/Asia www.tradinghours.com
London www.tradinghours.com
New York www.tradinghours.com
The below script aims to plot:
Daily Asia Open
Weekly Asia Open
Daily London Open
Weekly London Open
Daily New York Open
Weekly New York Open
Using background colour it also shows market sessions (pre-market) for London and New York and regular for London, New York and Asia.
There is also plotted text for days of the week and sessions.
As you can see from the picture below that these market openings can act as support and resistance:
BTC
ETH

Breakout Scalper (Session)This is a twist on my on my Breakout Scalper strategy that limits trading to a user-configurable session
Find the original "Continuous" version of the scalper here:
The breakout scalper is based on "slow" and "fast" donchian periods. In this version, the "slow" donchian is in fact the Day's high/low. This important difference means that we will always be entering our trades at the day's high or low, so you are exposed to the price making new highs/lows but not to oscillations within the day's range.
Furthermore, the scalper is modified to only enter trades after the start of the user-configured session. Any open trades are closed at the end of the user-configured session. The default session is set to 10:00 AM to 3:30 PM because that's when I like to trade.

NY Session 15 min ORB + Fib RetracementThis indicator builds a New York session Opening Range (ORB) and plots Fibonacci retracement levels based on that range.
What it does
Defines the Opening Range using the NY cash open (default: 9:30–9:45 ET)
Tracks the ORB high and low during that window
Locks the ORB once the window ends (recommended)
Draws Fibonacci retracement levels from the ORB range
Optionally fills the space between fib levels
Displays price tags for ORB levels and fib levels on the right side
Sessions
ORB window is configurable (default: 9:30–9:45 ET)
Fib levels are only shown during the selected plot session
(default: 9:30–16:00 ET)
Nothing plots outside the selected fib session
Prevents lines from connecting across trading days
Fib behavior
Fibs are calculated from the ORB high and low
Direction can be:
High → Low (default)
Low → High
Common fib ratios are included by default:
0.236
0.382
0.500
0.618
0.786
All ratios are user-editable
Visuals
ORB High = green line
ORB Low = red line
Fib levels = gray lines
Optional shaded fill between fib levels
Optional right-side labels showing:
ORB High / Low price
Fib ratio and exact price
Recommended use
Designed for intraday trading
Best used on NY session instruments (ES, NQ, SPY, QQQ, etc.)
Works well on lower timeframes (1–15 min)
Locking the ORB at session end is recommended for consistency
Notes
Indicator does not generate trade signals
Levels are intended as reference only
Always use proper risk management

Asia & London Session High/Low Description:
This indicator plots the highest and lowest points of the Asian and London trading sessions based on Eastern Time (ET).
Features:
Draws horizontal rays for session highs and lows
Automatically resets for each session
Perfect for I CT-style liquidity analysis , range breaks , and session-based trading setups
Clean chart : no labels or clutter, just the key session levels
Use it to identify liquidity zones , plan entries , and anticipate potential session raids in your trading strategy.

Padder Scalp - Manipulation Triangle + First 15m Session BoxThis indicator combines intraday manipulation detection with session‑based structure and key candlestick pattern labeling to support precision scalp trading.
1. Manipulation Candle Detection (Daily ATR‑Based)
The script calculates the Daily ATR(14) and compares each intraday candle’s range to it.
If a candle’s range is ≥ 20% of the daily ATR, it is flagged as a potential manipulation candle.
A purple triangle is plotted beneath any candle that meets this threshold, helping traders quickly spot abnormal volatility spikes that often precede liquidity grabs or engineered moves.
2. First 15‑Minute RTH Session Box (9:30–9:45 AM)
Designed for use on a 15‑minute chart, the script automatically identifies the first bar of the regular trading session (RTH).
When the 9:30–9:45 candle prints:
- Its high and low are captured
- A session box is created using those levels
- The box extends across the entire trading day
This provides a consistent structural reference point for opening‑range dynamics, liquidity sweeps, and intraday bias.
3. Automatic Box Extension
Once the first RTH candle is detected, the script draws a blue box from that candle’s high/low and continuously extends it to the right for the remainder of the session.
This creates a persistent visual anchor for:
- Breakouts
- Retests
- Rejections
- Mean‑reversion scalps
4. Candlestick Pattern Detection + Labels
The script identifies and labels four high‑value reversal/continuation patterns:
- Bullish Engulfing → green label above the candle
- Bearish Engulfing → red label below the candle
- Hammer → yellow label below the candle
- Inverted Hammer → orange label above the candle
These labels help traders quickly spot actionable price‑action signals without manually scanning every bar.
Overall Purpose
This tool blends volatility‑based manipulation detection, opening‑range structure, and real‑time candlestick pattern recognition into a single, clean visual system.
It’s built for scalpers and intraday traders who rely on:
- Opening‑range levels
- Liquidity cues
- Manipulation signals
- Price‑action confirmation
to time entries with precision.

3 Trading Sessions [TickDaddy]Customizable 3 trading session indicator. Asia, Longdon, New York. Adjust times for each session, color, opacity. toggle if you want to see future sessions coming up.

HTCTS - Session & Time LiquidityHTCTS - Session & Time Liquidity
1. ภาพรวมการทำงาน (Overview)
อินดิเคเตอร์ตัวนี้ทำหน้าที่ 4 อย่างหลักพร้อมกัน:
Auto DST (ปรับเวลาตามฤดูอัตโนมัติ): คุณไม่ต้องมานั่งแก้เวลาเมื่อตลาดต่างประเทศเปลี่ยนเวลา (Daylight Saving Time) เพราะโค้ดอ้างอิง Timezone ของตลาดนั้นๆ โดยตรง (เช่น NY ใช้ America/New_York)
Session Bars: แสดงแถบสีเล็กๆ ด้านล่างจอเพื่อบอกว่าตอนนี้อยู่ใน Session ไหน (Asia, London, NY AM, NY PM, Thai) แทนการถมสีพื้นหลังซึ่งอาจจะรกตา
High/Low Levels & Sweeps: เมื่อจบ Session โปรแกรมจะตีเส้น High และ Low ของช่วงเวลานั้นทิ้งไว้ ถ้ากราฟวิ่งไปชนเส้นเหล่านั้น (Breakout/Sweep) เส้นจะเปลี่ยนเป็นเส้นประและขึ้นข้อความว่า "(Swept)"
1. Indicator Overview and Purpose (ICT/SMC Framework)
This custom Pine Script indicator is designed specifically for traders utilizing ICT (Inner Circle Trader) or SMC (Smart Money Concepts) methodologies. Its primary function is to simplify the analysis of Time & Price by automatically defining and tracking key market sessions, their resulting liquidity levels (High/Low), and detecting liquidity sweeps (Stop Hunts).
The indicator is designed to be Zero-Maintenance regarding time zones, as it automatically adjusts for Daylight Saving Time (DST) changes in major financial centers (London, New York).
2. Key Features and Logic
A. Automatic DST Handling (Auto-DST)
The script uses specific, location-based time zones for global markets instead of a fixed GMT/UTC offset.
Asia: Uses Asia/Tokyo.
London: Uses Europe/London (Automatically adjusts for BST).
New York (AM/PM): Uses America/New_York (Automatically adjusts for EST/EDT).
This guarantees that the session times displayed on your chart (regardless of your local time, e.g., Thailand GMT+7) always align with the actual opening and closing moments of the corresponding financial market.

HTF FVG + SessionsThis indicator combines multi-timeframe FVG A–C detection with intraday session boxes on a single chart.
It automatically finds bullish and bearish Fair Value Gaps on 15m, 30m, 1H, 4H, 1D and 1W timeframes.
Fresh FVGs are drawn in a transparent gold color, then dynamically shrink as price trades back into the gap.
Once price fully fills the gap, the FVG box and its label are automatically removed from the chart.
After the first touch, each FVG changes to a per-timeframe gray shade, making overlapping HTF gaps easy to see.
You can toggle each timeframe on/off and also globally enable/disable all FVGs from the settings panel.
Session boxes highlight Asia, London, NY AM, NY Lunch and NY PM using soft colored rectangles.
Each session box is plotted from the high to the low of that session and labeled with its name in white text.
A global “Show all session boxes” switch allows you to quickly hide or display the session structure.
This tool is designed for traders who want to combine FVG liquidity maps with clear intraday session context.

USD Session 8FX - LDN & NY (TF-invariant, Live + Table)What changed
Flexible session window
Removed the old fixed NY end-time selector.
Added new inputs so you can pick start time and length:
London: ldnStartSel (default 08:00) and ldnLenSel with options 45/60/90 minutes.
New York: nyStartSel (default 15:30) and nyLenSel with options 45/60/90 minutes.
The session string used by time(refTF, sess, tz) is now built dynamically as "HHMM-HHMM" from start + length (e.g., 1530-1630).
The label shown in the table (winTxt) auto-formats to HH:MM–HH:MM.
New time helpers
addMinutesHHMM() computes the end time from a "HHMM" start plus a minute length.
makeSess() produces the session string "HHMM-HHMM".
prettySess() converts "HHMM-HHMM" → "HH:MM-HH:MM".
(Kept on one line to avoid the “end of line without line continuation” error.)
Stability & UI fixes
Main table now uses table.new(f_pos(tablePos), ...) directly (no undeclared pos variable).
Trade Gate panel uses a properly initialized gatePosEnum before table.new(...) (fixes “Undeclared identifier”).
Minor cleanups; no logic changes.
What did NOT change
Scoring logic: returns → optional ATR normalization → weights → anti-USD vs USD-base averages → final score.
Thresholds: minAbsScore and live intrath alerts are unchanged.
VWAP Gate logic is the same (price vs VWAP consistency depending on USD Strong/Weak).
Freeze/Lock of values at session end is unchanged.
Alerts (session close bias, live threshold cross, and “Entry hint”) are unchanged.
Why this helps (practical impact)
Longer windows (e.g., NY 60/90, LDN 60/90) usually make the score more robust, filtering noise and reducing false signals—at the cost of a slightly slower signal.
You can now A/B test:
London: 45 vs 60 vs 90
New York: 45 vs 60 vs 90
without touching anything else; the indicator adapts automatically.
How to use
Choose Session (London / New York).
Set the start and length for that session.
The background highlight, the winTxt, and the entry/exit logic all follow the dynamic window.
Quick tips to reduce false signals
Try NY 60 or NY 90 and LDN 60 when volatility is choppy.
Keep ATR normalization ON (useATRnorm = true) for more comparable returns.
Consider raising minAbsScore slightly (e.g., from 0.12 → 0.15–0.20) if you still see noise.
Use the VWAP Gate panel: only act when Bias OK and at least one of the Top-3 pairs shows VWAP OK.
If you want, I can add quick presets (buttons) to jump between LDN 45/60/90 and NY 45/60/90, or plot two Scores side by side for direct comparison.

Multi-Session Viewer and AnalyzerFully customizable multi-session viewer that takes session analysis to the next level. It allows you to fully customize each session to your liking. Includes a feature that highlights certain periods of time on the chart and a Time Range Marker.
It helps you analyze the instrument that you trade and pinpoint which times are more volatile than others. It also helps you choose the best time to trade your instrument and align your life schedule with the market.
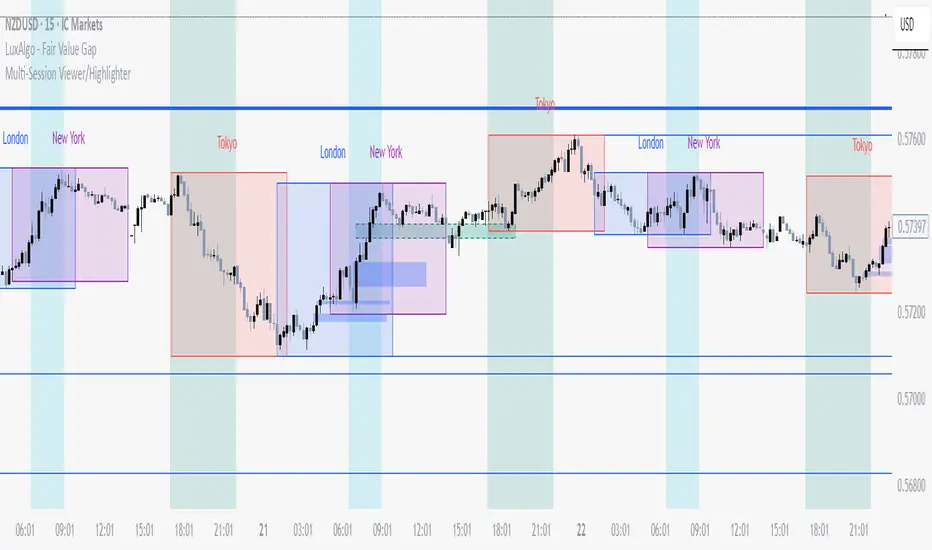
NZDUSD Example:
- 3 major sessions displayed.
- Although this is NZDUSD, Sydney is not the best time to trade this pair. Volatility picks up at Tokyo open.
- I have time to trade in the evening from 18:00 to 22:00 PST. I live in a different time zone, whereas market is based on EST. How does the pair behave during the time I am available to trade based on my time zone? Time Range Marker feature allows you to see this clearly on the chart (black lines).
- I have some time in the morning to trade during New York session, but there is no way I am waking up at 05:00 PST. 06:30 PST seems doable. Blue highlighted area is good time to trade during New York session based on what Bob said. It seem like this aligns with when I am available and when I am able to trade. Volatility is also at its peak.
- I am also available to trade between London close and Tokyo open on some days of the week, but... based on what I see, green highlighted area is clearly showing that I probably don't want to waste my time trading this pair from London close and until Tokyo open. I will use this time for something else rather than be stuck in a range.
Pre-London & London Session (Auto DST) MMMThis indicator automatically marks the Pre-London and London Open sessions for any trading day, with full U.S. Daylight Saving Time (DST) adjustment.
It’s ideal for traders backtesting Gold (XAUUSD) or other pairs sensitive to London liquidity, as it dynamically shifts between UTC-4 and UTC-5 to stay perfectly aligned with institutional session timing.
Features:
🕑 Auto-detects whether the date falls under U.S. Daylight or Standard Time
🟧 Highlights Pre-London session (2 a.m.–3 a.m. EDT / 1 a.m.–2 a.m. EST)
🟩 Highlights London session (3 a.m.–5 a.m. EDT / 2 a.m.–4 a.m. EST)
⚙️ No manual adjustments needed — fully automatic for any backtest date
📈 Perfect for ICT, Smart Money, and liquidity-based session strategies
Recommended settings:
Chart timezone: New York
Works on all symbols and timeframes

Dr.Yazdani V063 Session OR + A-Lines
**ACD Indicator: Mark Fisher's Opening Range Breakout Strategy**
**Overview**
The ACD system, developed by legendary trader Mark Fisher in his book *The Logical Trader*, is a powerful methodology for identifying high-probability trade setups based on the market's opening range (OR). This indicator automates Layers 1 and 2 of the ACD strategy, helping you spot breakout opportunities, trend direction, and key support/resistance levels. Perfect for day traders, scalpers, and swing traders in forex, stocks, futures, or crypto.
**How It Works**
1. **Opening Range (OR)**: Calculated from the high/low of the first X minutes (default: 30-60 min) of major sessions (e.g., Tokyo, London, New York).
2. **A Levels**: Drawn at a percentage (default: 0.5% of OR range or ATR-based) above/below the OR. A breakout above A-Up signals a bullish setup; below A-Down signals bearish.
3. **C Levels**: Wider levels (default: 1-2% or ATR multiplier) for stronger confirmation. Breakouts here confirm trend strength and filter fakeouts.
4. **Pivot Ranges**: Includes daily and N-day pivots to gauge overall market bias (above pivots = bullish; below = bearish).
**Key Features**
- **Customizable Sessions**: Tokyo (00:00-01:00 GMT), London (08:00-09:00 GMT), New York (13:30-14:30 GMT) – adjustable.
- **ATR Integration**: Uses Average True Range for dynamic A/C levels (period: 14 by default).
- **Visual Alerts**: Color-coded lines (green for bullish, red for bearish) + optional labels for breakouts.
- **Pivot Display**: Show/hide daily or multi-day pivots with customizable colors.
- **Risk Management**: Built-in stop-loss suggestions based on OR width.
**Trading Rules**
- **Bullish Setup**: Price breaks and holds above A-Up → Enter long at C-Up confirmation. Target: Next pivot or 1:2 risk-reward.
- **Bearish Setup**: Price breaks below A-Down → Enter short at C-Down.
- **Avoid Fakeouts**: Wait for stabilization (e.g., close above/below level).
- **Trend Filter**: Combine with PMA (Pivot Moving Average) for Layer 3 confirmation (search "ACD PMA" in TradingView).
**Settings Guide**
- **OR Timeframe**: Session start time and duration (e.g., 30 min).
- **A Multiplier (%)**: Distance for A levels (default: 0.5).
- **C Multiplier (%)**: Distance for C levels (default: 1.0).
- **ATR Period**: For volatility-based levels (default: 14).
- **Show Pivots**: Toggle daily/N-day ranges.
This indicator balances supply/demand by analyzing volume and price action within the opening range. Backtest on your favorite pairs (e.g., EURUSD, BTCUSD) and adjust for your style. Not financial advice – always use proper risk management!
**Inspired by**: Mark Fisher's ACD Methodology. Open-source for community review. Questions? Comment below!
#ACD #OpeningRange #Breakout #DayTrading #FisherStrategy

Keks Key Level Fx SessionsThis script is designed to automatically plot and manage key levels for the major FX trading sessions (London, New York, and Asia). It helps traders identify the most relevant price areas that often act as support, resistance, or breakout zones during active market hours.
Key features:
Marks session highs, lows, and midpoints
Visualizes key intraday levels for better market structure analysis
Highlights potential breakout and retest areas
Works across multiple timeframes for flexibility
Clean and minimal chart design to avoid clutter
This tool is especially useful for traders who rely on session-based strategies, such as breakout trading, retests, or range trading, by providing a clear visual guide to the most important price zones.

Asian & London Session High/LowThis Pine Script v6 indicator plots the high and low of the Asian and London trading sessions on the chart before the New York session opens.
Asian session is defined from 00:00 to 08:00 (Europe/Sofia time).
London session is defined from 09:00 to 16:30 (Europe/Sofia time).
The session highs and lows are tracked live and updated as new candles form within the session time ranges.
At 16:30, when the New York session opens, all high/low values are reset to na to prepare for the next day.
Horizontal lines are plotted using plot.style_linebr to extend the lines until the next candle.
This tool helps traders identify key support/resistance zones formed during the most active pre-New York hours.
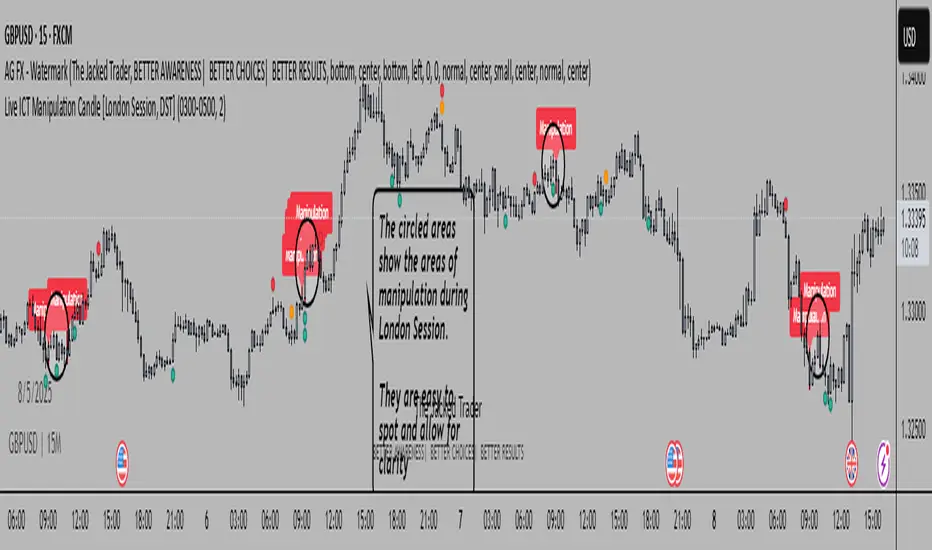
Live ICT Manipulation Candle [London Session, DST]📌 Live ICT Manipulation Candle
🔍 What This Script Does:
This indicator highlights the most volatile ( manipulative ) candle during the London session, based on range and volume, in real-time. It is designed specifically for intraday traders who follow ICT ( Inner Circle Trader ) concepts.
Key Features:
Tracks and highlights the manipulation candle between 3:00 AM to 5:00 AM NY time, adjusted for daylight savings (DST).
Displays a colored box around the manipulation candle and optionally shows a "Manipulation" label ( see chart below ).
Works on 1m, 5m, or 15m charts only — ensures high accuracy and alignment with ICT intraday concepts.
Designed for clarity during live session development.
⚠️ Disclaimer & Transparency:
This script was previously removed by TradingView due to being published with protected ( closed ) source code. I apologize for that oversight.
If you're studying ICT concepts or trading the London session volatility, this script can help you visually anchor the key manipulation point each day!
The indicator doesn't put the circles on. I put them to show the key manipulation areas per London session.
Happy trading and stay sharp!
@TJT_Pro
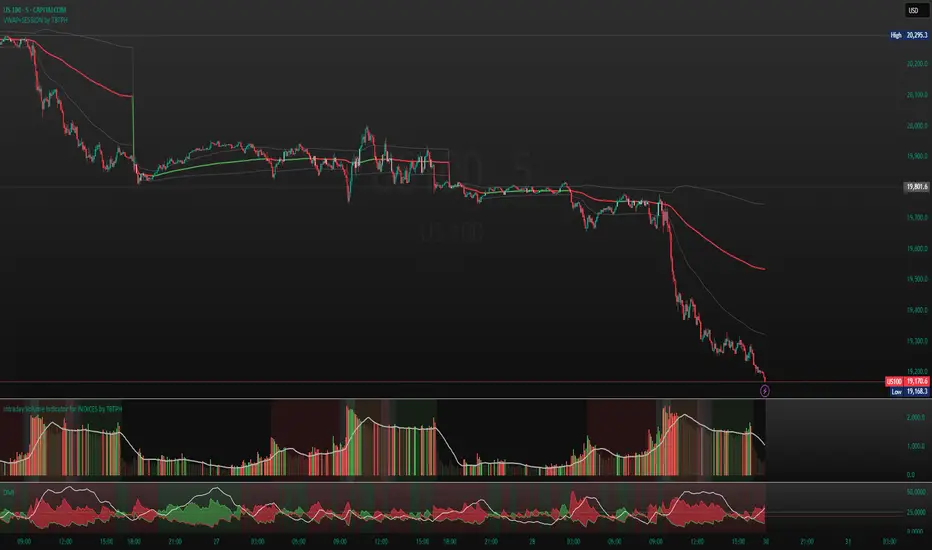
Intraday Volume Indicator for INDICES by TBTPH Pine Script code for an intraday volume indicator with session and lunch break highlights looks great! Here’s a summary of what each part of the script does:
Indicator Settings:
The indicator is set to show on a separate pane (overlay=false).
The SMA Length is adjustable with an input box (default of 20).
Volume and SMA Calculation:
You calculate the Simple Moving Average (SMA) of the volume over the selected length.
The volume color is determined based on whether the close price is higher or lower than the previous close and if the volume is above or below the SMA.
Volume Plot:
Volume is plotted as a histogram with different colors to indicate if the volume is higher or lower than the SMA.
You plot the SMA of the volume with an orange line for easier comparison.
Background Color:
You set a light gray background color to give a subtle contrast.
NYSE and LSE trading sessions are highlighted with green and blue, respectively.
Lunch break periods are highlighted with a white background for both exchanges.
Here are a couple of improvements or suggestions you might consider:
Session Time Overlap Handling:
If the script is applied to a chart where both NYSE and LSE data is visible, they may overlap depending on the time zone of your chart. Ensure the session times align with the active market's timezone, especially if you are using a chart with a different timezone setting.
Color Customization:
The color scheme for bullish/bearish volume could be enhanced further. For example, you could introduce more transparency for low-volume periods to make the histogram appear more subtle during less active trading times.
Handling Different Time Zones:
If your chart is not in the "America/New_York" or "GMT" time zone, be mindful of the session times. The timestamp function depends on the chart’s time zone, so ensuring you're adjusting for different markets is key.
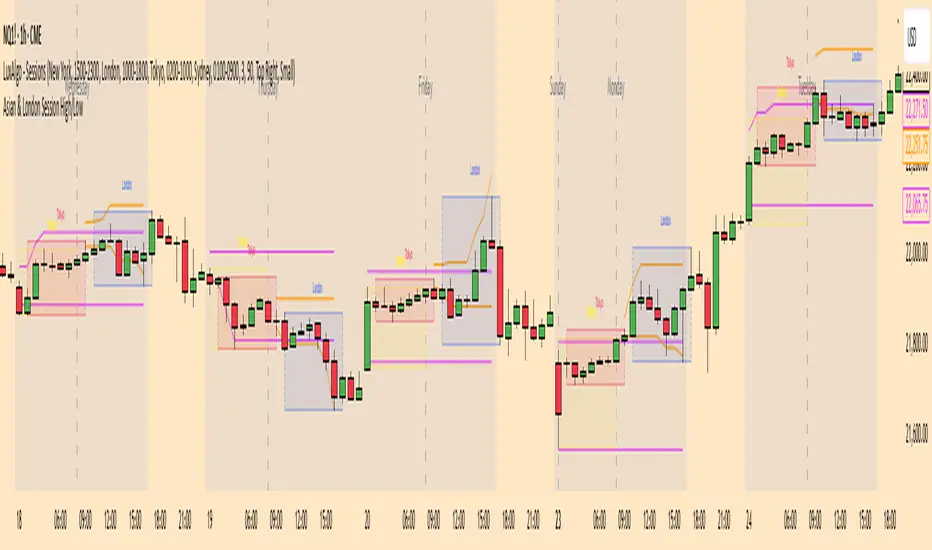
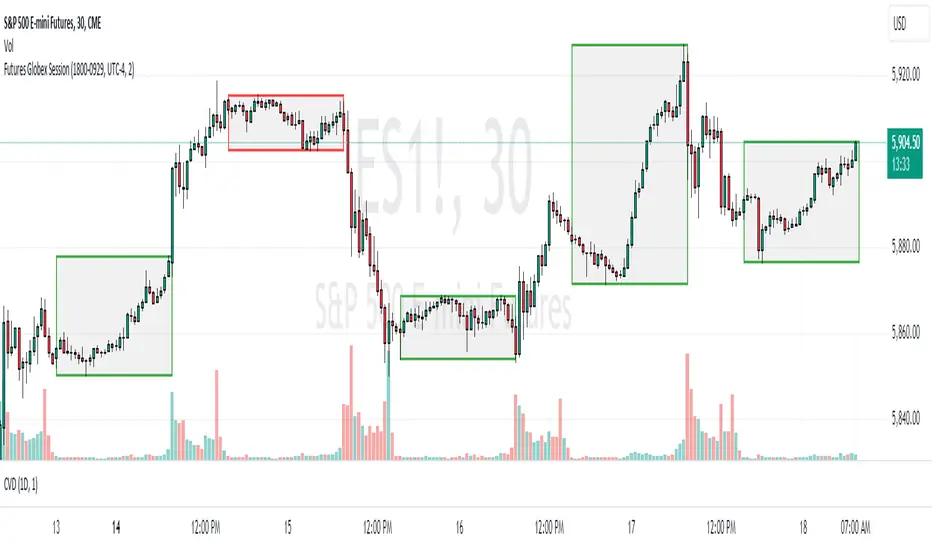
Futures Globex Session(s)This indicator draws a box around the Globex Session for the various Futures markets. The box height defines the highs and lows of that session, and the width defines the timeframe of that session. The boxes are outlined green if price rose during that period, and red if price fell during that period. The default Globex Session is set for the Equity Index Futures and is set in the UTC-4 time zone (Eastern Time). In the settings you can adjust the session time and time zone of your Globex Session to reflect the trading times of that market. Below are the session times for various Futures markets set in time zone UTC-4.
Equity Indexes: 18:00 - 9:30
(ES, NQ, YM, RTY)
Treasuries: 18:00 - 8:20
(ZN, ZB)
Metals: 18:00 - 8:20
(GC)
Energies: 18:00 - 9:00
(CL, NG)
Agricultures: 20:00 - 9:30
(ZS, ZW)
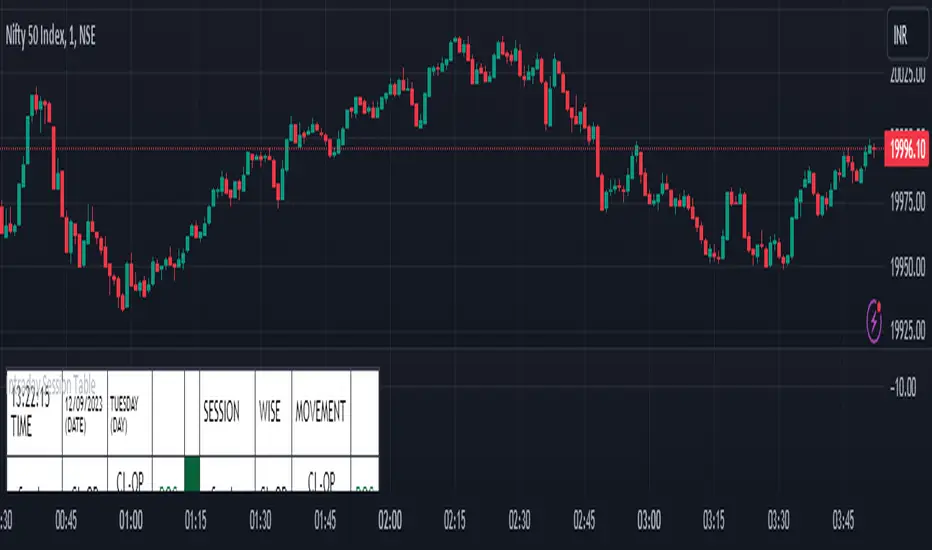
Intraday Session Table Intraday Session Table indicator up dates the values as per session input. By default session input duration is for 15 minutes. It updates the Intraday Closing Price- Open Price (CL-OP) of session at the end of the session. The next column displays the increase / decrease in CL-OP
The third column displays various values viz ROC, Closing Price, RSI(14 bars), MA20, MA50,Momentum(10 bars),Closing Price-Open Price,Net number of bars (Intraday Red bars minus Green bars) and Net intraday volume in millions.The parameters can be selected from the dropdown list in Input Box.
User can CHECK OUT Table input Box and select from the list to see individual charts.
User can analyze the movement of values to ascertain the trend.It gives fair idea of the up and down movement based on the session wise movement of values. The access to individual charts of some of the values help the user to have a graphic picture of the situation.
DISCLAIMER: For educational and entertainment purpose only .Nothing in this content should be interpreted as financial advice or a recommendation to buy or sell any sort of security/ies or investment/s.