DCC Sessions Pro — fixed sessionsDCC Sessions Pro automatically highlights the three main market sessions directly on your candles for a clean and professional chart view.
• Asia (purple): 01:00 – 08:00
• London (blue): 08:00 – 15:30
• US (orange): 15:30 – 23:00
Weekends are automatically excluded so you only see relevant price action.
Perfect for intraday traders who want to track session behavior, volume shifts, and liquidity timing without overlapping colors or messy backgrounds.
Cari dalam skrip untuk "sessions"

Session AnchorsDescription
This indicator highlights the four main global trading sessions — London, New York AM, New York PM, and Asia — as color-coded boxes on the chart. Each session is defined by fixed start/end times (New York time) and dynamically updates with the evolving high and low during that interval. This provides a clear view of how volatility and structure shift as trading activity passes from one region to another.
How to use
• Works on any timeframe.
• Toggle sessions on/off based on your trading hours.
• Observe price behavior as one session closes and another opens.
• Use session boxes as context for liquidity, volatility, and structure analysis.
Originality
This script delivers a clean, customizable visualization of global market hours and session ranges, avoiding extra overlays so traders can isolate session-based behavior without distraction.
⚠️ Disclaimer
This indicator does not generate signals. It provides a structural mapping of global sessions for contextual analysis only.

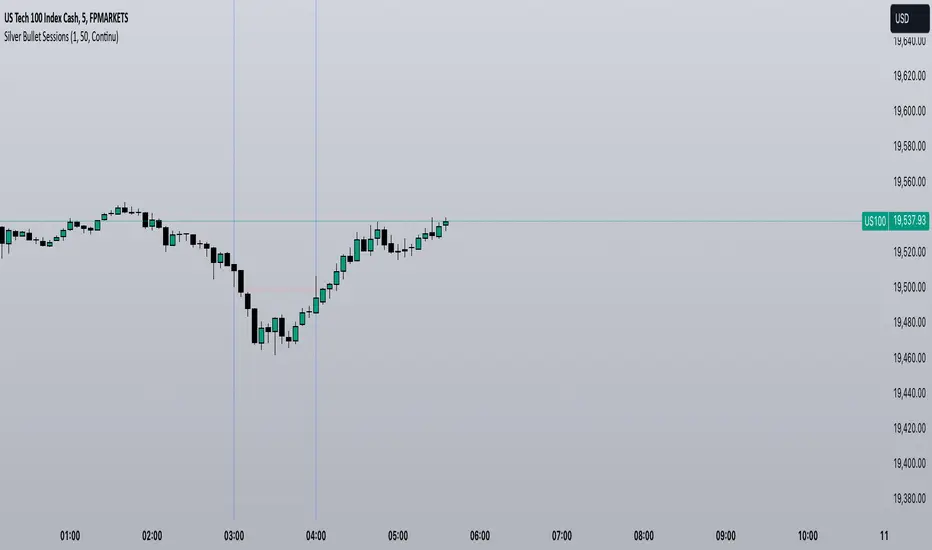
ICT Silver Bullet Zones (All Sessions, Custom Labels)CT Silver Bullet Zones
This indicator is designed for traders who follow the ICT *Silver Bullet* concept.
It automatically marks the **Silver Bullet window** (10:00–11:00 by default) across the **London, New York AM, New York PM, and Asia sessions**, with customizable settings for each session.
### Features:
* Separate adjustable time windows for **London, NY AM, NY PM, and Asia Silver Bullet sessions**.
* Colored session boxes with individual **opacity controls**.
* **Session labels placed at the top** of each zone, with customizable text size, color, and background opacity.
* Works on all timeframes and highlights only the Silver Bullet trading windows.
This tool is meant to help traders quickly identify ICT Silver Bullet opportunities in all major sessions without manual plotting.

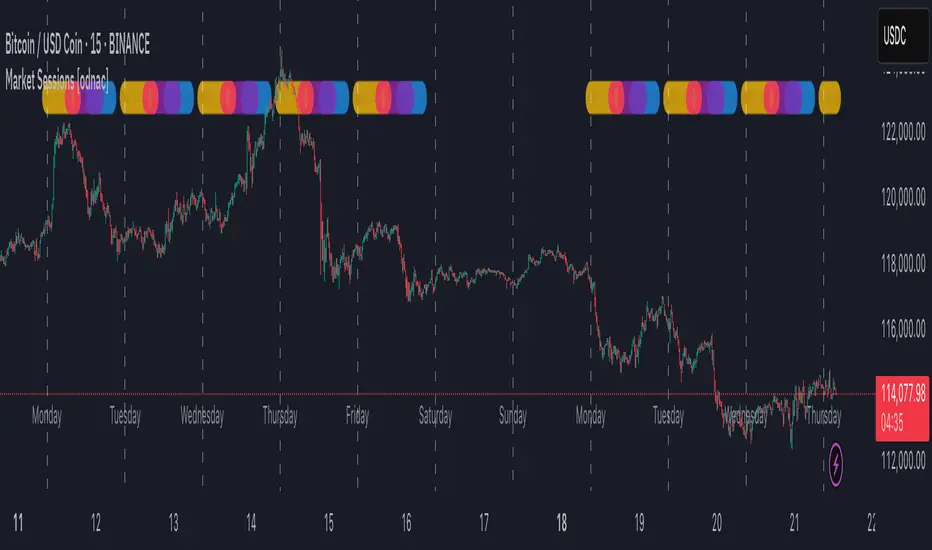
Market Sessions [odnac]
This indicator highlights the three main global market sessions (USA, Europe, Asia) and their overlaps directly on the chart.
It helps traders quickly identify active trading periods and potential high-liquidity overlaps.
Features:
Customizable start and end times for each session
Optional daily dividers with weekday labels
Session markers displayed as circles above the candles
Overlap sessions displayed in distinct colors
Adjustable opacity for better chart visibility
Option to hide weekends
Sessions included:
USA Market Session (default 13:30–20:00 UTC)
Europe Market Session (default 07:00–16:00 UTC)
Asia Market Session (default 00:00–09:00 UTC)
Overlaps: USA + Europe, USA + Asia, Europe + Asia
This tool is designed for intraday timeframes (1m–60m) and can be useful for scalping, day trading, or session-based strategies.
Key Levels & Session Highs/Lows by OdegosProfessional multi-timeframe support and resistance level indicator that automatically tracks and displays key price levels across different trading sessions and timeframes.
🎯 What it shows:
Session Open - Daily market open reference line
Asia & London Sessions - High/low levels from major trading sessions
Previous Day - Yesterday's actual high and low levels
Weekly & Monthly - Higher timeframe support/resistance levels
⚡ Smart Features:
Auto-combines overlapping levels with merged labels
Break detection - Lines stop when price breaks through (optional)
Timezone support - Works with any global timezone
Universal colors - Optimized for both light and dark chart themes
Clean interface - Organized settings with intuitive dropdowns
🛠️ Fully Customizable:
Individual show/hide toggles for each level type
Custom colors, line styles, and widths
Adjustable label text and positioning
Global text color override option
Perfect for day traders, swing traders, and anyone who relies on key support/resistance levels for market analysis.

VWAP Balance Zones - SessionsVWAP Balance Zones Sessions Version is an alternate take on the Original VWAP Balance Zones indicator. The Sessions version allows users to select a specific session to view the VWAP Balance Zones at while still utilizing the full ETH Data.
The Session version provides a better focused display while still maintaining the core functions of the original script with mindful optimizations.
Author's Note: "VBZ Sessions was made with logistics in mind, for the users who only trade within certain times of the day. While it displays the same core concepts, it is not as "Raw" of a display as the Original. For this reason, some users may prefer the Original VWAP Balance Zones, which is why I have opted to release this alternate version instead of updating the original."
> What are VWAP Balance Zones?
"VWAP Balance Zones" is an original concept aimed at identifying the equilibrium area between market participants within the current trend by averaging the Daily Extremes and the Daily VWAP.
Refer to the illustration below for a better understanding of exactly how VWAP Balance Zones are formed:
These zones are displayed for the Daily, Weekly, and Monthly VWAPs, with the most interactive timeframe being the Daily.
> Features
1. The Session Version uses ETH data at all times, and does not solely rely on the chart's data to create the VWAPs or Zones.
This allows the user to focus on a specific trading session, while not losing out on the full VBZ Calculation, with the notable benefit of a cleaner display.
The Original VBZ starts drawing at the beginning of the chart's "Day", and would produce different results when using an RTH chart vs an ETH chart. Along with creating a bird's nest of unusable data at the beginning of the day.
2. Session Start and End lines are displayed for easier identification of the designated trading session.
3. The extreme "Close" Lines are no longer displayed to reduce noise and redundancy.
4. Additionally, the interior VWAP lines are no longer displayed. Ultimately, this was to reduce noise and focus the script on the 50% zones.
5. Weekly and Monthly Zones are now displayed due to the reduced noise!
6. As with the original, the weekly display will yield to the daily, and the monthly display will yield to the weekly.
In the screenshot below, you can observe this behavior.
Enjoy!

Market Session Times by MadDogMoneyMarket Sessions is a simple indicator allowing you to quickly see the 3 Major Trading Session Open and Close times
Three major Sessions - Asia, UK & NY are included.
(The Australian & Asian markets are so close on time, they have been joined for brevity.)
The Open & Close times for each Session is displayed in the Settings in UTC and can be edited depending on the time of year or market you are following.
By setting the Session indicators partially transparent (as is by default), you can quickly see which Market Sessions, and for how long, they overlap.
Additionally, the Indicator can be hidden for different timeframes.
- 1 HR is the upper limit of visibility
- Visibility on the 1HR, 15min and 5min and below can be toggled on an off to fit your requirements.

Silver Bullet SessionsThe Silver Bullet Sessions indicator is a specialized timing tool designed to highlight key market sessions throughout the trading day. By marking specific hours with vertical lines, it helps traders identify potentially significant market moments that often coincide with increased volatility and trading opportunities.
This indicator plots vertical lines at six strategic times during the trading day: 3:00 AM, 4:00 AM, 10:00 AM, 11:00 AM, 2:00 PM, and 3:00 PM. These times are carefully selected to correspond with important market events and session overlaps in the global trading cycle. The early morning hours (3-4 AM) often capture significant Asian market movements and the European market opening. The mid-morning period (10-11 AM) typically corresponds with peak European trading hours and the pre-US market dynamics. The afternoon times (2-3 PM) coincide with key US market activities and the European market close.
The indicator is implemented using Pine Script version 6, ensuring compatibility with the latest TradingView platform features. It employs a clean, efficient coding structure that minimizes resource usage while maintaining reliable performance. The vertical lines are rendered in blue for clear visibility against any chart background, and their width is optimized for easy identification without obscuring price action.
Traders can use these visual markers to:
Plan their entries and exits around these key time periods
Anticipate potential market volatility
Structure their trading sessions around these significant market hours
Identify session-based trading patterns
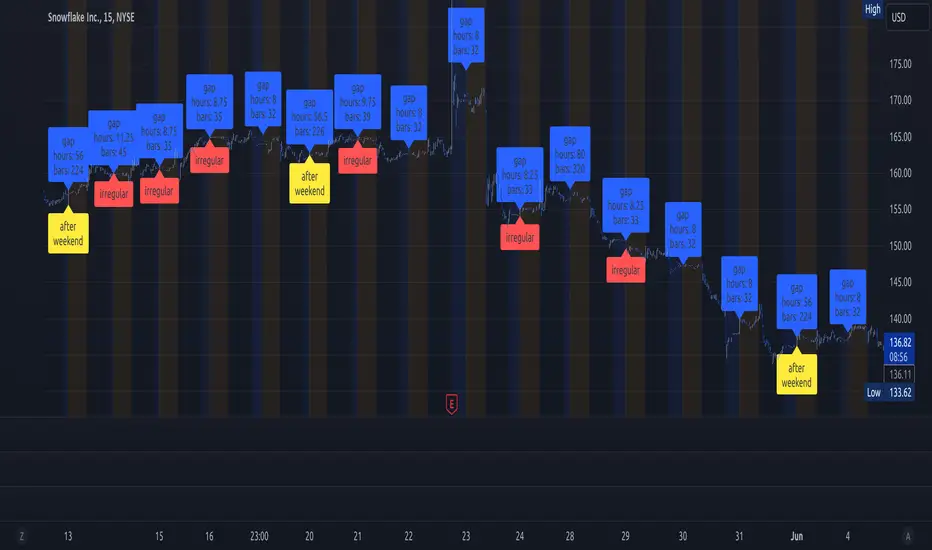
lib_session_gapsLibrary "lib_session_gaps"
simple lib to calculate the gaps between sessions
time_gap()
calculates the time gap between this and previous session (in case of irregular end of previous session, considering extended sessions)
Returns: the time gap between this and previous session in ms (time - time_close )
bar_gap()
calculates the bars missing between this and previous session (in case of irregular end of previous session, considering extended sessions)
Returns: the bars virtually missing between this and previous session (time gap / bar size in ms)
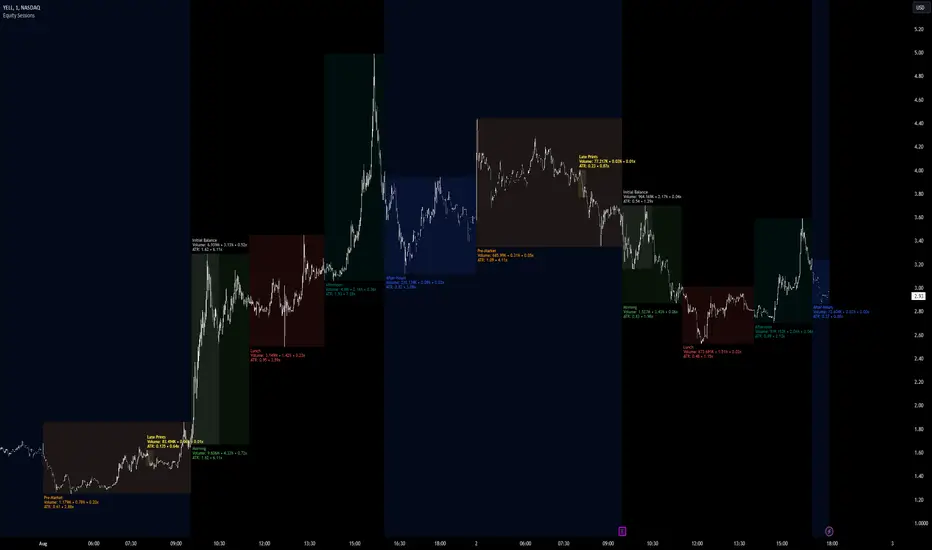
Equity Sessions [vnhilton]Note: Numbers in the chart above, particularly volume, are incorrect as I didn't have extra market data at the time of publication. Default settings are set for US markets.
(OVERVIEW)
This indicator was made specifically for equity markets which have pre-market and after-hours trading, though can be used for any other markets without these sessions, there are many other session indicators better suited for those markets. What makes this indicator different to the hundreds of session indicators out there will be highlighted in bold in the Features section below.
(FEATURES)
- After-Hours session can start earlier if the day ends short and starts after-hours trading earlier due to holidays for example
- Sessions constrained to regular trading hours can also adjust for short days as well
- Show volume for each session and also as a percentage/multiplier of day volume, average day volume with customisable period
- Show range for each session and also as a percentage/multiplier of the daily ATR with customisable period
- Lookback period for the boxes
- Customisable text size, placement, colour, name
- Customisable session lengths and constraints (regular trading hours or all including extending trading hours)
- Customisable border widths, styles and colours, and session background colour
- Toggles to show/hide sessions, volume, day volume, average day volume, session range and day ATR
ICT Killzones + Pivots [TFO]Designed with the help of TTrades and with inspiration from the ICT Everything indicator by coldbrewrosh, the purpose of this script is to identify ICT Killzones while also storing their highs and lows for future reference, until traded through.
There are 5 Killzones / sessions whose times and labels can all be changed to one's liking. Some prefer slight alterations to traditional ICT Killzones, or use different time windows altogether. Either way, the sessions are fully customizable. The sessions will auto fit to keep track of the highs and lows made during their respective times, and these pivots will be extended until they are invalidated.
There are also 4 optional Open Price lines and 4 vertical Timestamps, where the user can change the time and style of each one as well.
To help maintain a clean chart, we can implement a Cutoff Time where all drawings will stop extending past a certain point. The indicator will apply this logic by default, as it can get messy with multiple drawings starting and stopping throughout the day at different times.
Given the amount of interest I've received about this indicator, I intend to leave it open to suggestions for further improvements. Let me know what you think & what you want to see added!

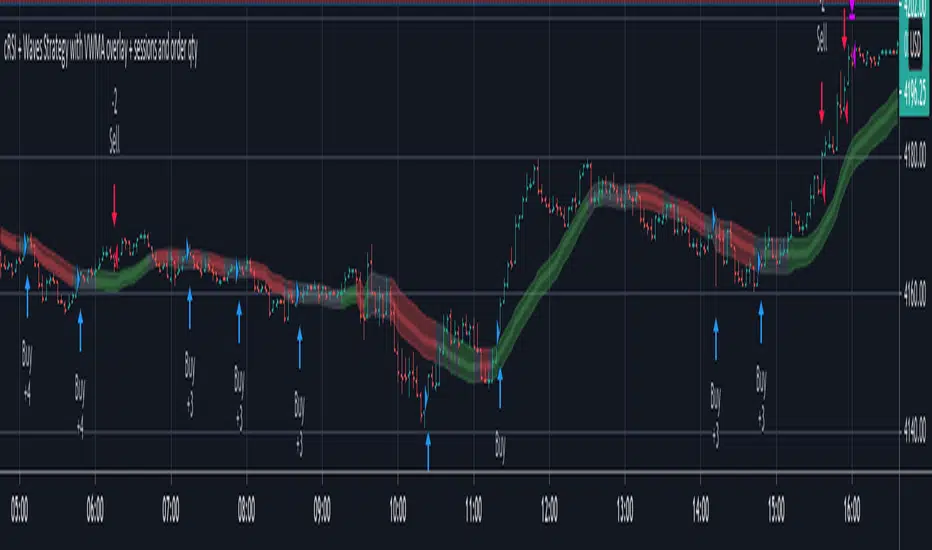
cRSI + Waves Strategy with VWMA overlay + sessions and order qtyThis is a fork of the cRSI + Waves Strategy with VWMA overlay strategy by Dr_Roboto , which adds two additional features, namely:
the ability to limit trade signals to certain defined periods of time ("Sessions") during the trading day and, optionally, to close any open position at the end of either or both "Sessions"
the ability to control the maximum order size suggested by the strategy on the "Inputs" tab of the strategy's "Settings" window
If you are trading on a daily chart (or longer) you must disable the Limit Signals to Trading Sessions? option in order for the strategy to produce signals.
All other features are identical to the original strategy (revision 2.0).
Price Action and 3 EMAs Momentum plus Sessions FilterThis indicator plots on the chart the parameters and signals of the Price Action and 3 EMAs Momentum plus Sessions Filter Algorithmic Strategy. The strategy trades based on time-series (absolute) and relative momentum of price close, highs, lows and 3 EMAs.
I am still learning PS and therefore I have only been able to write the indicator up to the Signal generation. I plan to expand the indicator to Entry Signals as well as the full Strategy.
The strategy works best on EURUSD in the 15 minutes TF during London and New York sessions with 1 to 1 TP and SL of 30 pips with lots resulting in 3% risk of the account per trade. I have already written the full strategy in another language and platform and back tested it for ten years and it was profitable for 7 of the 10 years with average profit of 15% p.a which can be easily increased by increasing risk per trade. I have been trading it live in that platform for over two years and it is profitable.
Contributions from experienced PS coders in completing the Indicator as well as writing the Strategy and back testing it on Trading View will be appreciated.
STRATEGY AND INDICATOR PARAMETERS
Three periods of 12, 48 and 96 in the 15 min TF which are equivalent to 3, 12 and 24 hours i.e (15 min * period / 60 min) are the foundational inputs for all the parameters of the PA & 3 EMAs Momentum + SF Algo Strategy and its Indicator.
3 EMAs momentum parameters and conditions
• FastEMA = ema of 12 periods
• MedEMA = ema of 48 periods
• SlowEMA = ema of 96 periods
• All the EMAs analyse price close for up to 96 (15 min periods) equivalent to 24 hours
• There’s Upward EMA momentum if price close > FastEMA and FastEMA > MedEMA and MedEMA > SlowEMA
• There’s Downward EMA momentum if price close < FastEMA and FastEMA < MedEMA and MedEMA < SlowEMA
PA momentum parameters and conditions
• HH = Highest High of 48 periods from 1st closed bar before current bar
• LL = Lowest Low of 48 periods from 1st closed bar from current bar
• Previous HH = Highest High of 84 periods from 12th closed bar before current bar
• Previous LL = Lowest Low of 84 periods from 12th closed bar before current bar
• All the HH & LL and prevHH & prevLL are within the 96 periods from the 1st closed bar before current bar and therefore indicative of momentum during the past 24 hours
• There’s Upward PA momentum if price close > HH and HH > prevHH and LL > prevLL
• There’s Downward PA momentum if price close < LL and LL < prevLL and HH < prevHH
Signal conditions and Status (BuySignal, SellSignal or Neutral)
• The strategy generates Buy or Sell Signals if both 3 EMAs and PA momentum conditions are met for each direction and these occur during the London and New York sessions
• BuySignal if price close > FastEMA and FastEMA > MedEMA and MedEMA > SlowEMA and price close > HH and HH > prevHH and LL > prevLL and timeinrange (LDN&NY) else Neutral
• SellSignal if price close < FastEMA and FastEMA < MedEMA and MedEMA < SlowEMA and price close < LL and LL < prevLL and HH < prevHH and timeinrange (LDN&NY) else Neutral
Entry conditions and Status (EnterBuy, EnterSell or Neutral)(NOT CODED YET)
• ENTRY IS NOT AT THE SIGNAL BAR but at the current bar tick price retracement to FastEMA after the signal
• EnterBuy if current bar tick price <= FastEMA and current bar tick price > prevHH at the time of the Buy Signal
• EnterSell if current bar tick price >= FastEMA and current bar tick price > prevLL at the time of the Sell Signal

Key levels by Chav3zNY-Time Anchored Sessions
Visualizes the Asia, London, and New York sessions using customizable boxes or high/low lines. Unlike standard session indicators, this tool uses the America/New York time zone to ensure your session start and end times remain accurate throughout Daylight Savings changes.
2. Dynamic HTF Key Levels (PDH/PDL, PWH/PWL, PMH/PML)
Automatically plots the Previous Daily, Weekly, and Monthly Highs and Lows.
Clean Intraday Origin: To prevent "chart clutter," these lines do not drag across the entire historical data. They originate at the start of the current day (NY Midnight), providing a clean horizontal reference for the current trading session.
Lookback Control: Choose how many days of historical key levels you want to remain visible on your chart.
3. Custom Time-Anchored Levels
Includes two fully customizable "Price Anchors" (e.g., Midnight Open, 09:30 AM NY Open).
Origin Point Precision: Lines start exactly at the candle of the specified time (e.g., 09:30) and extend forward, rather than drawing through the pre-market.
Price Capture: Choose to anchor to the Open, High, or Low of that specific timestamp.
4. Full Aesthetic Customization
Every level (Daily, Weekly, Monthly, and Custom) can be individually styled:
Color & Visibility: Set each level to your preferred color (Defaulted to Black for a clean look).
Line Style: Toggle between Solid, Dashed, or Dotted lines.
Thickness: Adjust the line width (1px, 2px, etc.) for better visibility on high-resolution screens.
How to Use
Midnight Open: Set Level 1 to 0000 to track the Daily Open, a crucial level for determining daily bias.
NY Open: Set Level 2 to 0930 to mark the "Opening Range" anchor for the New York session.
Liquidity Targets: Use the PDH/PDL and PWH/PWL levels to identify draw-on-liquidity areas for intraday scalp or swing setups.

Session Liquidity & FibsThis is a comprehensive, all-in-one toolkit designed for traders utilizing ICT concepts and time-based liquidity runs. The Session Liquidity & Fibs indicator automates the tedious process of marking up charts, allowing you to focus on price action and execution.
This indicator focuses on "Reverse Engineering" the daily narrative by plotting key sessions, mitigation lines, specific Fibonacci retracement setups, and Higher Timeframe (HTF) liquidity pools automatically.
Key Features:
1. Dynamic Session Killzones Automatically highlights key trading sessions with customizable boxes and extends the High/Low liquidity lines forward until they are mitigated (hit by price).
Asia Range: (Default 20:00 - 00:00)
London Session: (Default 02:00 - 05:00)
NY AM Session: (Default 09:30 - 11:00)
NY PM Session: (Default 13:30 - 16:00)
Note: Lines automatically cut off once price trades through them, keeping your chart clean.
2. Institutional Fibonacci Setups Auto-drawing Fibonacci anchors based on specific time windows to identify OTE (Optimal Trade Entry) and key extensions.
Overnight Fib: Measures the range from 18:00 to 05:00.
9 AM "Silver Bullet" Fib: Measures the 09:00 - 10:00 candle range to determine the morning bias.
Includes standard institutional levels (0, 1, 0.236, 0.786).
3. Higher Timeframe (HTF) Matrix Never lose track of the bigger picture. This tool plots major liquidity levels from higher timeframes onto your intraday chart:
Daily: True Day Open (TDO), Previous Day High/Low (PDH/PDL), and Daily Equilibrium (50%).
Weekly: Previous Week High/Low and Weekly Equilibrium.
Macro: Monthly and Quarterly Highs/Lows + 50% levels.
4. Price Action Helpers
Engulfing / Outside Bar Detector: Highlights bars that fully engulf the previous candle's range (Higher High & Lower Low). These are often key volatility candles used to draw manual Fibonacci ranges or identify immediate reversals.
Previous Bar 50%: Automatically marks the midpoint of the previous candle, useful for immediate rebalancing entries.
Settings & Customization:
Fully customizable colors for every session and level.
Toggle any feature on or off to suit your specific strategy.
Adjustable lookback history to manage chart load.
Usage: This indicator is best used on intraday timeframes (1m, 5m, 15m) for Futures (NQ, ES) and Forex pairs. It is designed to help you spot liquidity sweeps and session reversals without manually drawing every box and line.
This indicator is a Work In Progress. I created this tool primarily for myself to consolidate everything I need for my personal trading style into a single, efficient indicator. However, I am sharing it in case others find it useful. If you are using this and have requests for changes or ideas on how to make it better, please leave a comment or reach out, I will look into what I can do to improve it.

Trading Sessions + IB [midst]What It Does
Displays the three major global trading sessions (Asia, London, New York) with Initial Balance (IB) ranges and extension levels. Automatically detects instrument type (ES, NQ, Gold, Silver) and applies correct IB period.
Key Features
Session Boxes: Visual high-to-low range for each session
Initial Balance: First 60 minutes of session range with IB high/mid/low lines
IB Extensions: Automatic calculation of +/-25%, 50%, 100% levels
Live IB Tracker: Real-time statistics table showing IB range, analysis, and market structure
Fully Customizable: Colors, line styles, labels, and display options
Why Use This
Identify key support/resistance levels based on session structure
Track IB breakouts for high-probability trade setups
Use extensions as profit targets or reversal zones
Compare session ranges to gauge volatility
Spot session overlaps for increased liquidity
Default Times (Chicago/Central Time)
Asia: 5:00 PM - 2:00 AM
London: 2:00 AM - 11:00 AM
New York: 7:30 AM - 4:00 PM
How To Use
Add indicator to your chart (works best on 5-15 minute timeframes)
Indicator auto-detects ES, NQ, GC, SI and applies correct 60-minute IB
Watch for price action at IB levels and extensions
Use IB Tracker table for real-time market analysis
Customization
Adjust everything: session times, IB period, colors, line styles, labels, table position. Toggle historical sessions, IB boxes, lines, extensions, and more.
Supported Instruments: ES/MES, NQ/MNQ, GC/MGC (Gold), SI (Silver) - auto-detection included

Range Deviations PRO | Trade SymmetryRange Deviations PRO — Extended Session Levels
An enhanced version of the original Range Deviations by @joshuuu, retaining the full core logic while adding a key upgrade:
🔹 All session ranges, midlines, and deviation levels now extend into the next trading session, giving seamless multi-session context.
Supports Asia, CBDR, Flout, ONS, and Custom Sessions — with options for half/full standard deviations, equilibrium, and range boxes exactly as in the original.
Extending these levels helps identify:
• Liquidity sweeps
• Trap moves / false breaks
• Daily high/low projections
• Premium–discount behavior across sessions
Ideal for traders using ICT concepts who want clearer continuation of session structure into the next day.
Credit: Original logic by @joshuuu — enhancements by TradeSymmetry.
Disclaimer: Educational use only. Not financial advice.

EMA + Sessions + RSI This is a simple on-demand indicator. It includes 3 customizable exponential moving averages, three customizable market sessions, and a table showing the status of the RSI
-3 Custom EMAs
-3 Custom Sessions
-1 RSI Table

ATR + EMA + Sessions ProATR + EMA + Sessions Pro By Saeed Fadi to save indicator space, it,s for atr, emas, sessions etc.

Dynamic Sessions - Asia, London, New YorkThis indicator lets you set trading sessions (custom sessions) and print them out as dynamic polyboxes instead of traditional rectangles which lets you identify strong moves and trends easier.

Market Sessions & Daily Range ProThis tool is designed for market visualization. It displays the real trading sessions (Asia, Europe, and America) together with the daily range (00:00–24:00). Boxes and labels show daily highs, lows, open/close levels, and current extremes. The purpose is to provide traders with a clear visual map of how price behaves across sessions and within the daily structure.

Session Visualizer by Timezone (Fixed)Session Visualizer by Timezone (Asia, London, New York)
This indicator highlights the Asian, London, and New York trading sessions directly on your chart — adjusted to your local timezone (via UTC offset).
🔧 Key Features:
Session times automatically adjust based on your chosen UTC offset
Toggle each session on/off individually
Custom background colors for each session
Designed for all intraday timeframes (1m – 4H)
📍 Sessions Covered:
Asian Session – Generally lower volatility and slower price movement; ideal for range traders and pre-positioning
London Session – Marked increase in volatility as European markets open
New York Session – Highest volume and volatility, especially during the London-New York overlap
🕓 Time Offset Setting:
Input your local UTC offset (e.g., UTC+10 for Sydney, UTC+1 for Berlin, UTC-5 for New York). The indicator adjusts session display accordingly.

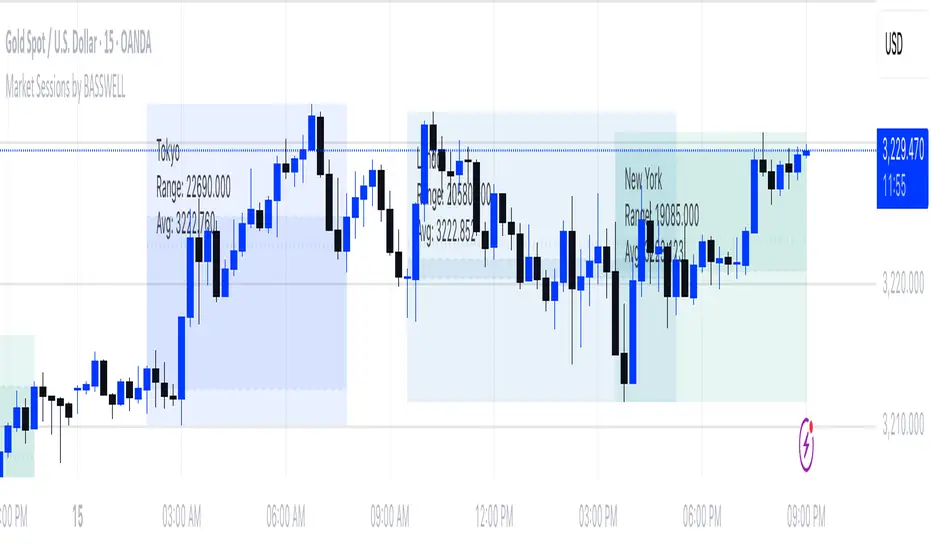
Market Sessions by BASSWELLThis TradingView indicator visually highlights major global trading sessions (Tokyo, London, New York) directly on intraday charts. It provides a clear, color-coded display of session activity and key statistics to help traders better understand session dynamics and overlaps.
✅ Key Features:
Visual Session Boxes: Draws background boxes for each session with configurable colors.
Session Names: Displays the name of each session as a label above the session box.
Open/Close Lines: Optionally shows dashed lines at session open and close prices.
Average Price Line: Plots the average session price as a dotted line.
Tick Range Display: Calculates and shows the high-low range in ticks.
Time Zone Support: Fully timezone-aware via IANA definitions (e.g. "Europe/London").
Overlap Handling: Automatically dims older sessions when a new one starts for visual clarity.
🔧 Configurable Parameters:
Show/hide each session individually.
Set session times and timezones.
Customize label visibility and box contents.
Adjust session colors with transparency.
Includes basic visual styling for better chart readability.
⚠️ Note: Works only on intraday timeframes. Daily/weekly/monthly charts are not supported.