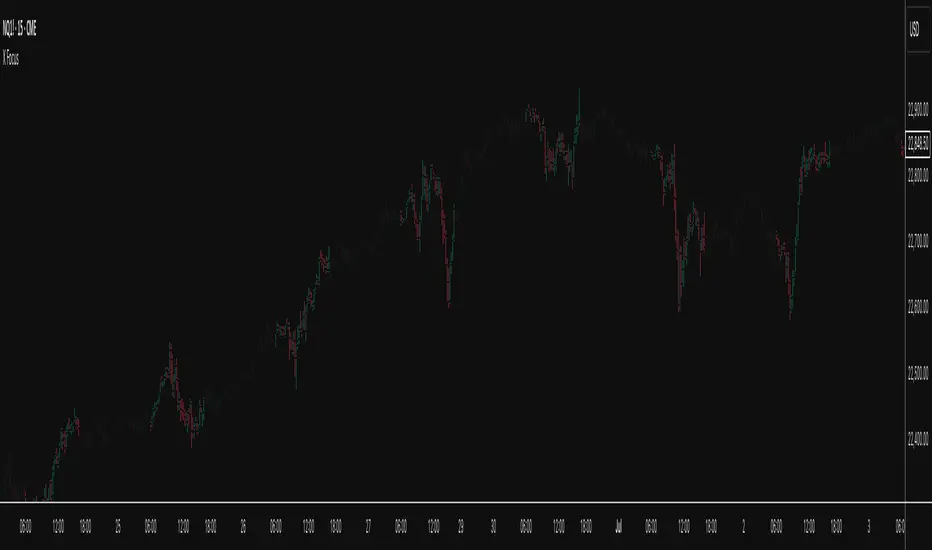
X FocusDesigned to help traders reduce distractions by de-emphasizing specific time ranges on the chart. Instead of highlighting high-activity zones, this tool intentionally applies a muted overlay to selected sessions, allowing traders to concentrate on price action that occurs outside those designated ranges.
Core Purpose
The primary goal of this indicator is to combat the “noise” that often arises during certain periods, such as overnight sessions or pre-market trading. By visually softening those areas, traders can focus on the more relevant trading windows WITHOUT losing any time-based context. Unlike traditional tools that remove data entirely, X Focus preserves all candlestick and price information—ensuring that key levels, gaps, or reference values are still visible.
Key Features
Custom Session Filtering
Users can define up to three time ranges depending on preference. This flexibility allows for tailoring the indicator to different market strategies.
De-Emphasis by Design
Instead of masking or deleting data, the indicator overlays a semi-transparent shading box over the chosen sessions. This ensures traders remain aware of the data while maintaining visual focus on the price action outside of the selected time blocks.
Dual Utility – Highlight or Suppress
While built on the principle of minimizing distractions, the same framework can also be used in reverse to highlight specific areas of interest. This versatility makes it suitable for both noise-reduction and spotlighting critical ranges.
Dark Mode / Light Mode
Adjustable color schemes allow seamless integration into any chart setup, whether the user prefers dark or light backgrounds.
Non-Intrusive Visualization
The shading effect is applied without altering price bars, indicators, or other overlays. This ensures compatibility with existing technical tools and strategies.
Use Case
Traders who find themselves reacting too strongly to inconsequential movements during certain times (such as after-hours or low-volume sessions) can benefit from the X Focus indicator. It helps maintain clarity and discipline by visually guiding attention toward the periods that matter most—without erasing or ignoring potentially useful price references.
Cari dalam skrip untuk "sessions"
Trading Macro Windows by BW v2
Trading Macros by BW: Integrating ICT Concepts for Session Analysis
This indicator combines two key Inner Circle Trader (ICT) concepts—Change in State of Delivery (CISD) or Inverted Fair Value Gap (IFVG) signals with Macro Time Windows—to provide a unified tool for analyzing intraday price action, particularly during Pacific Time (PT) sessions. Rather than simply merging existing scripts, this integration creates a cohesive visual framework that highlights how macro consolidation periods interact with potential reversal or continuation signals like CISD or IFVG. By overlaying macro candle styling and borders on the chart alongside selectable signal lines, traders can better contextualize setups within ICT's macro narrative, where price often manipulates liquidity during these windows before displacing toward higher-timeframe objectives.
Core Components and How They Work Together:
Macro Time Windows (Inspired by ICT's Macro Periods):
ICT emphasizes "macro" as 30-minute windows (e.g., 06:45–07:15 PT, 07:45–08:15 PT, up to 11:45–12:15 PT) where price tends to consolidate, sweep liquidity, or form key structures like Fair Value Gaps (FVGs). These periods set the stage for the session's directional bias.
The indicator styles candles within these windows using a user-defined color for wicks, borders, and bodies (translucent for visibility). This visual emphasis helps traders focus on activity inside macros, where reversals or continuations often originate.
Borders are drawn as vertical lines at the start and end of each window (with a +5 minute buffer to capture related activity), using a dotted style by default. This creates a "study zone" that encapsulates macro events, allowing traders to assess if price is respecting or violating these zones in alignment with broader ICT models like the Power of 3 (AMD cycle).
Toggle: "Macro Candles Enabled" (default: true) – Turn off to disable styling and borders if focusing solely on signals.
CISD or IFVG Signals (Selectable Mode):
Mode Selection: Choose between "Change in the State of Delivery" (CISD) or "IFVG" (default: IFVG). Both detect shifts in market delivery during specific 30-minute slices (15–45 or 17–45 minutes past the hour in PT sessions).
CISD Mode: Based on ICT's definition of a sudden directional shift, this identifies aggressive displacements after sweeping recent highs/lows. It uses a rolling reference high/low over 6 bars, checks for sweeps (penetrating by at least 2 ticks in the last 2-3 bars), reclamation (closing beyond the reference with at least 50% body), and displacement (50% of prior range or an immediate FVG of 6+ ticks). Signals plot a horizontal line from the close, extending 24 bars right, labeled "CISD."
IFVG Mode: Focuses on Inverted Fair Value Gaps, where a bullish FVG (low > high by 13+ ticks) forms but is inverted (closed below) in the same slice, signaling bearish intent (or vice versa). This targets violations against opposing liquidity, often leading to raids on external ranges. Signals plot similarly, labeled "IFVG."
Shared Logic: Both modes enforce a 55-bar cooldown to prevent clustering, operate only during PT sessions (06:30–13:00), and use tick-based thresholds for precision across instruments. The integration with macros allows traders to see if signals occur within or at the edges of macro windows, enhancing confirmation—for example, a CISD inside a macro might indicate a manipulated reversal toward the session's true objective.
Toggle: "Signals Enabled" (default: true) – Turn off to hide all signal lines and labels, isolating the macro visualization.
How Components Interact:
Macro windows provide the "narrative context" (consolidation/manipulation), while CISD/IFVG signals detect the "delivery shift" (displacement). Together, they form a mashup that justifies publication: isolated signals can be noisy, but when filtered by macro periods, they align with ICT's session model. For instance, an IFVG inversion during a macro might confirm a liquidity sweep before targeting PD arrays or order blocks.
No external dependencies; all calculations are self-contained using Pine's built-in functions like ta.highest/lowest for references and time-based sessions for windows.
Usage Guidelines:
Apply to intraday charts (e.g., 1-5 min) or stocks during PT hours.
Look for confluence: A bull IFVG signal post-macro low sweep might target the next macro high or daily bias.
Customize colors/styles for signals (solid/dashed/dotted lines) and macros to suit your chart.
Backtest in replay mode to observe how macros frame signals—e.g., price often respects macro borders as S/R.
Limitations: Timezone-fixed to PT (America/Los_Angeles); signals are directional hints, not trade entries. Combine with ICT tools like order blocks or liquidity pools for full setups.
This script draws from community ICT implementations but refines them into a single, purpose-built tool for macro-driven trading, reducing chart clutter while emphasizing interconnected concepts. Feedback welcome!

Enigma Sniper 369The "Enigma Sniper 369" is a custom-built Pine Script indicator designed for TradingView, tailored specifically for forex traders seeking high-probability entries during high-volatility market sessions.
Unlike generic trend-following or scalping tools, this indicator uniquely combines session-based "kill zones" (London and US sessions), momentum-based candle analysis, and an optional EMA trend filter to pinpoint liquidity grabs and reversal opportunities.
Its originality lies in its focus on liquidity hunting—identifying levels where stop losses are likely clustered (around swing highs/lows and wick midpoints)—and providing visual entry zones that are dynamically removed once price breaches them, reducing clutter and focusing on actionable signals.
The name "369" reflects the structured approach of three key components (session timing, candle logic, and trend filter) working in harmony to snipe precise entries.
What It Does
"Enigma Sniper 369" identifies potential buy and sell opportunities by drawing two types of horizontal lines on the chart during user-defined London and US
session kill zones:
Solid Lines: Mark the swing low (for buys) or swing high (for sells) of a trigger candle, indicating a potential entry point where stop losses might be clustered.
Dotted Lines: Mark the 50% level of the candle’s wick (lower wick for buys, upper wick for sells), serving as a secondary confirmation zone for entries or tighter stop-loss placement.
These lines are plotted only when specific candle conditions are met within the kill zones, and they are automatically deleted once the price crosses them, signaling that the liquidity at that level has likely been grabbed. The indicator also includes an optional EMA filter to ensure trades align with the broader trend, reducing false signals in choppy markets.
How It Works
The indicator’s logic is built on a multi-layered approach:
Kill Zone Timing: Trades are only considered during user-defined London and US session hours (e.g., London from 02:00 to 12:00 UTC, as seen in the screenshots). These sessions are known for high volatility and liquidity, making them ideal for capturing institutional moves.
Candle-Based Momentum Logic:
Buy Signal: A candle must close above its midpoint (indicating bullish momentum) and have a lower low than the previous candle (suggesting a potential liquidity grab below the previous swing low). This is expressed as close > (high + low) / 2 and low < low .
Sell Signal: A candle must close below its midpoint (bearish momentum) and have a higher high than the previous candle (indicating a potential liquidity grab above the previous swing high), expressed as close < (high + low) / 2 and high > high .
These conditions ensure the indicator targets candles that break recent structure to hunt stop losses while showing directional momentum.
Optional EMA Filter: A 50-period EMA (customizable) can be enabled to filter signals based on trend direction.
Buy signals are only generated if the EMA is trending upward (ema_value > ema_value ), and sell signals require a downward EMA trend (ema_value < ema_value ). This reduces noise by aligning entries with the broader market trend.
Liquidity Levels and Deletion Logic:
For a buy signal, a solid green line is drawn at the candle’s low, and a dotted green line at the 50% level of the lower wick (from the candle body’s bottom to the low).
For a sell signal, a solid red line is drawn at the candle’s high, and a dotted red line at the 50% level of the upper wick (from the body’s top to the high).
These lines extend to the right until the price crosses them, at which point they are deleted, indicating the liquidity at that level has been taken (e.g., stop losses triggered).
Alerts: The indicator includes alert conditions for buy and sell signals, notifying traders when a new setup is identified.
Underlying Concepts
The indicator is grounded in the concept of liquidity hunting, a strategy often employed by institutional traders. Markets frequently move to levels where stop losses are clustered—typically just beyond swing highs or lows—before reversing in the opposite direction. The "Enigma Sniper 369" targets these moves by identifying candles that break structure (e.g., a lower low or higher high) during high-volatility sessions, suggesting a potential sweep of stop losses. The 50% wick level acts as a secondary confirmation, as this midpoint often represents a zone where tighter stop losses are placed by retail traders. The optional EMA filter adds a trend-following element, ensuring entries are taken in the direction of the broader market momentum, which is particularly useful on lower timeframes like the 15-minute chart shown in the screenshots.
How to Use It
Here’s a step-by-step guide based on the provided usage example on the GBP/USD 15-minute chart:
Setup the Indicator: Add "Enigma Sniper 369" to your TradingView chart. Adjust the London and US session hours to match your timezone (e.g., London from 02:00 to 12:00 UTC, US from 13:00 to 22:00 UTC). Customize the EMA period (default 50) and line styles/colors if desired.
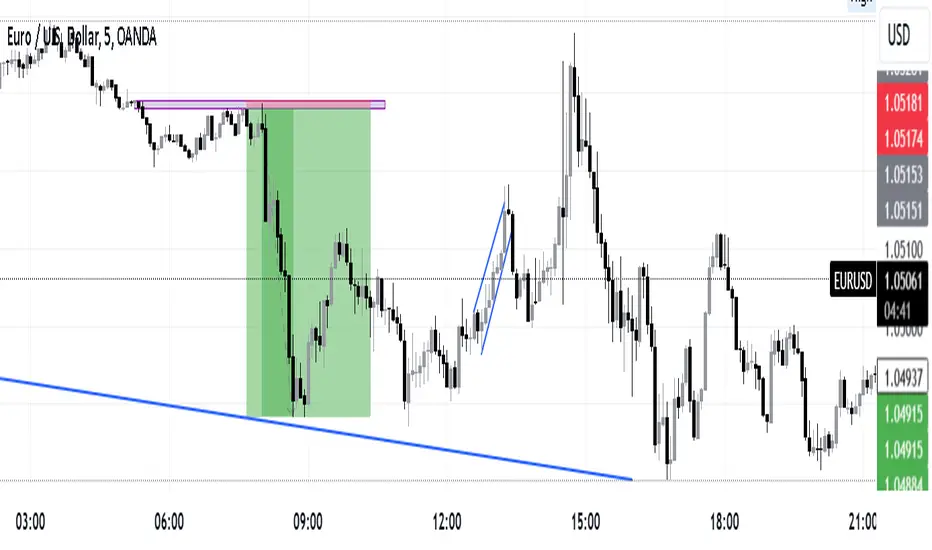
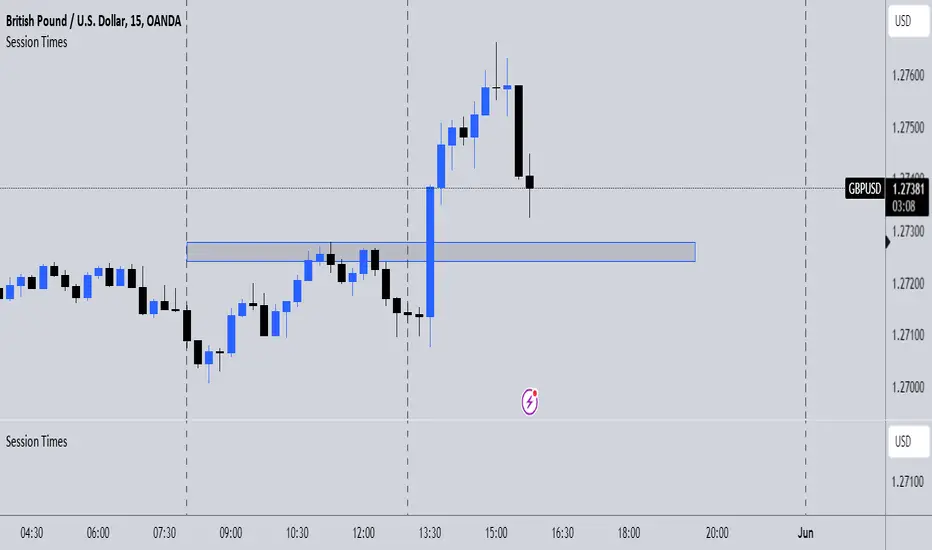
Identify Kill Zones: The indicator highlights the London session in light green and the US session in light purple, as seen in the screenshots. Focus on these periods for signals, as they are the most volatile and likely to produce liquidity grabs.
Wait for a Signal: Look for solid and dotted lines to appear during the kill zones:
Buy Setup: A solid green line at the swing low and a dotted green line at the 50% lower wick level indicate a potential buy. This suggests the market may have grabbed liquidity below the swing low and is now poised to move higher.
Sell Setup: A solid red line at the swing high and a dotted red line at the 50% upper wick level indicate a potential sell, suggesting liquidity was taken above the swing high.
Place Your Trade:
For a buy, set a buy limit order at the dotted green line (50% wick level), as this is a more conservative entry point. Place your stop loss just below the solid green line (swing low) to cover the full swing. For example, in the screenshots, the market retraces to the dotted line at 1.32980 after a liquidity grab below the swing low, triggering a buy limit order.
For a sell, set a sell limit order at the dotted red line, with a stop loss just above the solid red line.
Monitor Price Action: Once the price crosses a line, it is deleted, indicating the liquidity at that level has been taken. In the screenshots, after the buy limit is triggered, the market moves higher, confirming the setup. The caption notes, “The market returns and tags us in long with a buy limit,” highlighting this retracement strategy.
Additional Context: Use the indicator to identify liquidity levels that may be targeted later. For example, the screenshot notes, “If a new session is about to open I will wait for the grab liquidity to go long,” showing how the indicator can be used to anticipate future moves at session opens (e.g., London open at 1.32980).
Risk Management: Always set a stop loss below the swing low (for buys) or above the swing high (for sells) to protect against adverse moves. The 50% wick level helps tighten entries, improving the risk-reward ratio.
Practical Example
On the GBP/USD 15-minute chart, during the London session (02:00 UTC), the indicator identifies a buy setup with a solid green line at 1.32901 (swing low) and a dotted green line at 1.32980 (50% wick level). The market initially dips below the swing low, grabbing liquidity, then retraces to the dotted line, triggering a buy limit order. The price subsequently rises to 1.33404, yielding a profitable trade. The user notes, “The logic is in the last candle it provides new level to go long,” emphasizing the indicator’s ability to identify fresh levels after a liquidity sweep.
Customization Tips
Adjust the EMA period to suit your timeframe (e.g., a shorter period like 20 for faster signals on lower timeframes).
Modify the session hours to align with your broker’s timezone or specific market conditions.
Use the alert feature to get notified of new setups without constantly monitoring the chart.
Why It’s Useful for Traders
The "Enigma Sniper 369" stands out by combining session timing, momentum-based candle analysis, and liquidity hunting into a single tool. It provides clear, actionable levels for entries and stop losses, removes invalid signals dynamically, and aligns trades with high-probability market conditions. Whether you’re a scalper looking for quick moves during London open or a swing trader targeting session-based reversals, this indicator offers a structured, data-driven approach to trading.

Price Alert Indicator with TableIndicator Description: Price Alert Indicator with Table
The Custom Price Alert Indicator with Table is a TradingView script designed to help traders monitor and react to significant price levels during the Asian and London trading sessions. This indicator provides visual alerts and displays relevant session data in a user-friendly table format.
Key Features:
User-Defined Session Times:
Users can specify the start and end hours for both the Asian (default: 8 AM to 2 PM) and London (default: 2 PM to 8 PM) trading sessions in their local time zone.
This flexibility allows traders from different regions to customize the indicator according to their trading hours.
Real-Time Highs and Lows:
The indicator calculates and tracks the high and low prices for the Asian and London sessions in real-time.
It continuously updates these values as new price data comes in.
Touch Notification Logic:
Alerts are triggered when the price touches the session high or low points.
Notifications are designed to avoid repetition; if the London session touches the Asian high or low, subsequent touches are not alerted until the next trading day.
Interactive Table Display:
A table is presented in the bottom right corner of the chart, showing:
The Asian low and high prices
The London low and high prices
Whether each price level has been touched.
Touched levels are visually highlighted in green, making it easy for traders to identify relevant price actions.
Daily Reset of Notifications:
The notification statuses are reset at the end of the London session each day, preparing for the next day’s trading activity.
Use Cases:
Traders can utilize this indicator to stay informed about pivotal price levels during important trading sessions, aiding in decision-making and strategy development.
The clear visual representation of price levels and touch statuses helps traders quickly assess market conditions.
This indicator is particularly beneficial for day traders and those who focus on price movements around key high and low points during the trading day.

Intraday -RSKWhat You See:
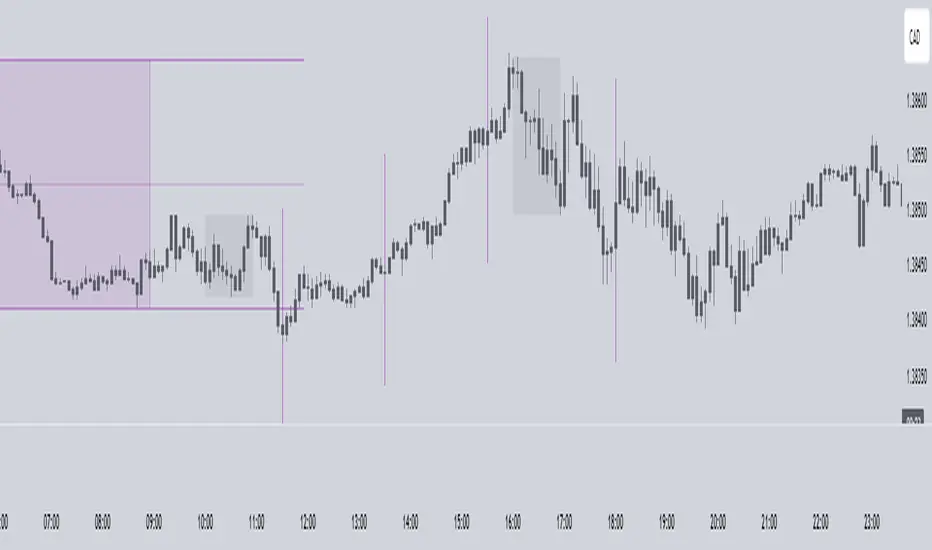
Session Boxes:
As you observe, the larger purple box represents the Asian Session, spanning from around 22:00 to 06:00 UTC. You notice how it captures the overnight market activity.
The smaller, greyish box marks the London Session, from about 08:00 to 12:00 UTC. You can see how the price action changes during this session.
The New York Session is also indicated, with vertical lines possibly marking the open and close, helping you track movements as the U.S. markets come into play.
High and Low Levels:
Horizontal lines are drawn at the high and low of each session. You can use these as potential support or resistance levels, aiding in your decision-making process.
Vertical Lines:
These lines likely correspond to specific key times, such as session opens or closes. You can quickly identify the transition between sessions, which is crucial for your timing.
Color Coding:
Each session is color-coded, making it easier for you to distinguish between them at a glance. The purple, grey, and additional lines offer a clear visual distinction.
How You Use It:
This indicator is your go-to for understanding how different market sessions affect price action. You’ll use it to:
Recognize important price levels within each session.
Identify potential entry and exit points based on session highs and lows.
Observe how the market transitions from one session to another, giving you insight into the best times to trade.
Customization:
You have the flexibility to adjust the settings. You can change session times to suit your trading hours, modify colors to match your chart theme, and even choose which sessions to display or hide based on your focus.
This tool is designed to enhance your analysis, providing you with a structured view of market sessions. With this indicator, you’re well-equipped to navigate the global markets with greater precision and confidence.
Open-source script
Macros ICT KillZones [TradingFinder] Times & Price Trading Setup🔵 Introduction
ICT Macros, developed by Michael Huddleston, also known as ICT (Inner Circle Trader), is a powerful trading tool designed to help traders identify the best trading opportunities during key time intervals like the London and New York trading sessions.
For traders aiming to capitalize on market volatility, liquidity shifts, and Fair Value Gaps (FVG), understanding and using these critical time zones can significantly improve trading outcomes.
In today’s highly competitive financial markets, identifying the moments when the market is seeking buy-side or sell-side liquidity, or filling price imbalances, is essential for maximizing profitability.
The ICT Macros indicator is built on the renowned ICT time and price theory, which enables traders to track and leverage key market dynamics such as breaks of highs and lows, imbalances, and liquidity hunts.
This indicator automatically detects crucial market times and optimizes strategies for traders by highlighting the specific moments when price movements are most likely to occur. A standout feature of ICT Macros is its automatic adjustment for Daylight Saving Time (DST), ensuring that traders remain synced with the correct session times.
This means you can rely on accurate market timing without the need for manual updates, allowing you to focus on capturing profitable trades during critical timeframes.
🔵 How to Use
The ICT Macros indicator helps you capitalize on trading opportunities during key market moments, particularly when the market is breaking highs or lows, filling Fair Value Gaps (FVG), or addressing imbalances. This indicator is particularly beneficial for traders who seek to identify liquidity, market volatility, and price imbalances.
🟣 Sessions
London Sessions
London Macro 1 :
UTC Time : 06:33 to 07:00
New York Time : 02:33 to 03:00
London Macro 2 :
UTC Time : 08:03 to 08:30
New York Time : 04:03 to 04:30
New York Sessions
New York Macro AM 1 :
UTC Time : 12:50 to 13:10
New York Time : 08:50 to 09:10
New York Macro AM 2 :
UTC Time : 13:50 to 14:10
New York Time : 09:50 to 10:10
New York Macro AM 3 :
UTC Time : 14:50 to 15:10
New York Time : 10:50 to 11:10
New York Lunch Macro :
UTC Time : 15:50 to 16:10
New York Time : 11:50 to 12:10
New York PM Macro :
UTC Time : 17:10 to 17:40
New York Time : 13:10 to 13:40
New York Last Hour Macro :
UTC Time : 19:15 to 19:45
New York Time : 15:15 to 15:45
These time intervals adjust automatically based on Daylight Saving Time (DST), helping traders to enter or exit trades during key market moments when price volatility is high.
Below are the main applications of this tool and how to incorporate it into your trading strategies :
🟣 Combining ICT Macros with Trading Strategies
The ICT Macros indicator can easily be used in conjunction with various trading strategies. Two well-known strategies that can be combined with this indicator include:
ICT 2022 Trading Model : This model is designed based on identifying market liquidity, structural price changes, and Fair Value Gaps (FVG). By using ICT Macros, you can identify the key time intervals when the market is seeking liquidity, filling imbalances, or breaking through important highs and lows, allowing you to enter or exit trades at the right moment.
Silver Bullet Strategy : This strategy, which is built around liquidity hunting and rapid price movements, can work more accurately with the help of ICT Macros. The indicator pinpoints precise liquidity times, helping traders take advantage of market shifts caused by filling Fair Value Gaps or correcting imbalances.
🟣 Capitalizing on Price Volatility During Key Times
Large market algorithms often seek liquidity or fill Fair Value Gaps (FVG) during the intervals marked by ICT Macros. These periods are when price volatility increases, and traders can use these moments to enter or exit trades.
For example, if sell-side liquidity is drained and the market fills an imbalance, the price might move toward buy-side liquidity. By identifying these moments, which may also involve breaking a previous high or low, you can leverage rapid market fluctuations to your advantage.
🟣 Identifying Liquidity and Price Imbalances
One of the important uses of ICT Macros is identifying points where the market is seeking liquidity and correcting imbalances. You can determine high or low liquidity levels in the market before each ICT Macro, as well as Fair Value Gaps (FVG) and price imbalances that need to be filled, using them to adjust your trading strategy. This capability allows you to manage trades based on liquidity shifts or imbalance corrections without needing a bias toward a specific direction.
🔵 Settings
The ICT Macros indicator offers various customization options, allowing users to tailor it to their specific needs. Below are the main settings:
Time Zone Mode : You can select one of the following options to define how time is displayed:
UTC : For traders who need to work with Universal Time.
Session Local Time : The local time corresponding to the London or New York markets.
Your Time Zone : You can specify your own time zone (e.g., "UTC-4:00").
Your Time Zone : If you choose "Your Time Zone," you can set your specific time zone. By default, this is set to UTC-4:00.
Show Range Time : This option allows you to display the time range of each session on the chart. If enabled, the exact start and end times of each interval are shown.
Show or Hide Time Ranges : Toggle on/off for visual clarity depending on user preference.
Custom Colors : Set distinct colors for each session, allowing users to personalize their chart based on their trading style.These settings allow you to adjust the key time intervals of each trading session to your preference and customize the time format according to your own needs.
🔵 Conclusion
The ICT Macros indicator is a powerful tool for traders, helping them to identify key time intervals where the market seeks liquidity or fills Fair Value Gaps (FVG), corrects imbalances, and breaks highs or lows. This tool is especially valuable for traders using liquidity-based strategies such as ICT 2022 or Silver Bullet.
One of the key features of this indicator is its support for Daylight Saving Time (DST), ensuring you are always in sync with the correct trading session timings without manual adjustments. This is particularly beneficial for traders operating across different time zones.
With ICT Macros, you can capitalize on crucial market opportunities during sensitive times, take advantage of imbalances, and enhance your trading strategies based on market volatility, liquidity shifts, and Fair Value Gaps.

NYSE, Euronext, and Shanghai Stock Exchange Hours IndicatorNYSE, Euronext, and Shanghai Stock Exchange Hours Indicator
This script is designed to enhance your trading experience by visually marking the opening and closing hours of major global stock exchanges: the New York Stock Exchange (NYSE), Euronext, and Shanghai Stock Exchange. By adding vertical lines and background fills during trading sessions, it helps traders quickly identify these critical periods, potentially informing better trading decisions.
Features of This Indicator:
NYSE, Euronext, and Shanghai Stock Exchange Hours: Displays vertical lines at market open and close times for these three exchanges. You can easily switch between showing or hiding the different exchanges to customize the indicator for your needs.
Background Fill: Highlights the trading hours of these exchanges using faint background colors, making it easy to spot when markets are in session. This feature is crucial for timing trades around overlapping trading hours and volume peaks.
Customizable Visuals: Adjust the color, line style (solid, dotted, dashed), and line width to match your preferences, making the indicator both functional and visually aligned with your chart's aesthetics.
How to Use the Indicator:
Add the Indicator to Your Chart: Add the script to your chart from the TradingView script library. Once added, the indicator will automatically plot vertical lines at the opening and closing times of the NYSE, Euronext, and Shanghai Stock Exchange.
Customize Display Settings: Choose which exchanges to display by enabling or disabling the NYSE, Euronext, or Shanghai sessions in the indicator settings. This allows you to focus only on the exchanges that are relevant to your trading strategy.
Adjust Visual Properties: Customize the appearance of the vertical lines and background fill through the settings. Modify the color of each exchange, adjust the line style (solid, dotted, dashed), and control the line thickness to suit your chart preferences. The background fill can also be customized to clearly highlight active trading sessions.
Identify Key Market Hours: Use the vertical lines and background fills to identify the market open and close times. This is particularly useful for understanding how price action changes during specific trading hours or for finding high liquidity periods when multiple markets are open simultaneously.
Adapt Trading Strategies: By knowing when major stock exchanges are open, you can adapt your trading strategy to take advantage of potential price movements, increased volatility, or volume. This can help you avoid low-liquidity times and capitalize on more active trading periods.
This indicator is especially valuable for traders focusing on cross-market dynamics or those interested in understanding how different sessions influence market liquidity and price action. With this tool, you can gain insight into market conditions and adapt your trading strategies accordingly. The clean visual separation of session times helps you maintain context, whether you're trading Forex, stocks, or cryptocurrencies.
Disclaimer: This script is intended for informational and educational purposes only. It does not constitute financial advice or a recommendation to buy or sell any financial instrument. Always conduct your own research and consult with a licensed financial advisor before making any trading decisions. Trading involves risk, and past performance is not indicative of future results.

Timing - Fx MGKWhat You See:
Session Boxes:
As you observe, the larger purple box represents the Asian Session, spanning from around 22:00 to 06:00 UTC. You notice how it captures the overnight market activity.
The smaller, greyish box marks the London Session, from about 08:00 to 12:00 UTC. You can see how the price action changes during this session.
The New York Session is also indicated, with vertical lines possibly marking the open and close, helping you track movements as the U.S. markets come into play.
High and Low Levels:
Horizontal lines are drawn at the high and low of each session. You can use these as potential support or resistance levels, aiding in your decision-making process.
Vertical Lines:
These lines likely correspond to specific key times, such as session opens or closes. You can quickly identify the transition between sessions, which is crucial for your timing.
Color Coding:
Each session is color-coded, making it easier for you to distinguish between them at a glance. The purple, grey, and additional lines offer a clear visual distinction.
How You Use It:
This indicator is your go-to for understanding how different market sessions affect price action. You’ll use it to:
Recognize important price levels within each session.
Identify potential entry and exit points based on session highs and lows.
Observe how the market transitions from one session to another, giving you insight into the best times to trade.
Customization:
You have the flexibility to adjust the settings. You can change session times to suit your trading hours, modify colors to match your chart theme, and even choose which sessions to display or hide based on your focus.
This tool is designed to enhance your analysis, providing you with a structured view of market sessions. With this indicator, you’re well-equipped to navigate the global markets with greater precision and confidence.
Vanitati's Market Scope=========================================================
How to Use the Indicator
=========================================================
Configuration: Begin by setting the session times to match your trading interests. Customize the colors and styles according to your preferences.
Observation: Watch for the high and low markers of each session to form the initial balance. Note how the price moves in relation to these levels.
Action: Pay special attention to God Candles and engulfing patterns, especially when they coincide with high volume. These may offer trading signals in line with your strategy.
Adjustment: Regularly review and adjust the settings (e.g., session times, lookback periods) based on market conditions and your trading performance.
=========================================================
Initial Balance (IB) Settings:
=========================================================
Purpose: Marks the high and low of a specific trading session to indicate the initial range of market movement.
Usage: Customize session times for New York (NY), London (LN), and Tokyo (TK) to see the initial balance of each. Colors for the high, low, and mid-point lines can be adjusted.
Practical Application: Traders can use these lines to gauge market volatility or breakouts outside of these initial ranges.
=========================================================
Session Settings and Session Highlight Boxes
=========================================================
Purpose: Highlights trading sessions with customizable background colors and border styles, allowing for a quick visual reference of market sessions.
Usage: Set the times for NY, London, and Tokyo sessions along with desired background colors to have these periods visually marked on the chart.
Practical Application: Helps in identifying the overlap between major market sessions and potential increases in trading volume and volatility.
=========================================================
God Candle Settings
=========================================================
Purpose: Identifies significantly large and voluminous candles, known as "God Candles", which could signal strong market movements.
Usage: Adjust the lookback period, line length, and volume criteria to define what constitutes a God Candle. These settings also allow for the display of diamonds on bars that meet certain criteria but are not classified as God Candles.
Practical Application: These candles can signal strong buying or selling pressure and might be used as potential entry or exit points based on the trader's strategy.
=========================================================
Additional Features
=========================================================
Session Time Filters: Allows for filtering signals based on the time of day, useful for focusing on specific market hours.
Engulfing Pattern Detection: The script includes logic to identify bullish and bearish engulfing patterns, adding another layer of analysis for potential trading opportunities.
Volume Analysis: Incorporates volume into the analysis of God Candles and engulfing patterns to identify significant market movements.
VIX Cheat SheetHello!
This indicator - "VIX Cheat Sheet" - performs several calculations for $VIX against the asset on your chart. However, using $VIX as a risk proxy or volatility metric often fails beyond large-cap U.S equities. To remedy this, the VixFix indicator is included in the script; you can select whether the script performs calculations for an asset against $VIX or against VixFix (i.e. Forex, Crypto)
Measured are: $VIX correlation to an asset's price fluctuations, the average close-to-close gain/loss subsequent a $VIX/VixFix close above the upper Bollinger Band, the average 5-session gain/loss following the same occurrence in addition to the average 10-session gain/loss, all close-to-close, 5 session, and 10-session gains/losses are stored as tooltips for labels on the chart. The current close-to-close percentage gain/loss for $VIX and VixFix are displayed on the chart.
Displayed in the example image is a box incorporating $VIX price data alongside an upper Bollinger Band and lower Bollinger Band. The data isn't cast to its own price scale but is helpful for quick interpretation of $VIX fluctuations. You can select to plot VixFix data in the box in the user inputs table.
Displayed in the second example image is a semi-transparent blue box encompassing all price moves that occurred when $VIX measured above $40 for at least ten consecutive sessions. The largest percentage close-to-close loss is displayed below the box.
Also illustrated is a red label that appears when $VIX or VixFix closes above the upper Bollinger Band. The indicator will calculate and display the performance of the asset for the subsequent 10 sessions, to which the red label will disappear and all data stored as a tooltip in the blue labels stating "VIX Closed Above Upper Band" or "VixFix Closed Above Upper Band".
To reduce chart clutter, a label and line combination marking all $VIX closes above the upper Bollinger Band was not included. Instead, bar color changes were added. When "$VIX" is selected in the user inputs table the indicator will mark all sessions in which $VIX closed above the upper band as blue, in addition to plotting $VIX price data in the dynamic black box. When "VixFix" is selected, the indicator will mark all sessions where VixFix closed above the upper band as purple; the VixFix indicator will be plotted in the black box.
Be sure to hover over labels to access tooltip information; try the indicator with bar replay!

Wave Trend w/ VWMA overlayThis is a trend-following strategy and indicator which combines the Wave Trend Strategy (Lazy Bear) by thomas.gigure with the cRSI + Waves Strategy with VWMA overlay by Dr_Roboto .
You may update the parameters of the Wave Trend oscillator or the VWMA indicator to match your own preferences. You may also adjust the Base Quantity used for determining trade size (as described below) to suit your account size and risk tolerance.
The strategy identifies potential signals based on the on the Wave Trend oscillator, originally ported to TradingView by LazyBear. When a signal is produced by the Wave Trend oscillator, trade size is determined by the VWMA.
When the VWMA is trending against the direction of the Wave Trend signal, Base Quantity x 1 is used
When the VWMA is trending neutral, Base Quantity x 2 is used
When the VWMA is trending with the direction of the Wave Trend signal, Base Quantity x 4 is used
The strategy includes the ability to limit trade signals to certain defined periods of time ("Sessions") during the trading day and, optionally, to close any open position at the end of either or both "Sessions." This may be enabled/disabled via the Limit Signals to Trading Sessions? option on the "Inputs" tab of the strategy's "Settings" window.
If you are trading on a daily chart (or longer) you must disable the Limit Signals to Trading Sessions? in order for the strategy to produce signals.

Waindrops [Makit0]█ OVERALL
Plot waindrops (custom volume profiles) on user defined periods, for each period you get high and low, it slices each period in half to get independent vwap, volume profile and the volume traded per price at each half.
It works on intraday charts only, up to 720m (12H). It can plot balanced or unbalanced waindrops, and volume profiles up to 24H sessions.
As example you can setup unbalanced periods to get independent volume profiles for the overnight and cash sessions on the futures market, or 24H periods to get the full session volume profile of EURUSD
The purpose of this indicator is twofold:
1 — from a Chartist point of view, to have an indicator which displays the volume in a more readable way
2 — from a Pine Coder point of view, to have an example of use for two very powerful tools on Pine Script:
• the recently updated drawing limit to 500 (from 50)
• the recently ability to use drawings arrays (lines and labels)
If you are new to Pine Script and you are learning how to code, I hope you read all the code and comments on this indicator, all is designed for you,
the variables and functions names, the sometimes too big explanations, the overall structure of the code, all is intended as an example on how to code
in Pine Script a specific indicator from a very good specification in form of white paper
If you wanna learn Pine Script form scratch just start HERE
In case you have any kind of problem with Pine Script please use some of the awesome resources at our disposal: USRMAN , REFMAN , AWESOMENESS , MAGIC
█ FEATURES
Waindrops are a different way of seeing the volume and price plotted in a chart, its a volume profile indicator where you can see the volume of each price level
plotted as a vertical histogram for each half of a custom period. By default the period is 60 so it plots an independent volume profile each 30m
You can think of each waindrop as an user defined candlestick or bar with four key values:
• high of the period
• low of the period
• left vwap (volume weighted average price of the first half period)
• right vwap (volume weighted average price of the second half period)
The waindrop can have 3 different colors (configurable by the user):
• GREEN: when the right vwap is higher than the left vwap (bullish sentiment )
• RED: when the right vwap is lower than the left vwap (bearish sentiment )
• BLUE: when the right vwap is equal than the left vwap ( neutral sentiment )
KEY FEATURES
• Help menu
• Custom periods
• Central bars
• Left/Right VWAPs
• Custom central bars and vwaps: color and pixels
• Highly configurable volume histogram: execution window, ticks, pixels, color, update frequency and fine tuning the neutral meaning
• Volume labels with custom size and color
• Tracking price dot to be able to see the current price when you hide your default candlesticks or bars
█ SETTINGS
Click here or set any impar period to see the HELP INFO : show the HELP INFO, if it is activated the indicator will not plot
PERIOD SIZE (max 2880 min) : waindrop size in minutes, default 60, max 2880 to allow the first half of a 48H period as a full session volume profile
BARS : show the central and vwap bars, default true
Central bars : show the central bars, default true
VWAP bars : show the left and right vwap bars, default true
Bars pixels : width of the bars in pixels, default 2
Bars color mode : bars color behavior
• BARS : gets the color from the 'Bars color' option on the settings panel
• HISTOGRAM : gets the color from the Bearish/Bullish/Neutral Histogram color options from the settings panel
Bars color : color for the central and vwap bars, default white
HISTOGRAM show the volume histogram, default true
Execution window (x24H) : last 24H periods where the volume funcionality will be plotted, default 5
Ticks per bar (max 50) : width in ticks of each histogram bar, default 2
Updates per period : number of times the histogram will update
• ONE : update at the last bar of the period
• TWO : update at the last bar of each half period
• FOUR : slice the period in 4 quarters and updates at the last bar of each of them
• EACH BAR : updates at the close of each bar
Pixels per bar : width in pixels of each histogram bar, default 4
Neutral Treshold (ticks) : delta in ticks between left and right vwaps to identify a waindrop as neutral, default 0
Bearish Histogram color : histogram color when right vwap is lower than left vwap, default red
Bullish Histogram color : histogram color when right vwap is higher than left vwap, default green
Neutral Histogram color : histogram color when the delta between right and left vwaps is equal or lower than the Neutral treshold, default blue
VOLUME LABELS : show volume labels
Volume labels color : color for the volume labels, default white
Volume Labels size : text size for the volume labels, choose between AUTO, TINY, SMALL, NORMAL or LARGE, default TINY
TRACK PRICE : show a yellow ball tracking the last price, default true
█ LIMITS
This indicator only works on intraday charts (minutes only) up to 12H (720m), the lower chart timeframe you can use is 1m
This indicator needs price, time and volume to work, it will not work on an index (there is no volume), the execution will not be allowed
The histogram (volume profile) can be plotted on 24H sessions as limit but you can plot several 24H sessions
█ ERRORS AND PERFORMANCE
Depending on the choosed settings, the script performance will be highly affected and it will experience errors
Two of the more common errors it can throw are:
• Calculation takes too long to execute
• Loop takes too long
The indicator performance is highly related to the underlying volatility (tick wise), the script takes each candlestick or bar and for each tick in it stores the price and volume, if the ticker in your chart has thousands and thousands of ticks per bar the indicator will throw an error for sure, it can not calculate in time such amount of ticks.
What all of that means? Simply put, this will throw error on the BITCOIN pair BTCUSD (high volatility with tick size 0.01) because it has too many ticks per bar, but lucky you it will work just fine on the futures contract BTC1! (tick size 5) because it has a lot less ticks per bar
There are some options you can fine tune to boost the script performance, the more demanding option in terms of resources consumption is Updates per period , by default is maxed out so lowering this setting will improve the performance in a high way.
If you wanna know more about how to improve the script performance, read the HELP INFO accessible from the settings panel
█ HOW-TO SETUP
The basic parameters to adjust are Period size , Ticks per bar and Pixels per bar
• Period size is the main setting, defines the waindrop size, to get a better looking histogram set bigger period and smaller chart timeframe
• Ticks per bar is the tricky one, adjust it differently for each underlying (ticker) volatility wise, for some you will need a low value, for others a high one.
To get a more accurate histogram set it as lower as you can (min value is 1)
• Pixels per bar allows you to adjust the width of each histogram bar, with it you can adjust the blank space between them or allow overlaping
You must play with these three parameters until you obtain the desired histogram: smoother, sharper, etc...
These are some of the different kind of charts you can setup thru the settings:
• Balanced Waindrops (default): charts with waindrops where the two halfs are of same size.
This is the default chart, just select a period (30m, 60m, 120m, 240m, pick your poison), adjust the histogram ticks and pixels and watch
• Unbalanced Waindrops: chart with waindrops where the two halfs are of different sizes.
Do you trade futures and want to plot a waindrop with the first half for the overnight session and the second half for the cash session? you got it;
just adjust the period to 1860 for any CME ticker (like ES1! for example) adjust the histogram ticks and pixels and watch
• Full Session Volume Profile: chart with waindrops where only the first half plots.
Do you use Volume profile to analize the market? Lucky you, now you can trick this one to plot it, just try a period of 780 on SPY, 2760 on ES1!, or 2880 on EURUSD
remember to adjust the histogram ticks and pixels for each underlying
• Only Bars: charts with only central and vwap bars plotted, simply deactivate the histogram and volume labels
• Only Histogram: charts with only the histogram plotted (volume profile charts), simply deactivate the bars and volume labels
• Only Volume: charts with only the raw volume numbers plotted, simply deactivate the bars and histogram
If you wanna know more about custom full session periods for different asset classes, read the HELP INFO accessible from the settings panel
EXAMPLES
Full Session Volume Profile on MES 5m chart:
Full Session Unbalanced Waindrop on MNQ 2m chart (left side Overnight session, right side Cash Session):
The following examples will have the exact same charts but on four different tickers representing a futures contract, a forex pair, an etf and a stock.
We are doing this to be able to see the different parameters we need for plotting the same kind of chart on different assets
The chart composition is as follows:
• Left side: Volume Labels chart (period 10)
• Upper Right side: Waindrops (period 60)
• Lower Right side: Full Session Volume Profile
The first example will specify the main parameters, the rest of the charts will have only the differences
MES :
• Left: Period size: 10, Bars: uncheck, Histogram: uncheck, Execution window: 1, Ticks per bar: 2, Updates per period: EACH BAR,
Pixels per bar: 4, Volume labels: check, Track price: check
• Upper Right: Period size: 60, Bars: check, Bars color mode: HISTOGRAM, Histogram: check, Execution window: 2, Ticks per bar: 2,
Updates per period: EACH BAR, Pixels per bar: 4, Volume labels: uncheck, Track price: check
• Lower Right: Period size: 2760, Bars: uncheck, Histogram: check, Execution window: 1, Ticks per bar: 1, Updates per period: EACH BAR,
Pixels per bar: 2, Volume labels: uncheck, Track price: check
EURUSD :
• Upper Right: Ticks per bar: 10
• Lower Right: Period size: 2880, Ticks per bar: 1, Pixels per bar: 1
SPY :
• Left: Ticks per bar: 3
• Upper Right: Ticks per bar: 5, Pixels per bar: 3
• Lower Right: Period size: 780, Ticks per bar: 2, Pixels per bar: 2
AAPL :
• Left: Ticks per bar: 2
• Upper Right: Ticks per bar: 6, Pixels per bar: 3
• Lower Right: Period size: 780, Ticks per bar: 1, Pixels per bar: 2
█ THANKS TO
PineCoders for all they do, all the tools and help they provide and their involvement in making a better community
scarf for the idea of coding a waindrops like indicator, I did not know something like that existed at all
All the Pine Coders, Pine Pros and Pine Wizards, people who share their work and knowledge for the sake of it and helping others, I'm very grateful indeed
I'm learning at each step of the way from you all, thanks for this awesome community;
Opensource and shared knowledge: this is the way! (said with canned voice from inside my helmet :D)
█ NOTE
This description was formatted following THIS guidelines
═════════════════════════════════════════════════════════════════════════
I sincerely hope you enjoy reading and using this work as much as I enjoyed developing it :D
GOOD LUCK AND HAPPY TRADING!

Bulkowski Flag Master ProEnglish: Entry & Exit GuideEntry Signal (BUY): A lime "BUY" triangle appears when the price breaks above a valid flag's resistance line. This is the official breakout signal based on Bulkowski's methodology. Target Price (Lime Dashed Line): Automatically calculated using the formula:$Target = Breakout Price + \frac{(Pattern High - Pattern Low)}{2}$.Bulkowski states this rule is accurate nearly 90% of the time for this pattern. Stop Loss (Red Dashed Line): Positioned at the bottom of the flag (consolidation low). Professional traders exit immediately if the price dips back below this level. KST Sessions:Red Highlight: US Opening 3H (KST 23:30 - 02:30) - Peak volatility for scalping.Indicator Filtering: For the highest probability, only take BUY signals when the price is above the Yellow EMA 200 and Aqua VWAP.

Session TimesDescription:
This indicator simply when enabled will draw dashed lines at each of the session openings. This is based on UTC+1 Time. There will be lines at 00:00 & 08:00 (Asian Session), lines at 08:00 & 13:00 (London Session) and finally lines at 13:00 & 00:00 (New York Session).
Potential Use:
There are many ways you could use this indicator to benefit your trading, but the best way I find is that it makes it clear where the previous highs and lows are of a session, which are potential areas you could trade off. Obviously, there are many other ways you can use this to help you.
How The Script Works:
The way the script works isn't too complicated as it is only a short script. Simply it firstly calculates what are the weekdays (Whenever it isn't Saturday or Sunday). Then from there simply finds the times which I mentioned above, and adds a vertical dashed line there.
Future Updates:
In the future I will mainly be looking to make the indicator more customisable. Firstly, I will look to make it so that the user can adjust the times that the lines are drawn at so it still works wherever you are in the world. I would also like to make it so the user can choose the colour of the lines. If you have any other additions you would like added to this, then feel free to message me.
Session breakThis indicator will show future lines before each session start. It will only show London session and US session start.
You can change the color of the lines and time as per day light savings.

Market Swiss KnifeSimple script, helpful to analyse the current conditions of the market and make your own decisions. It's not a signal indicator
* Shows an EMA to help you identify the trend
* Uses the ATR to plot two lines below (current low + ATR) and above (current high - ATR) the current candle. Useful to see whether the market is overextended or find possible targets
* Plots a vertical line showing NY, Tokyo and London session opens
* Includes a position size calculator to calculate your desired lot size (works in forex and gold)
Chart Champions - Part 2 - CCV IBs POCsThank you for sparing you time to read my indicator.
This indicator has been created as a suite of 3. This was to ensure that those with only the Free Trading View account could benefit (with their restriction to 3 indicators). Please ensure you install each indicator and read each indicator write up to fully understand what has tried to achieved.
Chart Champions – Part 1 –Lvls nPOC VWAPS
This indicator is broken down into:
• Levels
• VWAPS
• Naked Point of Control
Levels
It displays the levels to the right of the price Axis to enable the user to have a cleaner chart.
The below levels will automatically appear:
dOpen – pdHigh – pdLow – pdEQ – pwEQ
Optional Levels include:
mOpen – pmOpen – pdOpen – dbyOpen – wOpen – pwOpen
VWAPs
Optional VWAPs
Daily (including pdVWAP close) – Weekly – Monthly
Naked Points of Control (nPOC)
To view the nPOC move the chart back in time to pick up the nPOCs.
Chart Champions – Part 2 – CCV IBs POC
This indicator is broken down into:
• Chart Champions Value
• Initial Balance
• Points of Control
Chart Champions Value (CCV)
CCV is based on the 80% rule of the dOpen opening outside of the pdVAH/pdVAL. Please do you own research to fully understand how this trading strategy works (readily avaliable online).
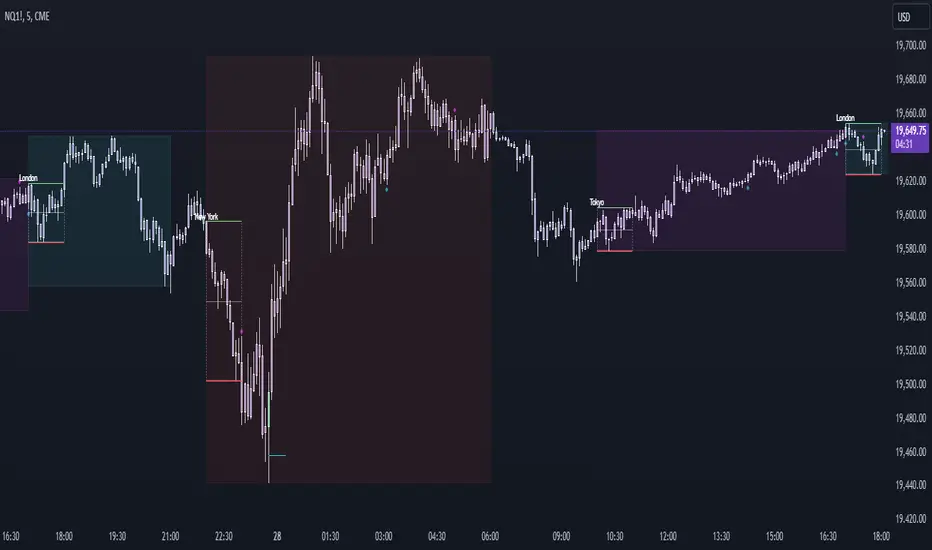
Initial Balance (IB)
IB is based on the first 60 minutes of the market opening. It captures the highest and lowest points within that 60 minutes. Please do you own research to fully understand how this trading strategy works (readily avaliable online).
Points of Control (POCs)
POC are the price levels where the most volume was traded.
Developing POC (dPOC) will constantly move with volume/price action through out the day.
Optional POCs
Previous Day POC (pdPOC) – Day Before Yesterday POC (dbyPOC)
Chart Champions – Part 3 – Sessions - Manual Input
This indicator is broken down into:
• Manual Inputs (daily, weekly, monthly)
• IGOR SessionsTtimes
• Pre + Market Openings
Manual Input
Daily x3
Weekly x 3
Monthly x 3
This allows the trader to put in specific levels.
IGOR Session Times
This is a user specific requirement to highlight cetain times during the day, displayed at the bottom of the chart in the colour strip.
Pre + Market Openings
This allows the user to see when pre market trading has started and with the live maket has started, displayed at the top of the chart in colours.
A huge thank you goes out to:
Stackoverflow users AnyDozer and Bjorn.
TV user ahancock for allow me use of this code.
Disclaimer the lower the timeframe the more information it processes.
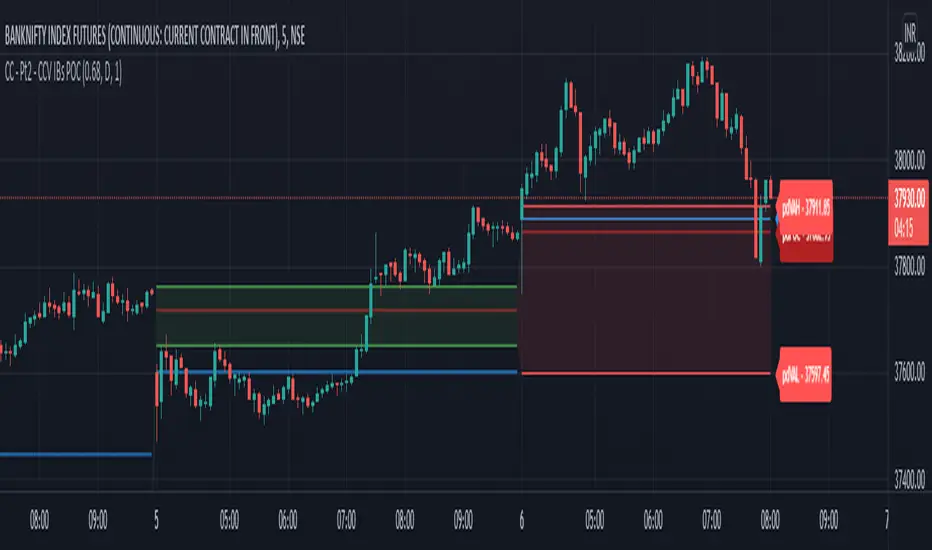
Chart Champions - Part 1 - nPOC - Levels - VWAPsThank you for sparing you time to read my indicator.
This indicator has been created as a suite of 3. This was to ensure that those with only the Free Trading View account could benefit (with their restriction to 3 indicators). Please ensure you install each indicator and read each indicator write up to fully understand what has tried to achieved.
Chart Champions – Part 1 –Lvls nPOC VWAPS
This indicator is broken down into:
• Levels
• VWAPS
• Naked Point of Control
Levels
It displays the levels to the right of the price Axis to enable the user to have a cleaner chart.
The below levels will automatically appear:
dOpen – pdHigh – pdLow – pdEQ – pwEQ
Optional Levels include:
mOpen – pmOpen – pdOpen – dbyOpen – wOpen – pwOpen
VWAPs
Optional VWAPs
Daily (including pdVWAP close) – Weekly – Monthly
Naked Points of Control (nPOC)
To view the nPOC move the chart back in time to pick up the nPOCs.
Chart Champions – Part 2 – CCV IBs POC
This indicator is broken down into:
• Chart Champions Value
• Initial Balance
• Points of Control
Chart Champions Value (CCV)
CCV is based on the 80% rule of the dOpen opening outside of the pdVAH/pdVAL. Please do you own research to fully understand how this trading strategy works (readily avaliable online).
Initial Balance (IB)
IB is based on the first 60 minutes of the market opening. It captures the highest and lowest points within that 60 minutes. Please do you own research to fully understand how this trading strategy works (readily avaliable online).
Points of Control (POCs)
POC are the price levels where the most volume was traded.
Developing POC (dPOC) will constantly move with volume/price action through out the day.
Optional POCs
Previous Day POC (pdPOC) – Day Before Yesterday POC (dbyPOC)
Chart Champions – Part 3 – Sessions - Manual Input
This indicator is broken down into:
• Manual Inputs (daily, weekly, monthly)
• IGOR SessionsTtimes
• Pre + Market Openings
Manual Input
Daily x3
Weekly x 3
Monthly x 3
This allows the trader to put in specific levels.
IGOR Session Times
This is a user specific requirement to highlight cetain times during the day, displayed at the bottom of the chart in the colour strip.
Pre + Market Openings
This allows the user to see when pre market trading has started and with the live maket has started, displayed at the top of the chart in colours.
A huge thank you goes out to:
Stackoverflow users AnyDozer and Bjorn.
TV user ahancock for allow me use of this code.
Disclaimer the lower the timeframe the more information it processes.

VDUB BB %B REVERSAL_v4.2 revised by JustUncleLThis is an revised Open Public version of Vdub Bollinger Band %B reversal indicator. This version includes optional Divergence Finder with selectable channel width, optional Market Session time highlighting and optional Binary Option expiry markers.

USDJPY Timing Composite (5-Component)Overview
A sophisticated multi-component oscillator designed specifically for intraday USDJPY trading. This indicator combines five key market drivers to provide high-probability timing signals by isolating true USD strength and JPY weakness from noise.
Components & Methodology
The indicator uses z-score normalization (default 20-period lookback) to make five distinct market signals comparable and combines them into a single composite reading:
Primary USD Strength Signals (60%):
-EURUSD (30%) - Inverted EUR/USD measures USD strength against the Euro
USDCHF (30%) - USD strength against the Swiss Franc
Yield Differential (25%):
US02Y (25%) - 2-Year Treasury yield captures Fed policy expectations and carry trade dynamics
JPY Weakness Confirmation (15%):
CHFJPY (7.5%) - CHF/JPY cross isolates JPY-specific weakness
EURJPY (7.5%) - EUR/JPY cross provides additional JPY context
Key Features
✅ Multi-Source Validation - Separates real USD strength from currency-specific noise
✅ JPY Context Filter - Confirms whether moves are driven by USD strength, JPY weakness, or both
✅ Alignment Indicator - Visual dots show when 4+ components agree (high-confidence setups)
✅ Mean-Reversion Zones - Overbought/oversold thresholds at ±1.5 standard deviations
✅ Clean Visualization - Candle-based display (no wicks) for easy interpretation
How to Use
Basic Signals:
Green candles = Bullish USDJPY pressure (USD strengthening / JPY weakening)
Red candles = Bearish USDJPY pressure (USD weakening / JPY strengthening)
Above +1.5 = Overbought zone → look for mean-reversion shorts
Below -1.5 = Oversold zone → look for mean-reversion longs
High-Confidence Setups (Alignment Dots):
Lime dot at top = 4+ components bullish → strong long bias
Magenta dot at bottom = 4+ components bearish → strong short bias
No dots = Mixed signals → reduce position size or wait for clarity
Divergence Trading:
USDJPY makes new high but composite doesn't confirm → potential reversal down
USDJPY makes new low but composite doesn't confirm → potential reversal up
Best Practices
Timeframes: 5-minute to 15-minute charts for intraday trading
Session Focus: London and New York overlap (peak liquidity)
Pair With: Support/resistance levels, volume profile, or session highs/lows
Risk Management: Use alignment indicator to size positions (larger size when dots present)
Weight Adjustments:
Fed data days (CPI, NFP, FOMC): Increase US02Y weight to 30-35%
Pure FX sessions: Increase -EURUSD/USDCHF weights to 35% each
Risk-off events: Monitor CHFJPY/EURJPY for safe-haven JPY flows
Technical Details
Calculation Method: Z-score normalization with configurable lookback period
Default Weights: -EURUSD 30% | USDCHF 30% | US02Y 25% | CHFJPY 7.5% | EURJPY 7.5%
Extreme Threshold: ±1.5 standard deviations (adjustable)
Alignment Trigger: 4 out of 5 components in agreement
Customizable Parameters:
Z-score lookback period (default: 20)
Individual component weights
Extreme threshold levels
Alignment indicator on/off
Advantages Over Simple Indicators
Unlike single-pair or DXY-based indicators, this composite:
Filters false signals - USD strength confirmed by two independent FX pairs
Identifies source of moves - Separates USD dynamics from JPY-specific flows
Reduces noise - JPY crosses prevent misreading EUR/CHF weakness as USD strength
Adapts to regimes - Adjustable weights for different market conditions
Suggested Complementary Analysis
Price action at key technical levels
Session opening ranges
Economic calendar (especially Fed events)
Correlation with US equity markets during risk-off periods
Intermarket analysis with JGB yields for JPY policy context
Disclaimer
This indicator is a technical analysis tool and does not guarantee profitable trades. Always use proper risk management, consider fundamental factors, and backtest any strategy before live trading. Past performance does not indicate future results.

Advanced Scalping Navigator free by S B PrasadAdvanced Scalping Navigator Lite • Features
by S B Prasad
Advanced Scalping Navigator Lite is a powerful multi-factor scalping and intraday indicator designed to generate high-probability BUY and SELL signals using trend, momentum, volatility, and smart-money concepts.
This FREE version retains the complete core signal engine while limiting certain premium visual and channel features.
🚀 Core Features (Included in Lite Version)
✅ High-Accuracy BUY & SELL Signals
Signals are generated only when multiple technical and structural conditions align, including:
ATR-based trend direction & strength
EMA trend bias
MACD momentum
RSI confirmation
VWAP institutional bias
Ribbon & Hull MA filters
Higher-timeframe (HTF) trend confirmation
Smart-money liquidity sweep validation
Supply & demand zone filtering
Session-based trading filter
✅ Smart-Money Liquidity Sweeps
Detects equal highs/lows and stop-hunt behavior to identify institutional accumulation or distribution before issuing signals.
✅ Supply & Demand Zones
Automatically plots demand and supply zones using pivot-based market structure to improve trade location quality.
✅ Higher-Timeframe (HTF) Confirmation
Filters trades in the direction of the dominant higher-timeframe trend for better probability alignment.
✅ Session Filter (Market Timing Control)
Limits signals to selected market sessions:
Indian Market
London Session
New York Session
✅ Multi-Factor Confirmation Engine
Combines EMA, MACD, RSI, VWAP, Ribbon, and HMA into a weighted factor score to avoid low-quality trades.
✅ Real-Time Dashboard Panel
On-chart dashboard displaying:
Trend direction
Trend strength
Factor alignment score
HTF bias
Zone context
Signal state
Session status
🔒 Features Limited or Disabled in Lite Version
The following premium visuals and channels are not available in the FREE version:
❌ ATR trendline (dynamic support / resistance)
❌ ATR trendline strength coloring
❌ Full ATR channel (upper / average / lower)
❌ Channel fills & premium visual layers
❌ Pivot ATR trend channel visuals
❌ Enhanced trend-zone background fills
🎯 Best For
Intraday traders
Scalpers
Index & stock traders
Futures and options traders
Traders who prefer clean charts with powerful signals
📣 Join Our Telegram (Updates & PRO Access)
👉 Telegram: t.me
💬 For updates, support & PRO version access, join our Telegram.
⚠️ Disclaimer
This indicator is for educational and informational purposes only.
It does not constitute financial advice.
Trading involves risk. Always use proper risk management.

Intraday Toolkit1. Visual Components of the Indicator
Understanding the visual cues is essential for quick decision-making during fast-moving intraday sessions:
Trend Background: The background color represents the Primary Cycle (80-period) bias. Green indicates a bullish trend (price is above the primary cycle), and red indicates a bearish trend (price is below the primary cycle).
The Three Cycles:
Yellow Line: Short Cycle (20) – Used for momentum triggers.
Orange Line: Mid Cycle (40) – Represents the baseline for volatility envelopes.
Red Line: Primary Cycle (80) – Defines the overall trend direction.
Volatility Envelopes: Two green lines plotted at a distance (1.5x ATR) from the Mid Cycle. These act as exhaustion zones where price is likely to revert or consolidate.
Rule 3 Signals (Purple Circles): These appear when a specific 3-candle momentum breakout occurs.
2. Trading Strategy for 5m & 15m
This toolkit is most effective when you use the 15m chart for trend confirmation and the 5m chart for precise entries.
Long (Buy) Setup
Enter a long position when the following alignment occurs:
Bullish Bias: The background must be Green (Price > Primary Cycle).
Cycle Low: A pivot low must have been detected (the indicator identifies a local bottom).
Momentum Trigger: Price must close above the Yellow Short Cycle line while the previous candle was below it.
Rule 3 Confirmation: If a purple circle appears simultaneously, it confirms strong buying momentum.
Short (Sell) Setup
Enter a short position when the following alignment occurs:
Bearish Bias: The background must be Red (Price < Primary Cycle).
Cycle High: A pivot high must have been detected (the indicator identifies a local top).
Momentum Trigger: Price must close below the Yellow Short Cycle line while the previous candle was above it.
Rule 3 Confirmation: A purple circle above the price confirms a bearish momentum shift.
3. Exit and Take-Profit Logic
The script includes "State Control" to manage your exits effectively:
Targeting the Envelopes: The primary profit target is the Outer Green Envelope. If price touches the upper envelope (for longs) or lower envelope (for shorts), the trend may be exhausted.
Momentum Exit: If price crosses back over the Yellow Short Cycle line in the opposite direction of your trade, the toolkit considers the move over and signals an exit.
4. Specific Tips for Day Trading
Avoid "Counter-Trend" Signals: Do not take Buy signals if the background is Red, or Sell signals if the background is Green. The logic is built to filter these out for better win rates.
The "Rule 3" Advantage: Use the purple circles as a "second chance" entry. If you missed the initial Buy/Sell signal, a Rule 3 circle indicates momentum is still strong in that direction.
Timeframe Synergy: * 15m: Best for seeing the "Big Picture" and avoiding noise.
5m: Best for finding entries with smaller stop-losses near the Yellow Short Cycle line.

Teemo Volume Delta & Market HUDTeemo Volume Delta & Market HUD
Description:
Teemo Volume Delta goes beyond simple volume indicators to provide expert-level analysis of Buy and Sell pressure within the market. It visualizes supply/demand imbalances inside candles and provides an immediate grasp of market control via a real-time HUD.
With the v1.2.0 update, we have removed unnecessary overlays (like EMAs) to focus on Pure Delta Analysis and a flexible Smart Accumulation System, making the tool lighter and more powerful.
🚀 Key Features
1. Dual Calculation Modes Offers two calculation methods tailored to your trading environment and goals:
Estimation: Rapidly estimates buy/sell volume based on candle shape (OHLC) and price range. It features fast loading times and works instantly on all assets.
Intraday: Analyzes lower timeframe data (e.g., 1-minute bars) to calculate the precise delta of the current timeframe. (Loading time may vary depending on TradingView data limits.)
2. Smart Accumulation System Supports strategic analysis beyond simple summation with two distinct modes:
Time Based: Resets the Cumulative Delta to 0 at specific intervals (e.g., every 4 hours, Daily). This is optimized for session-based analysis or day trading.
Infinite: Continuously accumulates data without resetting, ideal for analyzing long-term Divergences between price and delta.
3. Intuitive HUD (Heads-Up Display) Displays critical market data on the chart for instant decision-making:
Delta Panel: Shows real-time Buy/Sell volume and Net Delta for the current candle.
Market HUD: Provides a comprehensive view of Trend Strength (ADX), Momentum (RSI), and the Cumulative Buy/Sell status for the current period.
4. Teemo Design System (v1.2) Provides optimized color themes for visual comfort during long trading sessions:
Teemo Neon: High-contrast Mint/Purple theme optimized for dark backgrounds.
Classic Soft: A calming Soft Green/Red theme designed to reduce eye strain (Recommended for all backgrounds).
⚙️ Settings Guide
Calculation Mode: Choose between Estimation (Speed) or Intraday (Precision).
Accumulation Mode: Choose Time Based (Periodic Reset) or Infinite (Continuous).
Reset Period: Set the reset interval for Time Based mode (e.g., 1D = Daily Reset).
Color Preset: Select between Teemo Neon or Classic Soft themes.
💡 Trading Tips
Delta Divergence: If the price makes a higher high but the Cumulative Delta (HUD) makes a lower high, it signals weakening buying pressure and a potential reversal.
Candle Coloring: A solid Mint (or Green) candle body indicates a price rise accompanied by strong actual buying volume, offering higher reliability than standard candles.
HUD Confluence: Consider trend-following entries when the ADX is above 25 and the Delta is heavily skewed in one direction.
This indicator is for informational purposes only and does not constitute financial advice. The Estimation mode provides approximations based on algorithms, and the Intraday mode's accuracy depends on the quality of the lower timeframe data provided by the exchange.
Developed by Teemo Trading Systems
------------------------------------------------------------------------
Teemo Volume Delta & Market HUD
설명 본문:
Teemo Volume Delta는 단순한 거래량 지표를 넘어, 시장 내부의 매수(Buy)와 매도(Sell) 압력을 정밀하게 분석하는 전문가용 도구입니다. 캔들 내부의 수급 불균형을 시각화하고, 실시간 HUD를 통해 시장의 주도권이 누구에게 있는지 즉각적으로 파악할 수 있도록 돕습니다.
v1.2.0 업데이트를 통해 불필요한 보조지표(EMA)를 제거하고, 순수한 델타 분석과 유연한 누적(Accumulation) 시스템에 집중하여 더욱 가볍고 강력해졌습니다.
🚀 주요 기능 (Key Features)
1. 듀얼 계산 모드 (Dual Calculation Modes) 사용자의 환경과 목적에 맞춰 두 가지 계산 방식을 제공합니다.
Estimation (추정 모드): 캔들의 형태(OHLC)와 가격 변동폭을 기반으로 매수/매도 볼륨을 빠르게 추정합니다. 로딩 속도가 빠르며 모든 자산에 즉시 적용 가능합니다.
Intraday (정밀 분석 모드): 하위 타임프레임(예: 1분봉)의 데이터를 분석하여 상위 타임프레임의 델타를 정밀하게 계산합니다. (TradingView 데이터 제한에 따라 로딩 시간이 소요될 수 있습니다.)
2. 스마트 누적 시스템 (Smart Accumulation) 단순 누적을 넘어, 전략적 분석을 위한 두 가지 모드를 지원합니다.
Time Based: 지정한 주기(예: 4시간, 1일)마다 누적 델타를 **0으로 초기화(Reset)**합니다. 세션별 수급 분석이나 데이 트레이딩에 최적화되어 있습니다.
Infinite: 초기화 없이 데이터를 계속 누적하여, 장기적인 가격과 델타의 **다이버전스(Divergence)**를 분석하는 데 유용합니다.
3. 직관적인 HUD (Heads-Up Display) 차트 우측과 좌측에 핵심 정보를 요약하여 보여줍니다.
Delta Panel: 현재 캔들의 매수/매도 거래량과 순매수(Net Delta) 상태를 실시간으로 표시합니다.
Market HUD: ADX(추세 강도), RSI(모멘텀), 그리고 현재 구간의 누적 매수/매도 현황을 한눈에 볼 수 있습니다.
4. Teemo Design System (v1.2) 장시간 차트를 보는 트레이더를 위해 시인성이 뛰어난 컬러 테마를 제공합니다.
Teemo Neon: 어두운 배경에 최적화된 고대비 민트/퍼플 테마.
Classic Soft: 눈의 피로를 줄여주는 차분한 그린/레드 테마 (밝은/어두운 배경 모두 추천).
⚙️ 설정 가이드 (Settings)
Calculation Mode: Estimation(속도 중심) 또는 Intraday(정확도 중심) 중 선택.
Accumulation Mode: Time Based(주기별 리셋) 또는 Infinite(무한 누적) 선택.
Reset Period: Time Based 모드 사용 시 리셋할 주기 설정 (예: 1D = 매일 리셋).
Color Preset: Teemo Neon 또는 Classic Soft 테마 선택.
💡 활용 팁 (Trading Tips)
델타 다이버전스: 가격은 신고가를 갱신하지만 누적 델타(Cum Delta)는 낮아진다면, 매수세가 약화되고 있다는 강력한 반전 신호입니다.
캔들 컬러링: 캔들의 몸통 색상이 짙은 민트색(또는 그린)이라면 강력한 매수세가 동반된 상승을 의미하며, 신뢰도가 높습니다.
HUD 활용: ADX가 25 이상이면서 델타가 한쪽 방향으로 쏠릴 때 추세 매매를 고려하세요.
이 지표는 정보 제공의 목적으로만 사용되며, 재정적 조언이 아닙니다. Estimation 모드는 근사치를 제공하며, Intraday 모드는 거래소에서 제공하는 하위 데이터의 품질에 따라 정확도가 달라질 수 있습니다.
