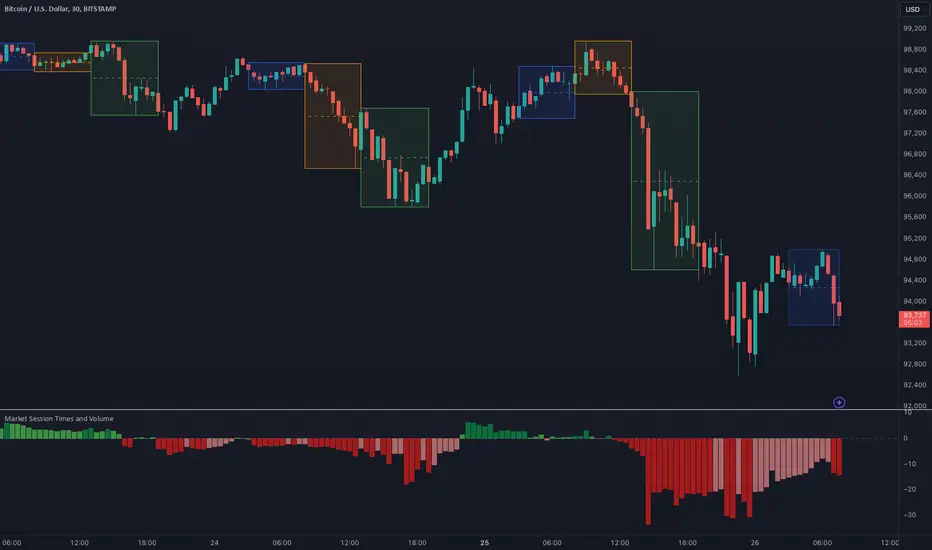
Market Session Times and Volume [Market Spotter]Market Session Times and Volume
Market Session Times
Inputs
The inputs tab consists of timezone adjustment which would be the chosen timezone for the plotting of the market sessions based on the market timings.
Further it contains settings for each box to show/hide and change box colour and timings for Asian, London and New York Sessions.
How it works
The indicator primarily works by marking the session highs and lows for the chosen time in the inputs, each of the sessions can be input a custom time value which would plot the box. It helps to identify the important price levels and the trading range for each individual session.
The midpoint of each session is marked with a dashed line. The indicator also marks a developing session while it being formed as well to identify potential secondary levels.
Usage
It can be used to trade session breakouts, false breaks and also divide the daily movement into parts and identify possible patterns while trading.
2. Volumes
Inputs
The volume part has 2 inputs - Smoothing and Normalisation. The smoothing period can simply be used to take in charge volumes of last X bars and normalisation can be used for calculating relative volumes based on last Y bars.
How it works
The indicator takes into account the buy and sell volumes of last X bars and then displays that as a relative smoothed volume which helps to identify longer term build or distribution of volume. It plots the positive volume from 0 to 100 and negative volume from 0 to -100 which has been normalised. The colors identify gradual increase or decrease in volumes
Usage
It can also be used to trade volume spikes well and can identify potential market shifts
Cari dalam skrip untuk "sessions"
Session VWAPS [QuantVue]The Session VWAPS indicator is a designed for traders to enhance their trading analysis by incorporating Volume Weighted Average Price (VWAP) anchored to custom-defined trading sessions.
This indicator automatically plots VWAPs at three critical points of a user defined session:
🔹session start
🔹session high
🔹session low
Additionally, it provides the option to display the VWAPs from previous sessions, offering a look at potential areas of support and resistance.
Anchored VWAP, or Anchored Volume-Weighted Average Price, is a technical analysis tool used to determine the average price of a stock weighted by volume, starting from a specific point in time chosen by the analyst.
Unlike traditional VWAP, which starts at the beginning of the trading session, the anchored VWAP allows traders to select any point on the chart, such as a significant event, price low, high, or a breakout, to begin the calculation.
VWAP incorporates price and volume in a weighted average and can be used to identify areas of support and resistance on the chart.
Indicator Features:
Custom Session Definition:
Users can define their own trading sessions by specifying start and end times, allowing for tailored analysis according to individual trading strategies or market hours.
Anchored VWAP at Three Key Points:
🔹Session Start VWAP: This VWAP is anchored at the start of the defined session.
🔹Session High VWAP: Anchored at the highest price point within the session.
🔹Session Low VWAP: Anchored at the lowest price point within the session.
Previous Session VWAPs:
The indicator can display VWAPs from the previous session, allowing traders to spot potential areas of support and resistance.
Give this indicator a BOOST and COMMENT your thoughts below!
We hope you enjoy.
Cheers!

Session ZonesHow is this different?
After reviewing a handful of session zone based indicators I decided to create this one not seeing exactly what I wanted, even this one only comes partially to my goals. This indicator will add session coloring on the chart in a vertical orientation, up to five sessions currently can be utilized. Timezones can be supplied that are compatible with Trading View so that session times specified in settings can be non-market timezone specific. In a future update I plan to add alerts for price reaching certain sessions, styling of the session zones may change overtime as PineScript feature enhancement allows.
How to use this?
Supply session ranges, color and disable any unneeded, the table at the top right will display whether or not price action is in or out of enabled sessions.
Which market is it meant for?
Any market.
What market conditions does this apply to?
Any condition.

Past and Upcoming Forex and NYSE Start/End Bar HighlighterThis script highlights the start and end of past sessions and also for upcoming sessions of the current day. Additionally, the start/end bars of the current day can be marked with a text label.
Time zone parameters are available for all time parameters, so that local exchange times can be configured, without the need for manual time zone or daylight saving time (DST) adjustments. Tradingview’s internal time calculations take care of the conversion.
For ease of use, the script comes preconfigured with the start/end times of the Forex and NYSE trading sessions. If you need more highlighted bars, just add the script multiple times and adapt the configuration as needed.

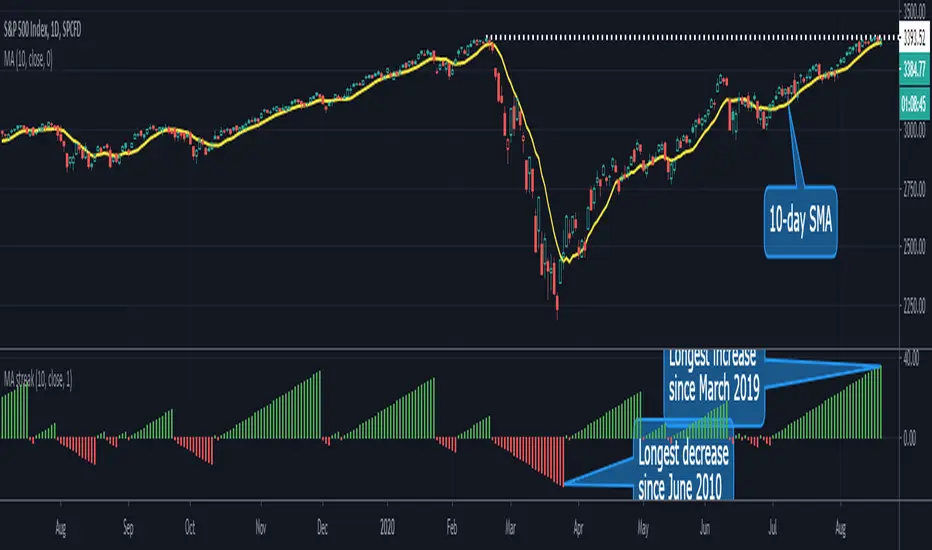
MA Streak Can Show When a Run Is Getting Long in the ToothMoving averages are one of the most common indicators in the world of technical analysis. And they’re often the ingredients of more complex indicators like MACD.
Today’s script shows how long prices have been moving in a given direction. Similar to our earlier Price Streak script, MA Streak counts the number of sessions that the average is rising or falling. It then plots the result in green (positive, rising) or red (negative, falling).
Because it uses a moving average instead of individual candles, this smooths out short-term noise to illustrate how long prices have been moving in a given direction.
Users can designate which price value (open, high, low, etc) to use under the Source input. They can also chose one of five moving average types. (See the code for a complete guide.)
Today’s chart shows that the S&P 500’s 10-day simple moving average (SMA) has been rising for 36 sessions. It’s the longest upside run since March 2019. Given the fact that the index is flirting with its pre-Covid highs, MA Streak may suggest the current rally is getting long in the tooth.
It's also noteworthy that the coronavirus correction in February and March saw the 10-day SMA drop for 24 straight sessions, which was its longest decline since June 2010.
GLOBAL 3H SCALPING (BTC FILTER)글로벌 멀티 세션 & BTC 필터 고강도 스캘핑 알고리즘 기술 보고서
파인 스크립트 v5의 기술적 패러다임과 알고리즘 트레이딩의 진화
금융 시장의 디지털화가 가속화됨에 따라 개인 트레이더와 기관 투자자 모두 정교한 알고리즘을 활용하여 시장의 비효율성을 포착하려는 시도를 지속하고 있다. 파인 스크립트 v5는 네임스페이스 기반 아키텍처를 도입하여 코드의 가독성과 실행 효율성을 극대화하였습니다. 본 보고서에서는 기존 코드의 구문 오류를 수정하고, 아시아·유럽·미국 세션 및 비트코인(BTC) 커플링 필터를 포함한 최적화된 스크립트를 제공합니다.
🚀 GLOBAL 3H SCALPING (BTC FILTER) 전체 코드
이 코드는 모든 세션(아시아/유럽/미국)의 3시간 골든 아워를 포착하며, 비트코인의 추세가 알트코인과 일치할 때만 신호를 생성하는 '커플링 필터'가 내장된 최종 버전입니다.
Pine Script
//@version=5
indicator("GLOBAL 3H SCALPING (BTC FILTERED)", overlay=true, max_lines_count=300, max_labels_count=100)
//────────────────────
// ⏰ 세션 정의 (한국 시간 KST 기준)
//────────────────────
string tz = "Asia/Seoul"
string asiaSess = "0900-1200"
string euSess = "1600-1900"
string usSess = "2300-0200"
f_getFocus(sessionStr) =>
inSess = not na(time(timeframe.period, sessionStr, tz))
start = inSess and not nz(inSess , false)
float tfInSec = timeframe.in_seconds()
int bars3H = math.max(1, math.round(10800 / tfInSec))
int barsSinceStart = ta.barssince(start)
bool focus = inSess and (not na(barsSinceStart) and barsSinceStart < bars3H)
focus
bool asiaFocus = f_getFocus(asiaSess)
bool euFocus = f_getFocus(euSess)
bool usFocus = f_getFocus(usSess)
bool totalFocus = asiaFocus or euFocus or usFocus
bgcolor(asiaFocus? color.new(color.green, 92) : na, title="Asia Focus")
bgcolor(euFocus? color.new(color.blue, 92) : na, title="EU Focus")
bgcolor(usFocus? color.new(color.red, 92) : na, title="US Focus")
//────────────────────
// 🟠 BTC 커플링 필터 (BTC Trend Filter)
//────────────────────
// 비트코인의 추세를 실시간으로 가져와 알트코인 매매의 안전장치로 활용함
float btcPrice = request.security("BINANCE:BTCUSDT", timeframe.period, close)
float btcEMA = request.security("BINANCE:BTCUSDT", timeframe.period, ta.ema(close, 200))
bool btcBullish = btcPrice > btcEMA
bool btcBearish = btcPrice < btcEMA
//────────────────────
// 📈 기술적 지표 (Altcoin 자체 지표)
//────────────────────
float ema200 = ta.ema(close, 200)
plot(ema200, title="EMA200", color=color.new(color.yellow, 0), linewidth=2)
float vwapVal = ta.vwap(hlc3)
plot(vwapVal, title="VWAP", color=color.new(color.aqua, 0), linewidth=2)
float volMA = ta.sma(volume, 20)
bool volOK = volume > volMA
bool longVWAP = low <= vwapVal and close > vwapVal
bool shortVWAP = high >= vwapVal and close < vwapVal
//────────────────────
// 🚀 진입 조건 (BTC 필터 통합)
//────────────────────
bool longCond = totalFocus and close > ema200 and close > vwapVal and longVWAP and volOK and btcBullish
bool shortCond = totalFocus and close < ema200 and close < vwapVal and shortVWAP and volOK and btcBearish
plotshape(longCond, title="LONG", location=location.belowbar, style=shape.triangleup, size=size.small, color=color.lime, text="LONG")
plotshape(shortCond, title="SHORT", location=location.abovebar, style=shape.triangledown, size=size.small, color=color.red, text="SHORT")
//────────────────────
// 🧠 실시간 통합 대시보드
//────────────────────
var label infoLabel = na
if barstate.islast
label.delete(infoLabel)
string sessName = asiaFocus? "ASIA" : euFocus? "EUROPE" : usFocus? "US" : "WAITING"
string labelText = "GLOBAL ALGO (BTC FILTERED) 🌍\n" +
"--------------------------\n" +
"Active Session: " + sessName + "\n" +
"BTC Trend: " + (btcBullish? "BULLISH 🟢" : "BEARISH 🔴") + "\n" +
"Alt Trend: " + (close > ema200? "BULLISH" : "BEARISH") + "\n" +
"Volume: " + (volOK? "STRONG" : "WEAK")
infoLabel := label.new(
x = bar_index,
y = high,
text = labelText,
style = label.style_label_left,
color = color.new(color.black, 20),
textcolor = color.white
)
📘 Comprehensive User Manual (EN/KR)
1. English: Multi-Session & BTC Filtered Scalping Guide
Core Philosophy
The "Golden Hours" strategy focuses on the first 3 hours of global market openings when volatility and liquidity are at their peak . By filtering altcoin signals with the Bitcoin (BTC) trend, we ensure high-probability entries aligned with the overall market momentum .
Session Schedule (Korea Standard Time - KST)
The indicator highlights three major trading windows :
Asia Focus (Green): 09:00 – 12:00 KST (Tokyo/Seoul opening).
Europe Focus (Blue): 16:00 – 19:00 KST (London opening).
US Focus (Red): 23:00 – 02:00 KST (New York opening).
Trading Rules
Long (Buy) Entry Conditions:
Zone: Price must be within one of the colored Focus Zones.
BTC Filter: BTC must be trading above its EMA 200 (Market Sentiment: Bullish) .
Alt Trend: Altcoin price must be above its own EMA 200.
Value: Price is above VWAP.
Reaction: Candle low touches or dips below VWAP, then closes above it (Pullback) .
Volume: Current volume is higher than the 20-period average.
Short (Sell) Entry Conditions:
Zone: Price must be within one of the colored Focus Zones.
BTC Filter: BTC must be trading below its EMA 200 (Market Sentiment: Bearish).
Alt Trend: Altcoin price must be below its EMA 200.
Value: Price is below VWAP.
Reaction: Candle high touches or goes above VWAP, then closes below it (Rejection).
Volume: Current volume is higher than the 20-period average.
Professional Risk Management
1% Rule: Never risk more than 1% of your total capital on a single trade .
Leverage: Use 1x–5x for beginners, and 5x–20x for advanced traders only with tight stop-losses .
Stop-Loss: Place stop-losses 0.1%–0.5% away from the entry point or at the most recent swing high/low .

Breakout/Breakdown Indicator (30 Min Range) by InvestYourAsset👉The indicator provided here is a technical analysis indicator for TradingView users that identifies potential breakout and breakdown opportunities on the initial 30-minute range in every trading session.
👉The indicator high and low of the initial 30-minute period and plotting them as horizontal lines on the chart. The high is marked in green line and the low is marked in red line.
📈The indicator then generates buy and sell signals based on whether the current close price crosses above or below the previous 30-minute high and low, respectively.
📢The indicator also has two inputs:
👉 sessionStartHour : The hour at which the trading session begins. The default value is 9, However users can change the time according to their own trading style.
👉 sessionStartMinute : The minute at which the trading session begins. The default value is 0.
These inputs can be used to adjust the indicator to the specific trading session that you are interested in.
✅How to use the Indicator:
👉To use the 30 Minute Breakout/Breakdown Indicator, simply add it to your chart and configure the inputs to your liking. Once the indicator is added to the chart, it will plot the 30-minute high and low as horizontal lines, as well as generate buy and sell signals based on the current close price.
✅Here is a step-by-step guide:
📈Open TradingView and select the chart that you want to add the indicator to.
📈Click on the "Indicators" tab and search for "30 Minute Breakout/Breakdown Indicator by InvestYourAsset".
📈Click on the indicator to add it to your chart.
📈Configure the inputs to your liking. The default values are typically fine, but you can experiment with different values to see what works best for you.
📈Once you are satisfied with the settings, click on the "Apply" button.
📈The indicator will now be displayed on your chart. You will see two horizontal lines representing the previous 30-minute high and low, as well as triangles representing buy and sell signals.
✅How to interpret the signals:
📈Buy signal : A buy signal is generated when the current close price crosses above the previous 30-minute high. This suggests that the price is likely to continue moving higher in the short term.
📈Sell signal : A sell signal is generated when the current close price crosses below the previous 30-minute low. This suggests that the price is likely to continue moving lower in the short term.
👉Traders should remember that the present indicator is just one tool that can be used to identify potential trading opportunities. It is important to use other technical analysis tools and risk management techniques to confirm your trading signals before entering any trades.
✅Things to consider while using the indicator:
📈Look for buy signals in an uptrend and sell signals in a downtrend. This will increase the likelihood of your trades being successful.
📈Place your stop losses below the previous 30-minute low for buy signals and above the previous 30-minute high for sell signals. This will help to limit your losses if the trade goes against you.
📈Consider taking profits at key resistance and support levels. This will help you to lock in your profits and avoid giving them back to the market.
Follow us for timely updates regarding indicators that we may publish in future and give it a like if you appreciate the indicator.

Combined Indicators V2 by DeepsageCombined Indicators V2 – Overview
Combined Indicators V2 is an advanced trading indicator that builds on Combined Indicators V1 by Deepsage and Weighted Market Screener by Deepsage. It is designed to provide precise signals for long and short trades on very low timeframes (1m–5m) while aligning entries with the overall market trend.
Background: The Original Indicators
1. Combined Indicators V1 (Deepsage)
Combines three specialized indicators to generate signals:
Breakout Indicator: Uses Bollinger Bands and volume behavior to identify potential breakout trades.
Price Action Indicator: Detects price interaction with support and resistance levels, incorporating trend, volatility, and candlestick patterns.
Range Trading Indicator: Calculates RSI or Stochastic oscillator and plots signals against predefined upper and lower bands for range-bound markets.
2. Weighted Market Screener (Deepsage)
Monitors the overall market trend using 12 different indicators, each weighted based on its relevance.
Produces a market trend rating: strong buy, buy, neutral, sell, or strong sell.
What’s New in V2
1. Trend-Aligned Entries
In V2, the entry indicators (Breakout, Price Action, Range Trading) only generate signals when the Market Screener confirms the trend (can be turned off).
Long trades: Screener must rate the market as Buy or Strong Buy.
Short trades: Screener must rate the market as Sell or Strong Sell.
2. Session-Based Optimization
V2 supports the NY, London, and Tokyo trading sessions.
Each indicator can be restricted to the session where it performs best (can be turned off):
NY: Breakout Indicator
London: Price Action Indicator
Asia: Range Trading Indicator
3. Additional Enhancements
Market Screener locked to 15-minute timeframe, giving a clear view of the overall trend while entries are still executed on 1-minute charts.
Fully customizable alerts for buy and sell signals.
Settings allow traders to toggle indicators and alerts on/off for maximum flexibility.
Summary
Combined Indicators V2 is a powerful, session-aware, trend-aligned trading tool that merges multiple strategies into one cohesive system. It allows traders to:
Trade low timeframes with precise entries
Only take trades that align with the overall market trend
Optimize strategies based on trading sessions
Customize alerts and indicator settings for personal preferences

EEQI [Environment Quality Index] PyraTime The Problem: Why Good Strategies Fail
The number one reason traders lose capital is not a lack of strategy—it is forced execution in poor environments.
Most indicators (RSI, MACD, Stochastic) are continuously active, generating signals even when the market is dead, choppy, or chaotic. A breakout strategy that prints money in a trend will destroy your account in a consolidation range. A mean-reversion system that works in chop will fail during a parabolic expansion.
The Solution: PyraTime EEQI The Execution Environment Quality Index (EEQI) is a "Gatekeeper" layer for your trading. It does not tell you what to buy or sell; it tells you if you should be trading at all.
By aggregating Volatility, Price Structure, and Efficiency into a single composite score, the EEQI answers the most critical question in discretionary trading: "Is the market efficient enough to deploy capital right now?"
How It Works: The 3 Core Engines
The EEQI calculates a raw "Environment Score" (from -2 to +4) by analyzing three distinct dimensions of price action.
1. Volatility Engine (Usability)
The Logic: Measures the "Alive-ness" of the market using ATR Percentiles.
The Filter: It detects "Dead Zones" (where price is too flat to hit targets) and "Chaos Zones" (where volatility is too dangerous).
Smart Feature (Parabolic Override): If price moves significantly (>2x ATR) in a single candle, the engine recognizes this as "High Momentum" rather than chaos, unlocking Green signals during breakouts.
2. Structure Engine (Bar Quality)
The Logic: Analyzes the relationship between candle bodies, wicks, and overlap.
The Filter: It penalizes "Barbed Wire" price action—candles with long wicks and high overlap—which indicate indecision and algo-chop.
The Goal: We want to trade during "Clean Flow," where candle bodies are large and overlap is low.
3. Efficiency Engine (Directional Flow)
The Logic: Compares Net Displacement (start-to-finish distance) vs. Total Distance Traveled.
The Filter: Identifies "Whipsaw" conditions where price moves a lot but goes nowhere.
Smart Feature (Velocity Lock): If price travels a massive distance quickly, the efficiency requirement is relaxed to catch explosive moves that might otherwise look "messy."
The "Smart Gatekeepers"
Even if the Core Engines look good, the EEQI applies three final safety checks before granting a PRIME status.
Regime Persistence (Stability Check): The market must hold a high score for a set number of bars (default: 1) before the signal turns Green. This prevents "fake-outs" where a single anomaly candle tricks you into entering a bad trend.
Volume Validation (Liquidity Check): Price movement without participation is a trap. The EEQI checks Relative Volume (RVOL). If volume is below average (e.g., lunch hour, holidays, or late-night sessions), the score is capped at "Fair" or "Low Vol," preventing execution in thin liquidity.
Macro Context (HTF Filter): You cannot trade against the higher timeframe. The EEQI checks the trend and volatility of the Higher Timeframe (default: Weekly). If the macro view is compressed or dead, the local signal is vetoed.
How to Read the HUD
The Dashboard (Bottom Right) gives you an instant read on the market state.
🟢 PRIME (+4): Execution Optimal. The market is trending, efficient, and backed by volume. This is the "Green Light" for your strategy.
🔵 FAIR (+1 to +3): Tradeable. Conditions are decent, but one factor (e.g., volume or structure) is imperfect. Exercise caution.
⚪ NEUTRAL (0): Indecision. The market is transitioning. Stand aside.
🟡 BUILDING: Wait. The market is good, but hasn't proven itself yet (Persistence Check).
🟠 POOR / LOW VOL: Chop. Price is messy or lacking participation.
🔴 AVOID (-2): Danger Zone. The market is either dead flat or violently chaotic. Do not trade.
Settings & Customization
The indicator comes with calibrated presets for different asset classes:
Crypto: Tolerates higher volatility and requires stronger efficiency confirmation.
Forex: Stricter dead-zone filters to handle ranging sessions.
Indices: Balanced settings for standard equity hours.
Disclaimer
This tool is designed for environment analysis only. It does not provide buy or sell signals, entry prices, or stop-losses. It is intended to be used as a filter to improve the performance of your own discretionary strategies.

Daily SMA (Historical Plotting with RTH/ETH, (5))Daily SMA (RTH/ETH Dynamic Session Handling) — Midnight + RTH Open Locks
This indicator plots projected daily Simple Moving Averages (SMAs) on intraday charts by anchoring calculations to a Regular Trading Hours (RTH) daily SMA reference, while visualizing how the daily SMA evolves intraday during Extended Trading Hours (ETH) and RTH sessions.
When daily SMAs are evaluated strictly at the daily timeframe, they do not form a continuous intraday history and may appear flat on historical intraday bars until realtime bars begin updating. This script visualizes the daily SMA’s intraday progression while keeping the underlying daily SMA reference unchanged.
Purpose
Standard daily SMAs plotted on intraday charts are evaluated at the daily timeframe and therefore do not form a continuous intraday history. When charts are refreshed or reloaded, these values may appear flat until realtime data resumes.
This script addresses that visualization limitation by projecting the daily SMA across historical and realtime intraday bars, while keeping the daily SMA reference intact.
How it works
• Daily SMA seed values are sourced exclusively from an RTH-only daily timeframe series.
• At ETH midnight, the SMA seed is locked using completed daily closes from the RTH daily series.
• At the RTH open, the seed is re-locked using the completed RTH daily window.
• After each seed event, the SMA is projected intraday using the active chart bar’s price.
Price semantics
• Historical bars use fully closed candle data only.
• The realtime bar uses the last traded price until the candle closes.
• Once a bar closes, its value is final and does not repaint.
Higher-timeframe data usage
• request.security() is used intentionally to access daily SMA data.
• lookahead=barmerge.lookahead_on is used only to reference the developing daily timeframe value during the active session for projection purposes.
• No future bars are accessed and no historical values are retroactively altered.
Data integrity
• SMA seed values are derived solely from the daily timeframe and do not depend on intraday bar history.
• SMA values are computed forward from the locked seed and do not revise prior bars.
• If insufficient daily history exists for a symbol, values safely return na.
Scope and limitations
• Intended for chart timeframes up to and including daily.
• Designed for instruments with defined RTH sessions (such as equities and equity-based products).
• This script does not replace or modify the underlying daily SMA reference; it visualizes an intraday projection anchored to the RTH daily SMA.
Other notes
• Pine Script version: v6
• No future data access
• No historical repainting; only the active realtime bar updates until close

Time Pressure ZonesTime Pressure Zones is a multi‑purpose candle and volume‑based indicator that highlights moments when markets are likely being driven by urgency rather than routine trading flow.
**Overview**
Detects sequences of strong, one‑directional candles accompanied by volume spikes to approximate institutional time pressure (forced buying or selling).
Paints subtle background zones, labels, and a net‑pressure histogram so you can see when aggressive flow is building or exhausting across any instrument and timeframe.
**Core Logic**
A bar is tagged “strong” when its real body occupies at least a user‑defined percentage of the full high‑low range, filtering out indecision candles and long‑wick noise.
Volume is compared to a rolling 20‑bar average; only bars with volume above a configurable multiple are treated as meaningful participation, which makes the tool adapt to different symbols and sessions.
The script counts consecutive bars that are both strong and high‑volume in the same direction, then flags a time‑pressure event once a set fraction of the lookback has been reached (e.g., 2 out of 3, 3 out of 5).
**Visual Outputs**
Background shading: green or red bands mark active bullish or bearish time‑pressure windows without overpowering other tools on the chart.
On‑chart labels: “↑ Time Pressure” and “↓ Time Pressure” appear only on the first bar of a new pressure sequence, ideal for alerts and discretionary entries.
Net Pressure histogram: plots the difference between bullish and bearish streak counts, giving a quick at‑a‑glance sense of which side currently dominates.
**Sessions and News**
Uses UTC‑based logic to highlight London and New York open and close windows, where institutional flows and intraday “deadline” behavior tend to cluster.
Includes a manual News Window toggle so you can mark high‑impact event periods (CPI, FOMC, NFP, etc.), aligning tape‑based urgency with scheduled catalysts.
**How To Use**
Look to join moves when fresh time‑pressure labels print into session opens, breakouts, or key levels, rather than fading them.
Tune the three main inputs per market and timeframe: lower thresholds for choppy or thin markets, and higher body/volume requirements for very liquid symbols like major indices or BTC pairs.

Dynamic ATR-based Renko Overlay - Non repaintingDaily ATR-Based Renko Overlay
Overview
This Pine Script v5 indicator creates a dynamic Renko overlay on your time-based charts (optimized for 1-minute timeframes), using the previous period's ATR from a user-specified higher timeframe (default: 1-hour) to determine brick sizes. Unlike traditional Renko charts, this is an overlay that draws Renko bricks directly on top of your existing candles, allowing you to combine the noise-filtering power of Renko with the full features of time-based charts.
It's designed for traders who want Renko's trend-clarity benefits without switching chart types, especially useful for intraday trading in volatile markets like forex, stocks, or crypto.
Key Features
- Adaptive Brick Sizing: Brick size is calculated as a percentage (default 40%) of the previous period's ATR (Average True Range, default length 14) from the selected higher timeframe (default: 1-hour). This makes bricks volatility-adjusted—larger in high-vol periods to reduce noise, smaller in low-vol for more detail.
- Periodic Recalculation: Resets brick size at the start of each new period based on the user-specified reset timeframe (default: daily), using the prior period's ATR from the chosen timeframe. This ensures relevance without unwanted disruptions.
- Traditional Renko Logic: Uses 1-box reversal (a full brick against the trend to reverse). Bricks form based on closing prices, ignoring time and minor fluctuations.
- Visual Style: Stepped lines with green (up) and red (down) fills for a box-like appearance. Semi-transparent for easy overlay on candles.
- Customizable Inputs:
- ATR Length: Adjust the ATR period (default: 14).
- Percentage of ATR: Fine-tune brick sensitivity (default: 0.4 or 40%; range 0-1).
- ATR Timeframe: Specify the timeframe for ATR calculation (default: "60" for 1-hour; enter as a string like "240" for 4-hour, "D" for daily, etc.).
- Reset Timeframe: Specify the period for recalculating the brick size (default: "D" for daily; enter as a string like "W" for weekly, "M" for monthly, etc.).
How It Works
1. Fetches ATR from the user-specified timeframe via `request.security` for higher-timeframe volatility data.
2. On new periods based on the reset timeframe (or first load), sets brick size to `percent * ATR_HTF`.
3. Tracks Renko "close" and "previous close" to calculate bricks:
- Upward moves add green bricks in multiples of the size.
- Downward moves add red bricks.
- Reversals require a full brick against the direction.
4. Plots and fills create the overlay, updating on each 1-min bar close.
Add it to a 1-minute chart for best results—bricks will adapt periodically while you retain full candle visibility.
Why This Indicator is Helpful
TradingView's native Renko charts are powerful but come with limitations that can frustrate serious traders:
- No Bar Replay: Native Renko doesn't support TradingView's bar replay feature, making it hard to simulate historical trading sessions.
- Inaccurate/Repainting Strategy Testing: Strategies on native Renko can repaint or lack precision due to the non-time-based nature, leading to unreliable backtests.
- Limited Data History: Fast Renko timeframes (e.g., small bricks) often load very little historical data, restricting long-term analysis.
This overlay solves these by building Renko on a time-based chart:
- Full Bar Replay Support: Replay sessions as usual on your 1-min chart—the Renko follows along.
- Accurate, Non-Repainting Testing: Test strategies on the underlying time chart without repainting issues, as Renko is derived from closes.
- Unlimited Data Depth: Access TradingView's full historical data for 1-min charts (up to years of bars), not limited by Renko's data constraints.
- Hybrid Analysis: Overlay Renko on candles to spot trends while using volume, indicators (e.g., RSI, MAs), or drawing tools that don't work well on native Renko.
It's a game-changer for trend-following, breakout strategies, or filtering noise in short-term trades. No more switching charts—get the best of both worlds!
Usage Tips
- Best on 1-min charts for intraday precision, but experiment with others.
- Tune the percentage lower (e.g., 0.3) for more bricks/sensitivity, higher (e.g., 0.5) for fewer/false-signal reduction.
- Adjust the ATR timeframe to match your strategy—e.g., "240" for longer-term volatility or "15" for shorter.
- Customize the reset timeframe for different recalculation frequencies—e.g., "W" for weekly resets to capture broader market shifts, or "240" for every 4 hours.
- Combine with alerts: right now I am experimenting with 90 period EMA and the Renko brick pullbacks to find some EDGE
If you find this useful, give it a thumbs up or share your tweaks in the comments. Feedback welcome—happy trading! 🚀

Ultimate Lines Statistical Backtest @MaxMaseratiUltimate lines (MAs/MACD/VWAP,DWA etc..) Statistical Backtest
This is a comprehensive statistical backtesting tool that allows traders to objectively measure the performance of 27+ different trading lines across multiple timeframes and sessions. Instead of guessing which moving averages, VWAPs, or volume levels actually work for your trading style, this indicator provides hard data showing exactly how price behaves around each line at specific times of day.
The indicator solves a critical problem: most lines create whipsaws in choppy markets, but knowing which lines have the highest continuation rates vs reversal rates at specific session times helps you avoid false signals and focus on setups with proven statistical edges.
🎯 LINES YOU CAN TEST
MMM Core Lines:
Mid MA: Trend velocity tracker using simple moving average
MMPD Line: Premium/Discount change-of-direction indicator
Fair Value Golden Ratio: 0.618 equilibrium level between premium and discount zones
Volume-Based Lines:
VWAP Daily/Weekly: Volume-weighted average price (daily and weekly sessions)
Volume POC Multi-TF: Multi-timeframe Point of Control (highest volume price level)
Volume POC Weekly: Weekly momentum pivot based on volume distribution
Range Midpoints:
Range Midpoint 50: 50-period high/low midpoint
Range Midpoint 14 TF1/TF2: Configurable timeframe range midpoints with smoothing options
Moving Averages (10 MA Types):
MACD Fast (12) / Signal (26): Standard MACD moving averages
Fast MA 20 / Mid MA 50 / Slow MA 200: Classic trend-following averages
Available MA Types: SMA, EMA, WMA, HMA, DEMA, TEMA, LSMA, KAMA, ALMA, VWMA
Volatility Indicators:
MVM Upper/Lower Bands: Momentum-based volatility bands with adaptive option
HVC Bullish/Bearish: High Volume Candle support/resistance levels
Ultimate Suite Advanced Lines:
DWAP (Delta Weighted Average Price): Directional volume-weighted price with upper/lower bands
HVN (High Volume Node): High-frequency trading node detection
Hybrid Line: Volume-weighted momentum composite
Trend Filter: Two-pole smoothing filter for trend clarity
STL Lines:
iBuSTL / iBeSTL: Internal Bullish/Bearish Structural Trend Liquidity levels
⚙️ HOW TO TEST
Select Lines: Check the boxes for lines you want to analyze (Mid MA, VWAP Daily, Volume POC, etc.)
Choose Times: Enable tracking for specific session times (default: 8:30 AM, 9:30 AM, 10:00 AM, Daily Close - EST)
Set Lookback: Choose how many days of historical data to analyze (default: 60 days)
Enable Pattern Analysis: Turn on "Enable Pattern Analysis" in settings
Wait for Data: The indicator needs 20 bars after each signal time to complete analysis
Review Statistics: Check the statistics table for detailed breakdowns
📈 STATISTICS EXPLAINED
For Each Tracked Time, You'll See:
🟢 Above Selected Lines (X samples):
Continued↑: Price stayed above the lines = bullish continuation
Reversed↓: Price broke below the lines = reversal/rejection
→Kept Going↓: After reversing down, price continued lower (bars 11-20)
→Stalled: After reversing down, price came back up (consolidation)
Neutral: Price didn't make a clear move either way
🔴 Below Selected Lines (X samples):
Continued↓: Price stayed below the lines = bearish continuation
Reversed↑: Price broke above the lines = reversal/support bounce
→Kept Going↑: After reversing up, price continued higher (bars 11-20)
→Stalled: After reversing up, price came back down (consolidation)
Neutral: No clear directional move
⭐ Star Ratings: Show which outcome happens most frequently (best probability)
🔬 HYBRID DETECTION SYSTEM (ADVANCED)
When enabled, the indicator uses a multi-signal composite scoring system that goes beyond simple percentage movements:
Signal A - % Movement Direction (40% weight):
Measures the strength and direction of price movement. Strong directional moves (>0.8%) score higher, while opposite-direction moves score negatively.
Signal B - Inside Candles (30% weight):
Detects true consolidation by counting how many candles close within a defined range. High inside-candle counts indicate choppy, stalled price action rather than clean continuation.
Signal C - Successive Closes (30% weight):
Tracks momentum persistence by counting consecutive closes in the expected direction. Long streaks (6+ bars) indicate strong follow-through, while breaks in the sequence suggest weakness.
Composite Score Classification:
⭐⭐⭐ Strong (75-100 points): All three signals align - high-confidence pattern
⭐⭐ Moderate (50-75 points): Two signals agree - reliable pattern
⭐ Weak (25-50 points): Mixed signals - lower confidence
⚠️ Strong Stalled (0-25 points): Signals show consolidation/reversal
This provides nuanced pattern detection that identifies not just IF a pattern succeeded, but HOW STRONGLY it performed.
💡 INTERPRETING RESULTS
Good Lines Show:
High continuation % when price is above/below (>60% is strong)
Clean "Kept Going" patterns after reversals (>50% indicates reliable rejection)
Low stalled % (less whipsaw/consolidation)
Consistent patterns across multiple times (validates the line's reliability)
Poor Lines Show:
50/50 continuation vs reversal (coin flip = no edge)
High stalled % (lots of whipsaw/false signals)
Inconsistent patterns across different times (unreliable)
Example Interpretation:
9:30 AM - VWAP Daily (120 samples)
🟢 Above:
Continued↑ 75 (62.5%) ⭐ BEST
Reversed↓ 30 (25.0%)
Meaning: When price is above VWAP Daily at 9:30 AM, it continues higher 62.5% of the time - this is a statistically strong bullish signal for that session time.
🎯 PRACTICAL VALUE
Solves the Whipsaw Problem:
Most moving averages and lines work beautifully in trending markets but create endless false signals in choppy, range-bound conditions. By analyzing specific session times and continuation vs reversal patterns, you can:
Identify high-probability setups: Focus on lines that show >60% continuation at your preferred trading times
Avoid weak signals: Skip lines with high stall rates or 50/50 outcomes
Time your entries better: Know which session times produce the cleanest patterns
Combine complementary lines: Stack multiple high-scoring lines for confluence
Adapt to market conditions: Switch to different lines when market structure changes
Real-World Application:
Instead of blindly trading VWAP crosses or MA bounces, you'll have objective data showing: "At 9:30 AM on ES, when price is above Mid MA + VWAP Daily + Volume POC, it continues higher 68% of the time with strong momentum (⭐⭐⭐)." This transforms discretionary guesswork into data-driven decision making.
⚙️ LINE DEFINITIONS
Moving Averages: Smooth price data over X periods to identify trend direction and dynamic support/resistance.
VWAP: Anchored average price weighted by volume - institutional traders' benchmark for "fair value."
Volume POC (Point of Control): Price level with the most traded volume - represents maximum market acceptance.
Fair Value Golden Ratio: Fibonacci 0.618 level between recent premium (high) and discount (low) - equilibrium zone.
DWAP (Delta Weighted): Price average weighted by buying vs selling volume delta - shows directional money flow.
Range Midpoints: Geometric center of recent high/low range - mean reversion pivot.
Volatility Bands: Envelope around momentum lines showing normal price deviation ranges.
HVN (High Volume Node): Automated detection of high-volume price clusters - institutional accumulation/distribution zones.
Note: This indicator is purely for statistical analysis and backtesting. It does not generate trade signals or provide entry/exit recommendations. Use the statistics to inform your own trading decisions and strategy development.

15M Swing Sweep Lines + SMT (ES vs NQ)15M Swing Sweep Lines (NY Killzones)Visualize liquidity sweeps of 15-minute swing highs/lows exclusively during high-impact London & New York killzones.This ICT-inspired indicator detects when price sweeps (wicks beyond) the most recent confirmed 15-minute swing high or low — classic signs of liquidity raids or stop hunts — but only if the sweep happens during key "killzone" sessions where institutional activity is typically highest.Key Features15M Swing Detection: Uses confirmed pivot highs/lows (length 2) on the 15-minute timeframe for reliable structure points.
Killzone Filters (New York time):London Killzone: 3:00 AM – 4:59 AM
New York Killzone: 9:30 AM – 10:59 AM (captures the high-volatility NY open overlap)
Sweep Visualization:Bearish Sweep (high > last 15M swing high): Thick red horizontal line from the swing point to the sweep bar.
Bullish Sweep (low < last 15M swing low): Thick green horizontal line from the swing point to the sweep bar.
Lines use xloc.bar_time for precise placement and extend only to the bar where the sweep occurs.
No duplicates: Prevents multiple lines for the same swing sweep.
Non-repainting logic with lookahead_off for clean, trustworthy signals.
Why Killzones MatterMany ICT/SMC traders focus on these windows because they often feature aggressive manipulation, equal highs/lows sweeps, and the setup for strong directional moves. This tool helps you instantly spot when buy-side or sell-side liquidity has been raided on the 15M structure during these prime times.Ideal ForConfirming potential reversals or inducements after liquidity grabs.
Adding confluence to entries during London or NY sessions.
Futures traders (ES, NQ, etc.) looking for clean visual cues of smart money engineering.
Lightweight, overlay-friendly, and focused — add it to your chart for clearer insight into 15M liquidity sweeps when it matters most. Perfect companion for killzone-based strategies!

Impulsive Trend Detector [dtAlgo]This advanced Pine Script indicator identifies and tracks impulsive price movements based on Break of Structure (BOS) and Change of Character (CHoCH) concepts from Smart Money trading methodology.
The indicator automatically detects pivot highs and lows, then monitors when price breaks these key levels to signal potential impulsive moves. BOS indicates continuation in the current trend direction, while CHoCH signals potential trend reversals. Each detected move is measured from the break point to the next opposing pivot, providing accurate percentage calculations that match TradingView's measuring tool.
Impulsive moves are categorized into four levels based on magnitude (Level 1: 5-10%, Level 2: 10-15%, Level 3: 15-20%, Level 4: 20%+), with color-coded visual labels and connecting lines displayed directly on the chart.
Comprehensive Session Analysis:
Track moves across 11 distinct trading sessions in Eastern Time: Pre-London/NY, London/NY overlap, NY (with Power Hour and End subdivisions), Sydney, Asia, Sake Time, Asia/London overlap, London, Weekend, and No Session periods.
Three Dynamic Tables provide:
Real-time statistics (bullish/bearish, BOS/CHoCH, levels)
Session breakdown with move counts and average percentages
Event log showing last 10 moves with date, day, session, direction, type, level, percentage, duration, and bar count
Perfect for Smart Money traders seeking data-driven insights into market structure behavior across global trading sessions.

Minervini Template + Powerplay detectorMinervini Template + PowerPlay Detector
This indicator implements a rule-based Minervini trend template to identify stocks in strong, institutionally supported uptrends, combined with a Power Play momentum detector for explosive leadership moves.
Minervini Model (MM) Rules
The MM dashboard turns GREEN only when all of the following rules are met:
Close ≥ 150-day SMA
Close ≥ 200-day SMA
50-day SMA > 150-day SMA
50-day SMA > 200-day SMA
150-day SMA ≥ 200-day SMA
200-day SMA is rising (current value higher than ~1 month ago)
Close is at least 30% above the 52-week low
Close is within 25% of the 52-week high
Close is not more than 8% below the 50-day SMA
These rules ensure:
Proper long-term trend structure
Institutional accumulation alignment
Strength near highs, not extended weakness
When MM is red, hovering over it shows exactly which rules failed, allowing quick diagnosis of why a stock does not qualify.
POWERPLAY Logic
POWERPLAY highlights rare, high-velocity leadership moves:
Triggers when a stock gains 90% or more within any rolling window of up to 60 trading sessions
Remains active as long as the condition continues to hold
Hover tooltip displays:
Start date of the move
Current date
Total percentage gain so far
This captures fast institutional momentum, even if the move occurs in fewer than 60 sessions.
Dashboard Features
Moveable to any corner of the chart
Adjustable size
Adjustable opacity
Designed for trend followers and momentum traders seeking true market leaders, not short-term noise or late-stage breakouts.

Unmitigated MTF High Low Pro - Cave Diving Bookmap Heatmap Plot
Unmitigated MTF High Low Pro - Cave Diving Bookmap Heatmap Plot
---
## 📖 Table of Contents
1. (#what-this-indicator-does)
2. (#core-concepts)
3. (#visual-components)
4. (#the-cave-diving-framework)
5. (#how-to-use-it-for-trading)
6. (#settings--customization)
7. (#best-practices)
8. (#common-scenarios)
---
## What This Indicator Does
The **Unmitigated MTF High Low v2.0** tracks unmitigated (untouch) high and low levels across multiple timeframes, helping you identify key support and resistance zones that the market hasn't revisited yet. Think of it as a sophisticated memory system for price action - it remembers where price has been, and more importantly, where it *hasn't been back to*.
### Why "Unmitigated" Matters
In futures trading, especially on instruments like NQ and ES, the market has a tendency to revisit levels where liquidity was left behind. An "unmitigated" level is one that hasn't been touched since it was formed. These levels often act as magnets for price, and understanding their age and proximity gives you a significant edge in:
- **Entry timing** - Waiting for price to approach tested levels
- **Exit planning** - Taking profits before ancient resistance/support
- **Risk management** - Avoiding entries when approaching multiple old levels
- **Liquidity mapping** - Visualizing where orders likely cluster
---
## Core Concepts
### 1. **Sessions & Age**
The indicator uses **New York trading sessions** (6:00 PM to 5:59 PM NY time) as the primary time measurement. This aligns with how futures markets naturally segment their activity.
**Age Categories:**
- 🟢 **New (0-1 sessions)** - Fresh levels, recently formed
- 🟡 **Medium (2-3 sessions)** - Tested by time, gaining significance
- 🔴 **Old (4-6 sessions)** - Highly significant, survived multiple days
- 🟣 **Ancient (7+ sessions)** - Extreme significance, major support/resistance
The longer a level remains unmitigated, the more significant it becomes. Think of it like compound interest - time adds weight to these zones.
### 2. **Multi-Timeframe Tracking**
You can set the indicator to track high/low levels from any timeframe (default is 15 minutes). This means you're watching for unmitigated 15-minute highs and lows while trading on, say, a 1-minute or 5-minute chart.
**Why this matters:**
- Higher timeframe levels have more weight
- You can see multiple timeframe structure simultaneously
- Helps you avoid fighting larger timeframe momentum
### 3. **Mitigation**
A level becomes "mitigated" (deactivated) when price touches it:
- **High levels** are mitigated when price reaches or exceeds them
- **Low levels** are mitigated when price reaches or goes below them
Once mitigated, the level disappears from view. The indicator only shows you the untouch levels that still matter.
---
## Visual Components
### 📊 The Dashboard Table
Located in the corner of your chart (configurable), the table shows:
```
┌─────────┬───────────┬────────┬─────┬───────┐
│ Level │ Price │ Points │ Age │ % │
├─────────┼───────────┼────────┼─────┼───────┤
│ ↑↑↑↑↑ │ 21,450.25 │ +45.50 │ 8 │ +0.21%│ ← 5th High (Ancient)
│ ↑↑↑↑ │ 21,430.00 │ +25.25 │ 5 │ +0.12%│ ← 4th High (Old)
│ ↑↑↑ │ 21,420.50 │ +15.75 │ 3 │ +0.07%│ ← 3rd High (Medium)
│ ↑↑ │ 21,412.00 │ +7.25 │ 1 │ +0.03%│ ← 2nd High (New)
│ ↑ ⚠️ │ 21,408.25 │ +3.50 │ 0 │ +0.02%│ ← 1st High (Proximity Alert!)
├─────────┼───────────┼────────┼─────┼───────┤
│ 15 mins │ 🟢 │ Δ 8.75 │ 2U │ │ ← Status Row
├─────────┼───────────┼────────┼─────┼───────┤
│ ↓ ⚠️ │ 21,399.50 │ -5.25 │ 0 │ -0.02%│ ← 1st Low (Proximity Alert!)
│ ↓↓ │ 21,395.00 │ -9.75 │ 2 │ -0.05%│ ← 2nd Low (Medium)
│ ↓↓↓ │ 21,385.25 │ -19.50 │ 4 │ -0.09%│ ← 3rd Low (Old)
│ ↓↓↓↓ │ 21,370.00 │ -34.75 │ 6 │ -0.16%│ ← 4th Low (Old)
│ ↓↓↓↓↓ │ 21,350.75 │ -54.00 │ 9 │ -0.25%│ ← 5th Low (Ancient)
├─────────┼───────────┼────────┼─────┼───────┤
│ 📊 15↑ / 12↓ │ ← Statistics (optional)
└─────────┴───────────┴────────┴─────┴───────┘
```
**Reading the Table:**
- **Level Column**: Number of arrows indicates position (1-5), color shows age
- **Price**: The actual price level
- **Points**: Distance from current price (+ for highs, - for lows)
- **Age**: Number of full sessions since creation
- **%**: Percentage distance from current price
- **⚠️**: Proximity alert - price is within threshold distance
- **Status Row**: Shows timeframe, direction (🟢 bullish/🔴 bearish), tunnel width (Δ), and Strat pattern
### 📈 Visual Elements on Chart
**1. Level Lines**
- Horizontal lines showing each unmitigated level
- **Color-coded by age**: Bright colors = new, darker = older, deep purple/teal = ancient
- **Line style**: Customizable (solid, dashed, dotted)
- Automatically turn **yellow** when price gets close (proximity alert)
**2. Price Labels**
- Show the exact price and age: "21,450.25 (8d)"
- Fixed at small size for clean readability
- Positioned with configurable offset from current bar
**3. Bands (Optional)**
- Shaded zones between pairs of unmitigated levels
- Default: Between 1st and 2nd levels (the "tunnel")
- Can switch to 1st-3rd, 2nd-3rd, or disable entirely
- **Upper band** (pink/maroon) - Between unmitigated highs
- **Lower band** (blue/teal) - Between unmitigated lows
- These represent the "no man's land" or consolidation zones
---
## The Cave Diving Framework
This indicator is designed around the **Cave Diving Trading Framework** - a psychological and technical approach that maps cave diving safety protocols to futures trading risk management.
### 🤿 The Core Metaphor
**Cave diving has clear danger zones based on depth and overhead environment. Your trading should too.**
#### Shallow Water (New Levels, 0-1 Sessions)
- **Light**: Bright colors (bright red highs, bright green lows)
- **Psychology**: Fresh territory, recently tested
- **Trading**: Be aware but not overly concerned
- **Cave Diving Parallel**: You can see the surface, easy exit
#### Penetration Depth (Medium Levels, 2-3 Sessions)
- **Light**: Medium intensity colors
- **Psychology**: Building significance, market memory forming
- **Trading**: Start respecting these levels for entries/exits
- **Cave Diving Parallel**: Deeper in, need to track your line back
#### Deep Dive Zone (Old Levels, 4-6 Sessions)
- **Light**: Dark colors (deep maroon, dark blue)
- **Psychology**: Highly tested support/resistance
- **Trading**: Major decision points, plan accordingly
- **Cave Diving Parallel**: Significant overhead, careful navigation required
#### Overhead Environment (Ancient Levels, 7+ Sessions)
- **Light**: Very dark, purple/deep teal
- **Psychology**: Extreme caution required, major liquidity zones
- **Trading**: These are your "turn back" signals - don't fight ancient levels
- **Cave Diving Parallel**: Maximum danger, no room for error
### 🎯 The Proximity Alert System
Just like a cave diver's depth gauge that warns at critical thresholds, the proximity alerts (⚠️) tell you when you're entering a danger zone. When price gets within your configured threshold (default 5 points), the indicator:
- Highlights the level in **yellow** on the chart
- Shows **⚠️** in the table
- Signals: "You're entering a high-significance zone - adjust your position accordingly"
This prevents the trading equivalent of going deeper into a cave without checking your air supply.
---
## How to Use It for Trading
### 🎯 Entry Strategies
**1. The "Bounce Setup" (Mean Reversion)**
- Wait for price to approach an old or ancient unmitigated level
- Look for confluence: multiple levels nearby, bands narrowing
- Enter when price shows rejection (reversal candle patterns)
- **Example**: Price drops to a 6-session-old low, shows bullish engulfing → Long entry
**2. The "Break and Retest" (Trend Following)**
- Wait for price to break through an unmitigated level (mitigates it)
- Enter on the retest of the newly broken level
- **Example**: Price breaks above 4-session-old high → Wait for pullback to that level → Long entry
**3. The "Tunnel Trade" (Range Trading)**
- When bands are active, trade the range between 1st-2nd levels
- Short near upper band resistance, long near lower band support
- Exit at opposite side or when bands break
### 🚨 Risk Management Rules
**The Ancient Level Rule**
> Never fight ancient levels (7+ sessions). If you're long and approaching an ancient high, take profits. If you're short and approaching an ancient low, take profits.
These levels have survived a full trading week without being touched - there's likely significant liquidity and institutional interest there.
**The Proximity Exit Rule**
> When you see ⚠️ proximity alerts on multiple levels above/below your position, tighten stops or scale out.
This is your "overhead environment" warning. You're in dangerous territory.
**The New Level Filter**
> Be cautious taking positions based solely on new levels (0-1 sessions). Wait for them to age or combine with other confluence.
Fresh levels haven't been tested by time. They're like unconfirmed support/resistance.
### 📊 Reading Market Structure
**Bullish Structure (🟢 in status row)**
- Unmitigated lows are aging and holding
- Price respecting the lower band
- Old lows below acting as strong support
- **Bias**: Look for long entries at lower levels
**Bearish Structure (🔴 in status row)**
- Unmitigated highs are aging and holding
- Price respecting the upper band
- Old highs above acting as strong resistance
- **Bias**: Look for short entries at higher levels
**The Tunnel Compression**
- When the Δ (delta) in the status row is small, levels are tight
- This often precedes a breakout
- **Trading**: Wait for breakout direction, then trade the break
### 🔄 Strat Integration
The indicator shows Strat patterns in the status row:
- **1** - Inside bar (consolidation)
- **2U** - Broke high only (bullish)
- **2D** - Broke low only (bearish)
- **3** - Broke both (wide range, volatility)
Use these with the unmitigated levels:
- **2U near old high** → Potential resistance, watch for rejection
- **2D near old low** → Potential support, watch for bounce
- **3 pattern** → High volatility, respect wider stops
---
## Settings & Customization
### 📅 Session & Timeframe Settings
**HL Interval** (Default: 15 minutes)
- The timeframe for high/low calculation
- **Lower (1m, 5m)**: More levels, more noise, good for scalping
- **Higher (30m, 1H, 4H)**: Fewer levels, stronger significance, good for swing trading
- **Recommendation for NQ/ES**: 15m or 30m for day trading, 1H for swing trading
**Session Age Threshold** (Default: 2)
- How many sessions before a level is considered "old"
- Lower = more levels classified as old
- Higher = stricter definition of significance
### 📊 Level Display Options
**Show Level Lines**
- Toggle: Display horizontal lines for each level
- **Turn off** if you prefer a cleaner chart and only want the table
**Show Level Labels**
- Toggle: Display price labels on the chart
- **Turn off** for minimal visual clutter
**Label Offset**
- Distance (in bars) from current price bar to place labels
- Increase if labels overlap with price action
**Level Line Width & Style**
- Customize visual appearance
- **Thin solid**: Minimal distraction
- **Thick dashed**: High visibility
### 🎨 Age-Based Color Coding
Customize colors for each age category (high and low separately):
- **New (0-1 sessions)**: Default bright red/green
- **Medium (2-3 sessions)**: Default medium intensity
- **Old (4+ sessions)**: Default dark red/blue
- **Ancient (7+ sessions)**: Default deep purple/teal
**Color Strategy Tips:**
- Keep ancient levels in highly contrasting colors
- Use opacity (transparency) if you want subtler lines
- Match your chart's color scheme for aesthetic coherence
### 🎯 Band Settings
**Band Mode**
- **1st-2nd** (Default): The primary "tunnel" between most recent levels
- **1st-3rd**: Wider band, more room for price action
- **2nd-3rd**: Band between less immediate levels
- **Disabled**: No bands, lines only
**Band Colors & Borders**
- Customize fill color and border separately
- **Tip**: Keep bands very transparent (90-95% transparency) to avoid obscuring price action
### ⚠️ Proximity Alert Settings
**Enable Proximity Alerts**
- Toggle: Turn on/off the warning system
- When enabled, levels within threshold distance show ⚠️ and turn yellow
**Alert Threshold** (Default: 5.0 points)
- Distance in points to trigger the alert
- **For NQ**: 5-10 points is reasonable
- **For ES**: 2-5 points is reasonable
- **For MES/MNQ**: Scale down proportionally
**Alert Highlight Color**
- The color lines/labels turn when proximity is triggered
- Default: Yellow (high visibility)
### 📋 Table Settings
**Show Table**
- Toggle: Display the dashboard table
**Table Location**
- Top Left, Top Right, Bottom Left, Bottom Right
- Choose based on your chart layout and other indicators
**Text Size**
- Tiny, Small, Normal, Large
- **Recommendation**: Normal for 1080p monitors, Small for 4K
**Show % Distance**
- Toggle: Add percentage distance column to table
- Useful for comparing relative distances across different price ranges
**Show Statistics Row**
- Toggle: Show total count of unmitigated highs/lows
- Format: "📊 15↑ / 12↓" (15 unmitigated highs, 12 unmitigated lows)
- Useful for gauging overall market structure
### ⚡ Performance Settings
**Enable Level Cleanup**
- Automatically remove very old levels to maintain performance
- **Keep on** unless you want unlimited history
**Max Lookback Levels** (Default: 10,000)
- Maximum number of levels to track
- 10,000 ≈ 6+ months of 15-minute bars
- **Increase** if you want more history
- **Decrease** if experiencing performance issues
**Max Boxes Per Band** (Default: 245)
- TradingView limit is 500 total boxes
- With 2 bands, 245 each = 490 total (safe maximum)
---
## Best Practices
### 🎯 Position Management
**1. Scaling In Near Old Levels**
```
Price approaching 5-session-old low:
- First position: 30% size at proximity alert (⚠️)
- Second position: 40% size at exact level
- Third position: 30% size if it shows strong rejection
```
**2. Scaling Out Near Ancient Levels**
```
Holding long position, approaching 8-session-old high:
- Exit 50% at proximity alert (⚠️)
- Exit 30% at exact level
- Trail stop on remaining 20%
```
### 🧠 Trading Psychology Integration
Drawing from principles in *The Mountain Is You*, this indicator helps you:
**1. Recognize Self-Sabotage Patterns**
- **The Premature Entry**: Entering before price reaches your planned level
- **Solution**: Set alerts at unmitigated levels, wait for proximity warnings
- **The Profit-Taking Problem**: Exiting too early from fear
- **Solution**: Identify the next unmitigated level and commit to holding until proximity alert
- **The Loss Holding**: Refusing to exit losing trades
- **Solution**: When price breaks through and mitigates your entry level, it's telling you the structure changed
**2. Building Better Habits**
The color-coded age system trains your brain to:
- Respect levels that have proven themselves over time
- Distinguish between noise (new levels) and structure (old levels)
- Make decisions based on objective data, not fear or greed
**3. Emotional Regulation**
The proximity alerts serve as:
- **Circuit breakers** - Forcing you to re-evaluate before dangerous zones
- **Permission to act** - Giving you objective signals to exit without second-guessing
- **Validation** - Confirming when you're in alignment with market structure
### 📝 Pre-Market Routine
**Daily Setup Checklist:**
1. ✅ Identify the 3 nearest unmitigated highs above current price
2. ✅ Identify the 3 nearest unmitigated lows below current price
3. ✅ Note which are ancient (7+) - these are your "no-go" zones
4. ✅ Check the tunnel width (Δ in status row) - tight or wide?
5. ✅ Set alerts at the 1st high and 1st low for proximity warnings
6. ✅ Plan: "If we go up, I exit at ___. If we go down, I enter at ___."
### 🔄 Timeframe Confluence
**Multi-Timeframe Strategy:**
Run the indicator on **three instances**:
- **15-minute** (short-term structure)
- **1-hour** (intermediate structure)
- **4-hour** (major structure)
**Strong Setup**: When all three timeframes show unmitigated levels converging at the same price zone.
**Example:**
- 15m: Old low at 21,400
- 1H: Ancient low at 21,398
- 4H: Ancient low at 21,395
- **Result**: 21,395-21,400 is a monster support zone
### ⚠️ What This Indicator Doesn't Do
**Not a Crystal Ball**
- It doesn't predict where price will go
- It shows you where price *hasn't been* and how long it's been avoided
- The trading decisions are still yours
**Not an Entry Signal Generator**
- It provides context and structure
- You need to combine it with your entry methodology (price action, indicators, order flow, etc.)
**Not Foolproof**
- Ancient levels get broken
- Proximity alerts can trigger early in strong trends
- The market doesn't "owe" you a reversal at any level
---
## Common Scenarios
### Scenario 1: "Level Cluster Ahead"
**Situation**: You're long at 21,400. The table shows:
- 1st High: 21,425 (2 sessions old)
- 2nd High: 21,428 (3 sessions old)
- 3rd High: 21,435 (6 sessions old)
**Interpretation**: There's a resistance cluster just 25-35 points away. The 6-session-old level is particularly significant.
**Action**:
- Set first profit target at 21,420 (before the cluster)
- Set second target at 21,426 (between 1st and 2nd)
- Trail remaining position, but be ready to exit on rejection at 21,435
**Cave Diving Analogy**: You're approaching an overhead section with limited clearance. Lighten your load (reduce position) before entering.
---
### Scenario 2: "Ancient Level Approaches"
**Situation**: The market is grinding higher. You see ⚠️ appear next to a 9-session-old high at 21,500.
**Interpretation**: This level has survived over a week without being touched. Massive potential liquidity zone.
**Action**:
- If long, this is your absolute exit zone. Take profits before or at level.
- If looking to short, wait for clear rejection (price taps and reverses)
- Don't try to buy the breakout until it clearly breaks and retests
**Cave Diving Analogy**: Your dive computer is beeping - you've reached your planned turn-back depth. No matter how interesting it looks ahead, honor your plan.
---
### Scenario 3: "Mitigated Levels Create New Structure"
**Situation**: Price breaks and mitigates the 1st High. The previous 2nd High becomes the new 1st High.
**Interpretation**: The structure just shifted. What was the 2nd level is now most relevant.
**Action**:
- Watch how price reacts to the newly-mitigated level
- If it holds below (acts as resistance), bearish
- If it reclaims and holds above (acts as support), bullish
- The NEW 1st High is your next target/resistance
**Cave Diving Analogy**: You've passed through a restriction - the cave layout ahead is different now. Update your mental map.
---
### Scenario 4: "Tight Tunnel, Upcoming Breakout"
**Situation**: The Δ in the status row shows 3.25 points (very tight). Bands are converging.
**Interpretation**: Price is consolidating between very close unmitigated levels. Breakout likely.
**Action**:
- Don't try to predict direction
- Set alerts above 1st High and below 1st Low
- When break occurs, trade the retest
- Expect volatility - use wider stops
**Cave Diving Analogy**: You're in a narrow passage. Movement will be sudden and directional once it starts.
---
### Scenario 5: "Imbalanced Structure"
**Situation**: The statistics row shows "📊 22↑ / 7↓"
**Interpretation**: There are many more unmitigated highs than lows. This suggests:
- Price has been declining (hitting lows, leaving highs behind)
- Potential bullish reversal zone (lots of overhead supply mitigated)
- Or continued bearish structure (resistance everywhere above)
**Action**:
- Look at the age of those 22 highs
- If mostly new (0-2 sessions): Just a recent downmove, not significant yet
- If many old/ancient: Strong overhead resistance, be cautious on longs
- Compare to price action: Is price respecting the remaining lows?
**Cave Diving Analogy**: You've swam deeper than your starting point - most of your markers are above you now. Are you planning the ascent or going deeper?
---
## Final Thoughts: The Philosophy
This indicator is built on a simple but powerful principle: **The market has memory, and that memory has weight.**
Every unmitigated level represents:
- Liquidity left behind
- Orders waiting to be filled
- Institutional interest potentially parked
- Psychological significance for participants
The longer a level remains unmitigated, the more "charged" it becomes. When price finally revisits it, something significant usually happens - either a strong reversal or a definitive break.
Your job as a trader isn't to predict which outcome will occur. Your job is to:
1. **Recognize** when you're approaching these charged zones
2. **Respect** them by adjusting position size and risk
3. **React** appropriately based on how price behaves at them
4. **Remember** that ancient levels (like ancient wisdom) deserve extra reverence
The Cave Diving Framework embedded in this indicator serves as a constant reminder: Trading, like cave diving, requires rigorous respect for environmental hazards, meticulous planning, and the discipline to turn back when your limits are reached.
**Every proximity alert is the market asking you**: *"Do you really want to go deeper?"*
Sometimes the answer is yes - when your setup, confluence, and risk management all align.
Often, the answer should be no - and that's the trader avoiding the accident that would have happened to the gambler.
---
### 🎯 Quick Reference Card
**Color System:**
- 🟢 Bright colors = New (0-1 sessions) = Shallow water
- 🟡 Medium colors = Medium (2-3 sessions) = Penetration depth
- 🔴 Dark colors = Old (4-6 sessions) = Deep dive zone
- 🟣 Deep dark colors = Ancient (7+ sessions) = Overhead environment
**Symbols:**
- ↑ ↑↑ ↑↑↑ ↑↑↑↑ ↑↑↑↑↑ = High levels (1st through 5th)
- ↓ ↓↓ ↓↓↓ ↓↓↓↓ ↓↓↓↓↓ = Low levels (1st through 5th)
- ⚠️ = Proximity alert (danger zone)
- 🟢 = Bullish structure
- 🔴 = Bearish structure
- Δ = Tunnel width (distance between 1st high and 1st low)
**Critical Rules:**
1. Never fight ancient levels (7+ sessions)
2. Respect proximity alerts (⚠️)
3. Scale out near old/ancient resistance
4. Wait for confluence when entering
5. Let mitigated levels prove their new role
---
**Remember**: The indicator gives you structure. The trading edge comes from your discipline in respecting that structure.
Trade safe, trade smart, and always know your exit before your entry. 🎯
---
*"You don't become your best self by denying your patterns. You become your best self by recognizing them, understanding them, and choosing differently." - Adapted from The Mountain Is You*
In trading: You don't become profitable by ignoring market structure. You become profitable by recognizing it, understanding it, and choosing your entries accordingly.

FluxPulse Beacon## FluxPulse Beacon
FluxPulse Beacon applies a microstructure lens to every bar, combining directional thrust, realized volatility, and multi-timeframe liquidity checks to decide whether the tape is being pushed by real sponsorship or just noise. The oscillator's color-coded columns and adaptive burst thresholds transform complex flow dynamics into a single actionable flux score for futures and equities traders.
HOW IT WORKS
Momentum Extraction – Price differentials over a configurable pulse distance are smoothed using exponential moving averages to isolate directional thrust without reacting to single prints.
Volatility + Liquidity Normalization – The momentum stream is divided by realized volatility and multiplied by both local and higher-timeframe EMA volume ratios, ensuring pulses only appear when volatility and liquidity align.
Adaptive Thresholding – A volatility-derived standard deviation of flux is blended with the base threshold so bursts scale automatically between low-volatility and high-volatility market conditions.
Divergence Engine – Linear regression slopes compare price vs. flux to tag bullish/bearish divergences, highlighting stealth accumulation or distribution zones.
HOW TO USE IT
Continuation Entries : Go with the trend when histogram bars stay above the adaptive threshold, the signal line confirms, and trend bias agrees—this is where liquidity-backed follow-through lives.
Fade Plays : Watch for divergence alerts and shrinking compression values; when flux prints below zero yet price grinds higher, hidden selling pressure often precedes rollovers.
Session Filter : Compression percentage in the diagnostics table instantly tells you whether to trade thin overnight sessions—low compression means stand down.
VISUAL FEATURES
Dynamic background heat maps flux magnitude, while threshold lines provide a quick read on whether a pulse is statistically significant.
Diagnostics table displays live flux, signal, adaptive threshold, and compression for quick reference.
Alert-first workflow: The surface is intentionally clean—bursts and divergences are delivered via alerts instead of on-chart clutter.
PARAMETERS
Trend EMA Length (default: 34): Defines the macro bias anchor; increase for higher-timeframe confirmation.
Pulse Distance (default: 8): Controls how sensitive momentum extraction becomes.
Volatility Window (default: 21): Sample window for realized volatility normalization.
Liquidity Window (default: 55): Volume smoothing window that proxies liquidity expansion.
Liquidity Reference TF (default: 60): Select a higher timeframe to cross-check whether current volume matches institutional flows.
Adaptive Threshold (default: enabled): Disable for fixed thresholds on slower markets; enable for high-volatility assets.
Base Burst Threshold (default: 1.25): Minimum flux magnitude that qualifies as an actionable pulse.
ALERTS
The indicator includes four alert conditions:
Bull Burst: Detects upside liquidity pulses
Bear Burst: Detects downside liquidity pulses
Bull Divergence: Flags bullish delta divergence
Bear Divergence: Flags bearish delta divergence
LIMITATIONS
This indicator is designed for liquid futures and equity markets. Performance may degrade in low-volume or highly illiquid instruments. The adaptive threshold system works best on timeframes where sufficient volatility history exists (typically 15-minute charts and above). Divergence signals are probabilistic and should be confirmed with price action.
INSERT_CHART_SNAPSHOT_URL_HERE
---
## RangeLattice Mapper
RangeLattice Mapper constructs a higher-timeframe scaffolding on any intraday chart, locking in structural highs/lows, mid/quarter grids, VWAP confluence, and live acceptance/break analytics. It provides a non-repainting overlay that turns range management into a disciplined process.
HOW IT WORKS
Structure Harvesting – Using request.security() , the script samples highs/lows from a user-selected timeframe (default 240 minutes) over a configurable lookback to establish the dominant range.
Grid Construction – Midpoint and quarter levels are derived mathematically, mirroring how institutional traders map distribution/accumulation zones.
Acceptance Detection – Consecutive closes inside the range flip an acceptance flag and darken the cloud, signaling balanced auction conditions.
Break Confirmation – Multi-bar closes outside the structure raise break labels and alerts, filtering the countless fake-outs that plague breakout traders.
VWAP Fan Overlay – Session VWAP plus ATR-based bands provide a live measure of flow centering relative to the lattice.
HOW TO USE IT
Range Plays : Fade taps of the outer rails only when acceptance is active and VWAP sits inside the grid—this is where mean-reversion works best.
Breakout Plays : Wait for confirmed break labels before entering expansion trades; the dashboard's Width/ATR metric tells you if the expansion has enough fuel.
Market Prep : Carry the same lattice from pre-market into regular trading hours by keeping the structure timeframe fixed; alerts keep you notified even when managing multiple tickers.
VISUAL FEATURES
Range Tap and Mid Pivot markers provide a tape-reading breadcrumb trail for journaling.
Cloud fill opacity tightens when acceptance persists, visually signaling balance compressions ready to break.
Dashboard displays absolute width, ATR-normalized width, and current state (Balanced vs Transitional) so you can glance across charts quickly.
Acceptance Flag toggle: Keep the repeated acceptance squares hidden until you need to audit balance.
PARAMETERS
Structure Timeframe (default: 240): Choose the timeframe whose ranges matter most (4H for indices, Daily for stocks).
Structure Lookback (default: 60): Bars sampled on the structure timeframe.
Acceptance Bars (default: 8): How many consecutive bars inside the range confirm balance.
Break Confirmation Bars (default: 3): Bars required outside the range to validate a breakout.
ATR Reference (default: 14): ATR period for width normalization.
Show Midpoint Grid (default: enabled): Display the midpoint and quarter levels.
Show Adaptive VWAP Fan (default: enabled): Toggle the VWAP channel for assets where volume distribution matters most.
Show Acceptance Flags (default: disabled): Turn the acceptance markers on/off for maximum visual control.
Show Range Dashboard (default: enabled): Disable if screen space is limited, re-enable during prep sessions.
ALERTS
The indicator includes five alert conditions:
Range High Tap: Price interacted with the RangeLattice high
Range Low Tap: Price interacted with the RangeLattice low
Range Mid Tap: Price interacted with the RangeLattice mid
Range Break Up: Confirmed upside breakout
Range Break Down: Confirmed downside breakout
LIMITATIONS
This indicator works best on liquid instruments with clear structural levels. On very low timeframes (1-minute and below), the structure may update too frequently to be useful. The acceptance/break confirmation system requires patience—faster traders may find the multi-bar confirmation too slow for scalping. The VWAP fan is session-based and resets daily, which may not suit all trading styles.
---

AliceTears GridAliceTears Grid is a customizable Mean Reversion system designed to capitalize on market volatility during specific trading sessions. Unlike standard grid bots that place blind limit orders, this strategy establishes a daily or session-based "Baseline" and looks for price over-extensions to fade the move back to the mean.
This strategy is best suited for ranging markets (sideways accumulation) or specific forex sessions (e.g., Asian Session or NY/London overlap) where price tends to revert to the opening price.
🛠 How It Works
1. The Baseline & Grid Generation At the start of every session (or the daily open), the script records the Open price. It then projects visual grid lines above and below this price based on your Step % input.
Example: If the Open is $100 and Step is 1%, lines are drawn at $101, $102, $99, $98, etc.
2. Entry Logic: Reversal Mode This script features a "Reversal Mode" (enabled by default) to filter out "falling knives."
Standard Grid: Buys immediately when price touches the line.
AliceTears Logic: Waits for the price to breach a grid level and then close back inside towards the mean. This confirms a potential rejection of that level before entering.
3. Exit Logic
Target Profit: The primary target is the previous grid level (Mean Reversion).
Trailing Stop: If the price continues moving in your favor, a trailing stop activates to maximize the run.
Stop Loss: A manual percentage-based stop loss is available to prevent deep drawdowns in trending markets.
⚙️ Key Features
Visual Grid: Automatically draws entry levels on the chart for the current session, helping you visualize where the "math" is waiting for price.
Timezone & Session Control: Includes a custom Timezone Offset tool. You can trade specific hours (e.g., 09:30–16:00) regardless of your chart's UTC setting.
Grid Management: Independent logic for Long and Short grids with pyramiding capabilities.
Safety Filters: Options to force-close trades at the end of the session to avoid overnight gaps.
⚠️ Risk Warning
Please Read Before Using: This is a Counter-Trend / Grid Strategy.
Pros: High win rate in sideways/ranging markets.
Cons: In strong trending markets (parabolic pumps or crashes), this strategy will add to losing positions ("catch a falling knife").
Recommendation: Always use the Stop Loss and Date Filter inputs. Do not run this on highly volatile assets without strict risk management parameters.
Settings Guide
Entry Reversal Mode: Keep checked for safer entries. Uncheck for aggressive limit-order style execution.
Grid Step (%): The distance between lines. For Forex, use lower values (0.1% - 0.5%). For Crypto, use higher values (1.0% - 3.0%).
UTC Offset: Adjust this to align the Session Hours with your target market (e.g., -5 for New York).
This script is open source. Feel free to use it for educational purposes or modify it to fit your trading style.

Daily ATR Dashboard - NIRALADaily ATR Dashboard: Volatility at a Glance
What is this?
The "Daily ATR Dashboard" is a simple, non-intrusive utility tool designed for intraday traders. It places a clean information table in the top-right corner of your chart, displaying the Daily Average True Range (DATR) for the current session and the previous two days.
Why is it useful?
Understanding daily volatility is crucial for setting realistic targets and stop-losses.
Know the Range: Instantly see how much the instrument typically moves in a day.
Context: Compare today's volatility with yesterday's and the day before to gauge if the market is expanding (becoming more volatile) or contracting (consolidating).
Clean Charts: Instead of plotting a messy ATR line indicator below your price action, this dashboard gives you the raw data you need without cluttering your workspace.
Features:
Real-Time Data: The "Today" row updates in real-time as the current daily candle develops.
Historical Context: Automatically fetches and displays the final DATR values for the previous two sessions ("Yesterday" and "Day Before").
Highlighted Current Day: The current day's data is highlighted in yellow for immediate visibility.
Customizable: You can adjust the ATR length (default is 14) and the text size to fit your screen perfectly.
How to Read It:
Today: The current volatility of the ongoing daily session.
Yesterday / Day Before: The finalized volatility of past sessions.
Tip: If "Today's" ATR is significantly lower than the previous days, expect potential expansion or a breakout soon. If it is significantly higher, the market may be overextended.
Settings:
DATR Length: The lookback period for the ATR calculation (Default: 14).
Text Size: Adjust the size of the table text (Tiny, Small, Normal, Large).

ICT Macro Slot Algo Event📊 Overview
A powerful multi-timeframe trading indicator that combines Institutional Macro Session Tracking identify optimal trading windows throughout the day. This tool helps traders align with institutional flow patterns and algorithmic activity across major sessions.
🎯 Key Features
1. Macro Algo Event Sessions
Tracks 6 key institutional time windows during NY Session:
NY Sweep (08:50-09:10) - Opening balance flows
Silver Bullet #1 (09:50-10:10) - First major macro move
Silver Bullet #2 (10:50-11:10) - Second chance/retest opportunity
Lunch Macro (11:50-12:10) - Mid-day repositioning
Post-Lunch Rebalance (13:10-13:40) - Post-lunch adjustments
NY Closing Macros (15:15-15:45) - End-of-day flows

ICT Macro Slot Algo Event📊 Overview
A powerful multi-timeframe trading indicator that combines Institutional Macro Session Tracking to identify optimal trading windows throughout the day. This tool helps traders align with institutional flow patterns and algorithmic activity across major sessions.
🎯 Key Features
1. Macro Algo Event Sessions
Tracks 6 key institutional time windows during NY Session:
NY Sweep (08:50-09:10) - Opening balance flows
Silver Bullet #1 (09:50-10:10) - First major macro move
Silver Bullet #2 (10:50-11:10) - Second chance/retest opportunity
Lunch Macro (11:50-12:10) - Mid-day repositioning
Post-Lunch Rebalance (13:10-13:40) - Post-lunch adjustments
NY Closing Macros (15:15-15:45) - End-of-day flows

Golden BOS Strategy - ChecklistA clean, mechanical on-chart checklist designed for multi-timeframe traders using the Golden BOS / Institutional Retracement Framework.
This tool helps you stay disciplined by tracking each requirement of the strategy in real time:
Included Criteria
4H Bias: Bullish or bearish macro structure
1H Structure: Push/pull phase + golden zone retracement
5M Entry Model:
Break of Structure (BOS)
5M golden zone retracement
POI validation (OB/FVG/Breaker)
Final micro BOS or rejection confirmation
Risk Filters:
Session validity (London / NY)
Red news avoidance
Stop-loss placement check
Liquidity-based target confirmation
Purpose
This overlay ensures every trade meets strict criteria before execution, removing emotion and improvisation. Ideal for backtesting, forward testing, and staying consistent during live market conditions.
Golden BOS Strategy — Description
The Golden BOS Strategy is a structured, multi-timeframe trading system designed to capture high-probability continuation moves during London and New York sessions. The strategy combines institutional concepts with Fibonacci-based retracements to identify discounted entry zones aligned with higher-timeframe direction.
Using the 4H timeframe, traders establish the daily macro bias and identify the dominant trend. The 1H chart is then used to confirm the current phase of market structure, distinguishing between impulsive “push” moves and corrective “pullback” phases. A Fibonacci retracement is applied to the most recent 1H impulse leg to define a high-value discount or premium zone where entries become valid.
Execution takes place on the 5-minute chart. Once price reaches the 1H golden zone (61.8–78.6%), a Break of Structure (BOS) is required to confirm a shift in short-term momentum. A second Fibonacci retracement is then drawn on the 5M impulse leg that caused the BOS, and price must retrace back into the 5M golden zone. Traders refine their entry using a confluence point of interest (POI) such as a Fair Value Gap (FVG), Order Block, Breaker Block, or Inverse FVG, ideally accompanied by a final micro BOS or rejection candle.
Risk management is strict and rule-driven. Stop loss is placed beyond the extreme wick of the POI, while take-profit targets are set at logical liquidity pools in the direction of the higher-timeframe trend. The strategy avoids red-folder news and only allows trades during active sessions to ensure optimal volatility and reliability.
The Golden BOS Strategy is designed to impose discipline, reduce discretionary errors, and give traders a repeatable, mechanical framework for navigating trending markets with precision.
