PSAR BBPT ZLSMA BTC 1minLong entry:
PSAR gives buy signal
BBPT prints green histogram
ZLSMA is below the price
ZLSMA has uptrend
SL is smaller than the max SL
Optional Sessions and EMA filters
Short entry
PSAR gives sell signal
BBPT prints red histogram
ZLSMA is above the price
ZLSMA has downtrend
SL is smaller than the max SL
Optional Sessions and EMA filters
SL:
Placed below ZLSMA + offset on long
Placed above ZLSMA + offset on short
TP1:
1x the SL by default
Takes no profit by default, 50% is also a good setting
TP2:
2x the SL by default
Take out all remaining position size.
If price reaches TP1, the SL is set to the entry price.
Cari dalam skrip untuk "sessions"

JustaBox_NY_LexThis indicator marks two boxes around the opening hour of the chosen session(s). One around the highs and lows and one around the highest open/close and lowest open/close for that hour., its main purpose if for backtesting the DR/IDR strategy but is useful for live trading as it auto adds the boxes and STD levels. The buy and sell signals that show up are not meant for trade entries, they just give an idea of whether there was a signal that day which is a close above or below the IDR (inner box lines), from there loops are started and it tests which STD levels get hit or if the opposite end of the box is crossed it considers it a stop out and closes the loops. The data from these loops can be pulled to email and then excel using the alert system.
This is the first thing i've ever coded, I put alot of work into it but id recommend going thru a few days randomly and checking the data matches up as expected.
This indicator only pulls data from the NY session, I have two others of identical functionality, the only difference being they pull the data from the London and Tokyo sessions respectively, wanted to include all three in one but I reached a limit. Search JustaBox_LDN_Lex and JustaBox_TKO_Lex
When live, once the hour of the chosen session resolves it marks the DR and IDR lines onward for a few hours, adds a 0.5 retracement line in the middle and STD levels above and below at 0.5, 1, 1.5, 2, 2.5, & 3.
There are labels that can be turned off, they show the prices these lines are set at.
Read the tooltips in the menu for more information.
(Might be self explanatory when you pull it but I'll add a key here for the titles of the data(had to keep them short due to character limit) and explain how the test works in the next couple of days but quickly:
Each STD levels has a true, false or NaN state, if its a buy signal for the session the STD levels below the bottom DR are turned off and will return NaN, but if its a sell signal they'll return false if they don't get hit true if they do. Each level has a cross time this is a bar number, you also get a bar number for the last bar in the DR box and one for when you received the buy or sell signal, so you subtract one of these from the STD X number and it will give you number of bars since 10:30 for NY sess or from when you received signal. Multiply that number by 5 to get the number of minutes. Gives prices for boxes, open and close prices of first and last candles in box and price of the NY day open for all sessions)

RF+ Divergence Scalping SystemRF+ Divergence Scalping System + Custom Signals + Alerts.
This chart overlay indicator has been developed for the low timeframe divergence scalper.
Built upon the realtime divergence drawing code from the Divergence for Many indicator originally authored by Lonsometheblue, this chart overlay indicator bundles several additional unique features and modifications to serve as an all-in-one divergence scalping system. The current key features at the time of publishing are listed below (features are optional and can be enabled or disabled):
- Fully configurable realtime divergence drawing and alerting feature that can draw divergences directly on the chart using data sourced from up to 11 oscillators selected by the user, which have been included specifically for their ability to detect divergences, including oscillators not presently included in the original Divergence for Many indicator, such as the Ultimate Oscillator and TSI.
- Optional on chart table showing a summary of key statuses of various indicators, and nearby divergences.
- 2 x Range Filters with custom settings used for low timeframe trend detection.
- 3 x configurable multi-timeframe Stochastic RSI overbought and oversold signals with presentation options.
- On-chart pivot points drawn automatically.
- Automatically adjusted pivot period for up to 4 configurable time frames to fine tune divergences drawn for optimal divergence detection.
- Real-price line for use with Heikin Ashi candles, with styling options.
- Real-price close dots for use with Heikin Ashi candles, with styling options.
- A selection of custom signals that can be printed on-chart and alerted.
- Sessions indicator for the London, New York, Tokyo and Sydney trading sessions, including daylight savings toggle, and unique ‘invert background color’ option, which colours the entire chart - except the trading session you have selected, leaving your chart clear of distracting background color.
- Up to 4 fully configurable moving averages.
- Additional configurable settings for numerous built in indicators, allowing you to alter the lengths and source types, including the UO, TSI, MFI, TSV, 2 x Range Filters.
- Configurable RSI Trend detection signal filter used in a number of the signals, which filters buy signals where the RSI is over the RSI moving average, and only prints sell signals where RSI is under the moving average.
- Customisable on-chart watermark, with inputs for a custom title, subtitle, and also an optional symbol | timeframe | date feature.
The Oscillators able to be selected for use in drawing divergences at the time of publishing are as follows:
- Ultimate Oscillator (UO)
- True Strength Indicator (TSI)
- Money Flow Index (MFI)
- Cumulative Delta Volume (CDV)
- Time Segmented Volume (TSV)
- Commodity Channel Index (CCI)
- Awesome Oscillator
- Relative Strength Index (RSI)
- Stochastic
- On Balance Volume (OBV)
- MACD Histogram
What are divergences?
Divergence is when the price of an asset is moving in the opposite direction of a technical indicator, such as an oscillator, or is moving contrary to other data. Divergence warns that the current price trend may be weakening, and in some cases may lead to the price changing direction.
There are 4 main types of divergence, which are split into 2 categories;
regular divergences and hidden divergences. Regular divergences indicate possible trend reversals, and hidden divergences indicate possible trend continuation.
Regular bullish divergence: An indication of a potential trend reversal, from the current downtrend, to an uptrend.
Regular bearish divergence: An indication of a potential trend reversal, from the current uptrend, to a downtrend.
Hidden bullish divergence: An indication of a potential uptrend continuation.
Hidden bearish divergence: An indication of a potential downtrend continuation.
Setting alerts.
With this indicator you can set alerts to notify you when any/all of the above types of divergences occur, on any chart timeframe you choose, also when the triple timeframe Stochastic RSI overbought and oversold confluences occur, as well as when custom signals are printed.
Configurable pivot period values.
You can adjust the default pivot period values to suit your prefered trading style and timeframe. If you like to trade a shorter time frame, lowering the default lookback values will make the divergences drawn more sensitive to short term price action. By default, this indicator has enabled the automatic adjustment of the pivot periods for 4 configurable time frames, in a bid to optimize the divergences drawn when the indicator is loaded onto any of the 4 time frames selected. These time frames and their associated pivot periods can be fully reconfigured within the settings menu. By default, these have been further optimized for the low timeframe scalper trading on the 1-15 minute time frames.
How do traders use divergences in their trading?
A divergence is considered a leading indicator in technical analysis , meaning it has the ability to indicate a potential price move in the short term future.
Hidden bullish and hidden bearish divergences, which indicate a potential continuation of the current trend are sometimes considered a good place for traders to begin, since trend continuation occurs more frequently than reversals, or trend changes.
When trading regular bullish divergences and regular bearish divergences, which are indications of a trend reversal, the probability of it doing so may increase when these occur at a strong support or resistance level . A common mistake new traders make is to get into a regular divergence trade too early, assuming it will immediately reverse, but these can continue to form for some time before the trend eventually changes, by using forms of support or resistance as an added confluence, such as when price reaches a moving average, the success rate when trading these patterns may increase.
Typically, traders will manually draw lines across the swing highs and swing lows of both the price chart and the oscillator to see whether they appear to present a divergence, this indicator will draw them for you, quickly and clearly, and can notify you when they occur.
How do traders use overbought and oversold levels in their trading?
The oversold level is when the Stochastic RSI is above the 80 level is typically interpreted as being 'overbought', and below the 20 level is typically considered 'oversold'. Traders will often use the Stochastic RSI at, or crossing down from an overbought level as a confluence for entry into a short position, and the Stochastic RSI at, or crossing up from an oversold level as a confluence for an entry into a long position. These levels do not mean that price will necessarily reverse at those levels in a reliable way, however. This is why this version of the Stoch RSI employs the triple timeframe overbought and oversold confluence, in an attempt to add a more confluence and reliability to this usage of the Stoch RSI.
This indicator is intended for use in conjunction with related panel indicators including the TSI+ (True Strength Indicator + Realtime Divergences), UO+ (Ultimate Oscillator + Realtime Divergences), and optionally the STRSI+ (MTF Stochastic RSI + Realtime Divergences) and MFI+ (Money Flow Index + Realtime Divergences) available via this authors’ Tradingview profile, under the scripts section. The realtime divergence drawing code will not identify all divergences, so it is suggested that you also have panel indicators to observe. Each panel indicator also offers additional means of entry confirmation into divergence trades, for example, the Stochastic can indicate when it is crossing down from overbought or up from oversold, the TSi can indicate when the 2 TSI bands cross over one another upward or downward, and the UO and MFI can indicate an entry confluence when they are nearing, or crossing their centerlines, for more confidence in your divergence trade entries.
Additional information on the settings for this indicator can be found via the tooltips within the settings menu itself. Further information on feature updates, and usage tips & tricks will be added to the comments section below in due course.
Disclaimer: This indicator uses code adapted from the Divergence for Many v4 indicator authored by Lonesometheblue, and several stock indicators authored by Tradingview. With many thanks.

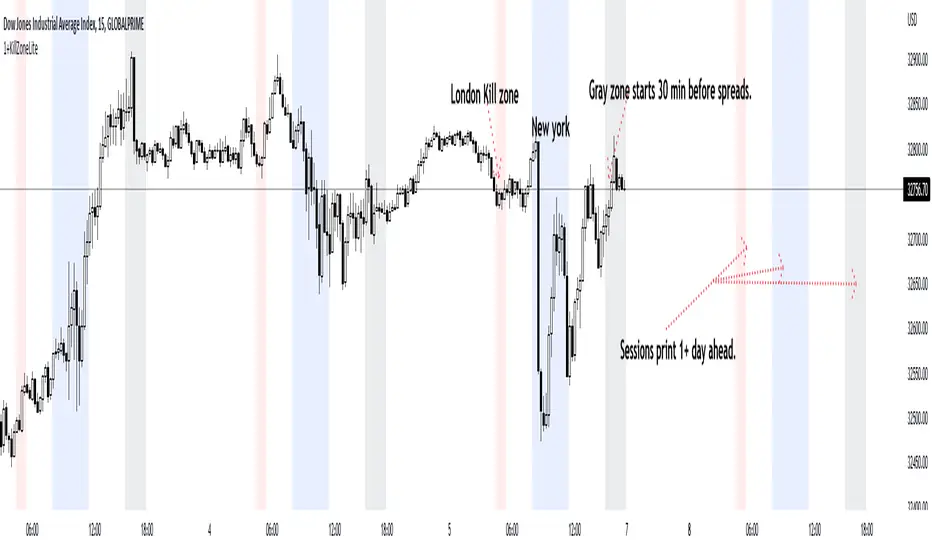
1+KillZoneLiteRemove plot line for a better view. I've made this to work on "US30 Global Prime" probably works on other pairs the codes left open to mod.
This Indicator shows 3 sessions to help you focus on timing. This will help you with learning pattern recognition aswell.
1. Gray zone is spreads. The gray zone will show up 30 min before spreads open up.
2. Blue is new york
3. Red is london reversal zone.
4. Look between the zones and also how price reacts within the zones and at what time.
5. This indicator also prints the sessions 1 day in advance to help with back testing aswell.
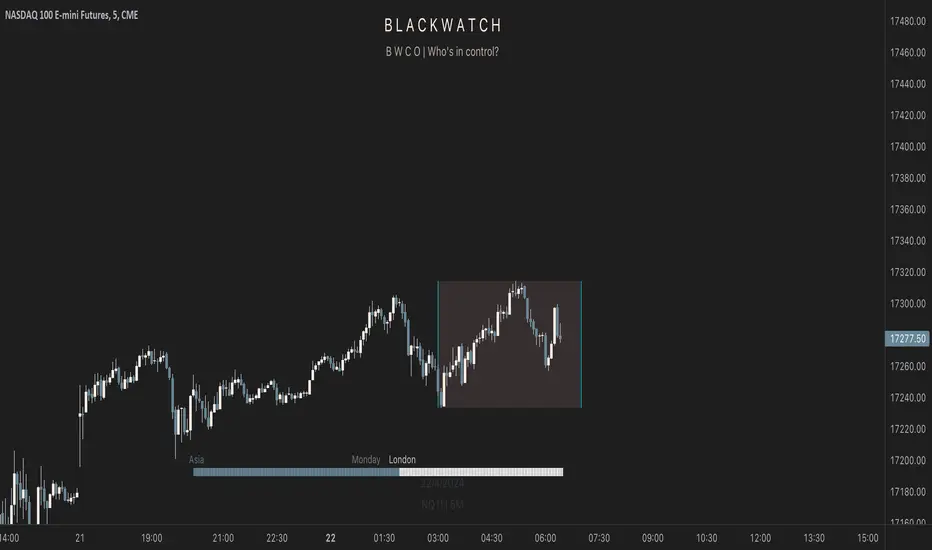
Phantom - My Session RangeThis is a modification of a script by RobMinty, "FXN - Asian Session Range" The script provides functionality to track specific trading sessions based on user preference rather than just the market sessions open and close. The idea is to help you hold yourself accountable to your specific trading times as well as backtest various marketing timings suitable to your schedule.
This script utilizes RobMinty's pine code to visualize your market session. We have adjusted the script to project the end of the session before the candles print - as well as adding/subtracting the horizontal and/or vertical lines around the current session box. This should help you understand how much time you have left in your session with a quick visual representation. While we have made some additions and adjustments to RobMinty's script- The inputs and functions of the combined script have not changed significantly from the originals. Like the originals, the code has been made open-source. If this script is reused or modified, please provide credit to RobMinty. If you plan to use this specific code with the ability to remove lines from the box and project session end forward, please credit both of us.
FULL MA Optimization ScriptHello!
This script measures the performance of 10 moving averages and compares them!
Crossover and crossunders are both tested.
The tested moving averages include: TEMA, DEMA, EMA, SMA, ALMA, HMA, T3 Average, WMA, VWMA, LSMA.
You can select the length of the moving averages and the data source (I.E, close, open, ohlc4, etc.) and the script will calculate your selections!
For instance, if you select a length of 32 and a source of ohlc4 for crossovers, the script will assign the ten moving averages that length and data source and compare the performance for ohlc4 crossovers of the 32TEMA, 32DEMA, 32SMA, 32WMA, etc. If you select crossunder, the script will calculate the performance of ohlc4 crossunders of the same moving average lengths.
Moving average performances are listed in descending order (best to worst) and are categorized by tier: Upper-Tier, Mid-Tier, Lower-Tier. The Upper-Tier displays the three best performing averages relative to the MA length and data source, for the asset on the relevant chart timeframe. The Lower-Tier displays the three worst performing averages. The Mid-Tier displays the moving averages whose performance did not achieve a top three spot or a bottom three spot.
Also calculated is the moving average which achieved the highest cumulative gain/loss and the lowest cumulative gain/loss. Any asset and timeframe can be tested; the script recalculates relative to the chart timeframe. I added a "Benchmark Moving Average" free parameter and a "Custom Moving Average" free parameter. The two operate identically; you can set the length and data source of both for quick and simple comparison between differing average lengths and sources.
If "Crossover" is selected, the "(X Candles)" displayed on the tables reflects the average number of sessions the data source remains above a moving average following a crossover. If "Crossunder" is selected, the "(X Candles)" reflects the average number of sessions the data source remains below the moving average following a crossunder.
If "Crossover" is selected, the listed "X%" reflects the average percentage gain/loss following a source crossover of a moving average up until the source crosses back under the moving average. If "Crossunder" is selected, the listed "X%" reflects the average percentage gain/loss following a source crossunder of a moving average up until the source crosses back over the moving average.
If "Crossover" is selected, the listed "X Crosses" reflects the number of instances in which the source crossed over a moving average. If "Crossunder" is selected, the listed "X Crosses" reflects the number of instances in which the source crossed under a moving average.
Additional tooltips and instructions are included should you access the user input menu.
The moving averages can be plotted as a gradient (highest priced MA to lowest priced MA) alongside the best performing moving average. The moving averages can be plotted in full color, light color alongside the best performing average, or not plotted.
This script improves upon a similar script I have released:
I decided not to update the previous script. The previous script calculates crossovers only and, due to being less code intensive, calculates much quicker. If a user is concerned only with price crossovers, not crossunders, the original script is a better option! It's faster, making it the preferable choice!
This script "FULL MA Optimization" calculates crossovers/crossunders and incorporates additional plot styles. I ran into trouble a few times where the script was too large to run on TV. This script is not "slow", I suppose; however, calculations and parameter modifications take a bit longer than the original script!

SetSessionTimesLibrary "SetSessionTimes"
Function to automatically set session times for symbols and eventually timezone.
Useful mainly for futures contracts, to differentiate between pit and overnight sessions, and for 24 hours symbols if you want to "create" sessions for them
This library only returns correct session times to the calling script and does nothing by itself on the chart. the calling script must then use the returned session times to do anything.
For example, in the attached chart this library is used by my initial balance indicator, which calls it to retrieve the correct session times for the selected symbol in the chart, given that different futures contracts have different pit session times (RTH times) and Tradingview hasn't implemented that yet.
SetSessionTimes()

Koalafied Initial Balance Levels and ExtensionsShows the Initial Balance and range extensions for either the Daily session or individual market sessions (Asia, London, New York).
Initial Balance is the range represented by the first two segments (typically half-hour segments) of a trading session. Range extensions are a function of the longer-term trader participation, pushing price outside of the beginning 'fair' range established by the local traders. With the introduction of 24/7 markets the initial balance is often now regarded as less important than in the past, however re-calculating IB for multiple trading sessions may reinstitute insight to Market Direction and Confidence

Kviateq - Session PivotsFirst of all, I must say that this script wouldn't be possible without the help of one of the best script developers on TradingView - @ahancock (thanks a bunch for your help)
This script draws opening ranges for each of the sessions - Tokyo, London and New York and plots session high, low and pivot range of the previous session.
So if you trade London session - you would only take longs if we're above the Tokyo pivot range and vice versa for shorts.
Often times previous session's highs act as resistance and lows act as support, so careful trading around those levels.
It is obviously meant for lower timeframes, since each of the sessions only lasts a few hours.
Default settings are set to the exchange that I use and my timezone (GMT +7), so you might need to adjust the settings accordingly.
Tokyo - 12am GMT
London - 7am GMT
New York - 12pm GMT

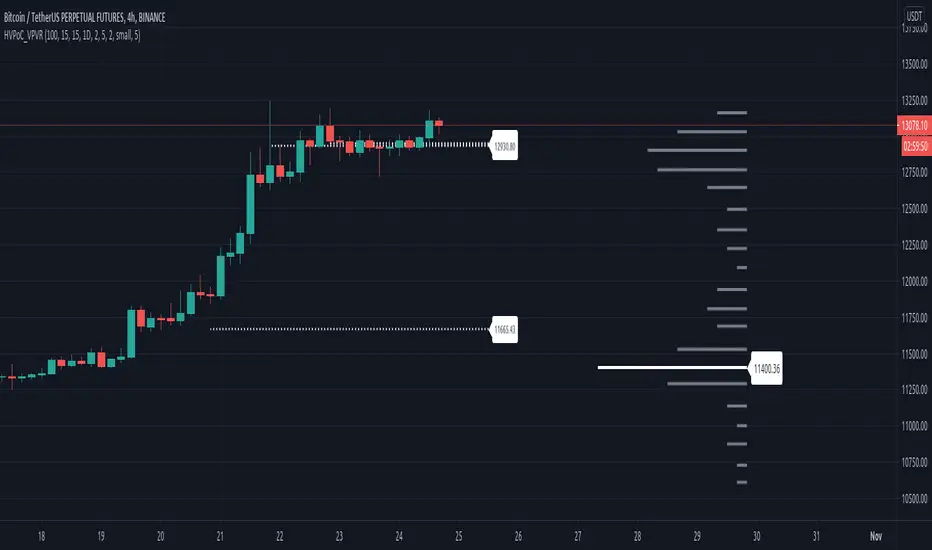
Historic VPoCs and pseudo VPVRThis study tries to recreate session based historic VPoCs
and VPVR Volume Profile
as they are used by
TradingLatino TradingView user.
It's aimed at BTCUSDT pair and 4h timeframe.
HOW IT WORKS
HOW IT WORKS - VPVR Profile Block
It gathers volume from the last chosen Bars
in order to draw the vpvr profile block
Volume that intersects with current level range
being studied is added to its value.
Additionally the current level price is modified
so that it matches the level price where most
of the volume has concentrated
So you get a pretty accurate price for drawn volume
while at the same time the levels are not stuck
to arbitrary level prices.
HOW IT WORKS - VPoC
It calculates a Volume Profile for the
given historic session but then
it only outputs that Volume Profile VPoC.
SETTINGS
Show VPVR Volume Profile {True}.
Show Historic VPoC lines {True}.
Show Historic VPoC labels {True}.
Extend Historic VPoC lines {True}: If this option is turned off the VPoC lines are only shown during the session duration.
Show tick difference from current price {False}: BETA. Feedback is needed because I'm not sure how it should work this setting.
VPVR Number of bars {100}: Define the Visible Range in number of bars so that its Volume Profile can be shown.
VPVR Profile width (in bars) {15}: VPVR Profile can be make larger or smaller in width thanks to this option.
VPVR Profile offset (in bars) {15}: VPVR Profile can be shown more to the left or to the right if the defaults do not suit you.
Historic Session Volume Profile timeframe {1D}: Historic VPoC use 1 day as their timeframe reference by default.
Number of decimal digits {2}: How many decimal digits are shown in label prices.
Number of previous sessions to print VPoC {5}: How many previous sessions VPoCs are to be printed. The maximum for this setting is 20.
Historic VPoC lines width (in pixels) {2}.
Historic VPoC labels size {small}.
History VPoC line offset (in bars) {5}: How far to the right VPoCs lines are to be extended. Note: This setting does not apply when 'Extend Historic VPoC lines' is set to 'False'.
WARNING
Please be aware that VPoC from the first previous session might not be accurate due to Pine Script limitations.
VPVR USAGE
This is not a VPVR like the official TradingView indicator.
This is a pseudo VPVR and that means it needs some manual input from you.
But, don't worry it's quite easy to do and if you always use the same number
of bars to calculate your VPVR then you might even just set it up once.
In order to show the VPVR (or Volume Profile on the Visible Range):
Rescale your chart so that you see all the bars for your Visible Range.
Click on the ruler tool.
Click on the last bar (far to the right) shown on the screen
Drag the ruler to first bar (far to the left) shown on the screen
Check what the ruler says
E.g. it says: 101 bars
Open this study settings
Modify: 'VPVR Number of bars ' setting
So that its value matches your measured number of bars (101)
Press OK to confirm and wait for the indicator to refresh.
STRATEGY USAGE
If your strategy uses VPoC
to define your resistances
or supports
you can check the VPoCs shown here.
FEEDBACK
I have only used this identifier in BTCUSDT 4h timeframe.
I'm interested to know what needs to be tweaked
in other securities and timeframes.
PINE STUDY TRICK
This study let's you choose the number of decimals the label will use.
CREDITS
I have reused and adapted some code from
'Poor man's volume profile' study
which it's from TradingView IldarAkhmetgaleev user.
I also wanted to thank him for helping me understanding his study.
I have reused some code from
'MTF Selection Framework - PineCoders FAQ' study
which it's from TradingView PineCoders user.
Session S/RThis indicator marks the resistances and supports of the post, pre and market sessions of the previous day projecting up to the market of the day, also it marks the hours of these three markets allowing to identify the beginning and end of the sessions in London, Hong Kong, and America.

RVOL - R4RocketRelative volume or RVOL for short is an indicator that is used to measure how 'In Play' the stock is. Simply put, it helps to quantify how interested everybody is in the given stock - higher the value, higher the interest and hence higher is the probability for movement in the stock.
I have tried to create RVOL (Relative Volume ) Indicator as per the description that I read on SMB Capital blog. The blog is a great resource.
...................................................................................................................................................................................
How to use the indicator - The indicator is meant for INTRADAY ONLY.
The indicator has following inputs -
1. RVOL Period - Value from 3 to 14 (Default Value = 4)
This is used to calculate the average volume over the given period of days. e.g. average volume for the last 5 days, last 3 days, last 10 days etc. NOTE - If you use higher RVOL Period on smaller timeframes, the code will give an error. So I recommend using 4 or lower for 5 min timeframe. (Nothing will work on 1 min chart and you can experiment for other timeframes.)
2. RVOL Sectional - True / False (Default Value = False)
If you check this box then you will be able to calculate the RVOL for a particular session (or between particular sessions) in that trading day.
What do I mean by session?
Well I have divided the trading day into 6 (almost) equally spaced sessions in time, i.e. 6 hours and 15 mins (for NSE - India) of trading day is divided into 1 hr - 1st session, 1 hr - 2nd session, 1 hr - 3rd session, 1 hr - 4th session, 1 hr - 5th session, 1 hr and 15 min - 6th session.
Before using 3rd and 4th inputs of indicator, RVOL Sectional box MUST BE CHECKED FIRST.
3. RVOL From Session - 1 to 6 (Default Value = 1)
4. RVOL To Session - 1 to 6 (Default Value = 2)
Now if you select 2 in "RVOL From Session" input and 3 in "RVOL To Session" input, the indicator will calculate RVOL for the 2nd and 3rd hour of the trading day. If you select 3 in both the inputs, then the indicator will give RVOL for the 3rd hour of the trading day.
5. RVOL Trigger - 0.2 to 10 (Default Value = 2)
Filter to find days having RVOL above that value. The indicator turns green (or colour of your choice) when RVOL is more than "RVOL Trigger".
...................................................................................................................................................................................
Hope this indicator will add some value in your trading endeavor.
“Only The Game, Can Teach You The Game” – Jesse Livermore
Yours sincerely,
R4Rocket
**If you have some awesome idea for improvement of the indicator - request you to update the code and share the same.

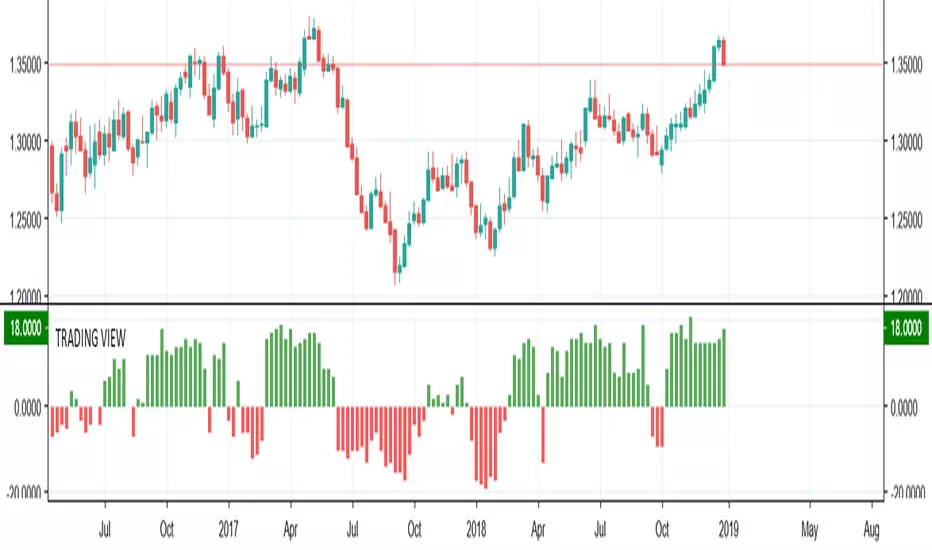
TRADING VIEW INDICATOR - PINE TUTORIAL 5After a long gap, I have written the 5th tutorial for the pine script. You can find the others below, if you read through all of these you should be good to do your own writing.
This script mimics the Trading View Indicator . For example this one below.
www.tradingview.com
It shows the net result of the 28 indicator, either as buy or sell. I have worked hard to make sure it matches the trading view results but I am not in hundred percent agreement with tradingView on SMA, EMA and Ichimoku indicator.
There are many commented plots because I needed to check separately if each indicator is working correctly.
Someone else wrote this code but they did not make it public. It took me about 3 weeks to write this and to be honest it could be cleaner and better commented.
If you find any mistake please let me know. I hope it will be useful in your learning.
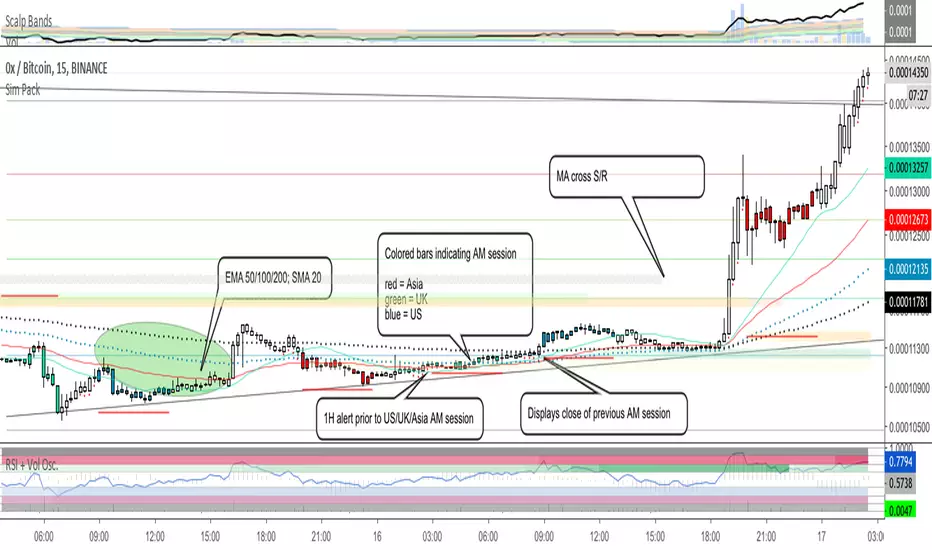
Sim PackThis is a custom indicator that includes the following:
EMA's 50, 100 and 200
SMA 20
Moving average cross support and resistance levels
Colored bars associated with 4-hour AM sessions for Asia, UK, and US
1-hour alerts prior to AM sessions
Plots of previous AM session close during current AM session
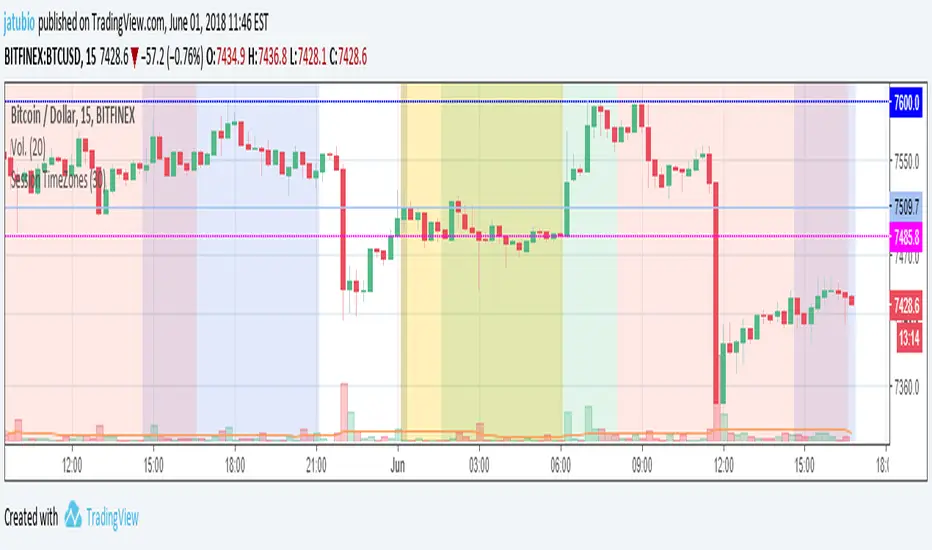
Session TimeZonesThis indicators show background colours to identify world timezones
New York, London, Tokio, China and Sydney sessions
You can also setup timeframe intervals to show or hide.
Time Values based on UTC: ** YOU HAVE TO SETUP YOUR CHARTS TO 0-UTC TIMEZONE **
Values from: en.wikipedia.org
New York: UTC-5
Market Session: 09:30 - 16:00 (Local Time)
Market Session: 14:30 - 21:00 (UTC Based Time)
London: UTC
Market Session: 08:00 - 16:30 (Local Time)
Market Session: 08:00 - 16:30 (UTC Based Time)
Tokyo: UTC+9
Market Session: 09:00 - 15:00 (Local Time)
Market Session: 00:00 - 06:00 (UTC Based Time)
China: UTC+8
Market Session: 09:30 - 16:00 (Local Time)
Market Session: 01:30 - 08:00 (UTC Based Time)
Sydney: UTC+10
Market Session: 10:00 - 16:00 (Local Time)
Market Session: 00:00 - 06:00 (UTC Based Time)
Can be used to know from what time of the world they are traders awake or
to search correlations between big moves and timezones hours.
Thanks to:
www.tradingcode.net
01/06/2018
Crude Roll Trade SimulatorEDIT : The screen cap was unintended with the script publication. The yellow arrow is pointing to a different indicator I wrote. The "Roll Sim" indicator is shown below that one. Yes I could do a different screen cap, but then I'd have to rewrite this and frankly I don't have time. END EDIT
If you have ever wanted to visualize the contango / backwardation pressure of a roll trade, this script will help you approximate it.
I am writing this description in haste so go with me on my rough explanations.
A "roll trade" is one involving futures that are continually rolled over into future months. Popular roll trade instruments are USO (oil futures) and UVXY (volatility futures).
Roll trades suffer hits from contango but get rewarded in periods of backwardation. Use this script to track the contango / backwardation pressure on what you are trading.
That involves identifying and providing both the underlying indexes and derivatives for both the front and back month of the roll trade. What does that mean? Well the defaults simulate (crudely) the UVXY roll trade: The folks at Proshares buy futures that expire 60 days away and then sell those 30 days later as short term futures (again, this is a crude description - see the prospectus) and we simulate that by providing the Roll Sim indicator the symbols VIX and VXV along with VIXY and VIXM. We also provide the days between the purchase and sale of the rolled futures contract (in sessions, which is 22 days by my reckoning).
The script performs ema smoothing and plots both the index lines (VIX and VXV as solid lines in our case) and the derivatives (VIXY and VIXM as dotted lines in our case) with the line graphs offset by the number of sessions between the buy and sell. The gap you see represents the contango / backwardation the derivative roll trades are experiencing and gives you an idea how much movement has to happen for that gap to widen, contract or even invert. The background gets painted red in periods of backwardation (when the longer term futures cost less than when sold as short term futures).
Fortunately indexes are calibrated to the same underlying factors, so their values relative to each other are meaningful (ie VXV of 18 and VIX of 15 are based on the same calculation on premiums for S&P500 symbols, with VXV being normally higher for time value). That means the indexes graph well without and adjustments needed. Unfortunately derivatives suffer contango / backwardation at different rates so the value of VIXY vs VIXM isn't really meaningful (VIXY may take a reverse split one year while VIXM doesn't) ... what is meaningful is their relative change in value day to day. So I have included a "front month multiplier" which can be used to get the front month line "moved up or down" on the screen so it can be compared to the back month.
As a practical matter, I have come to hide the lines for the derivatives (like VIXY and VIXM) and just focus on the gap changes between the indexes which gives me an idea of what is going on in the market and what contango/backwardation pressure is likely to exist next week.
Hope it is useful to you.

forex session - Opening-Range- JayyMy first try on anything forex. Let me know if it needs adjustment.
This is Opening Range for forex
Targets set at 127% , 162%, 200 %, 262 %, 362%, 423%, 685%, 1109% and 1794%
of the selected opening range. You can adjust targets as you like in the dialogue box
362%, 423%, 685%, 1109% and 1794% levels will not show unless selected in the dialogue box.
Check any one (only one) of the time periods to change the opening range period to suit.
New York opens at 8:00 am to 5:00 pm EST (EDT)
Tokyo opens at 7:00 pm to 4:00 am EST (EDT)
Sydney opens at 5:00 pm to 2:00 am EST (EDT)
London opens at 3:00 am to 12:00 noon EST (EDT)
Because the actual forex day starts at 5pm it is not possible to plot some time periods correctly
ie try 120 minutes on the New York session. (Although this is not a problem with the other sessions)
If you keep to an hour or less and use periods that divide evenly into an hour all will be fine. All periods will actually work but will start looking a little funny.
No such problem occurs if you just use 5pm est to 5 pm est. other sessions could be put in as options or hard wired in with a few lines of script changes
There is an option in the dialogue box to display fib targets within Opening Range itself.
In the far past I adapted some original work created by Chris Moody from a 7-07-2014 script - there have been multiple adaptations . The script layout/ structure remains similar and messages regarding targets achieved (lines 224 - 230) are from the original script. In the original Chris gave Special Thanks To "The Coding Genius Behind The Curtain" - so hat tip to both.

Pivot Points Detector - ATR basedThis pivot points detector is a precision-tuned momentum and structural pivot detector designed specifically for high-frequency scalpers (like those trading ES or NQ on the 15-second timeframe).
By combining dynamic volatility filters with structural displacement requirements, it isolates high-conviction reversal points while filtering out the "noise" of lower-timeframe chop.
How It Works
This indicator utilizes a three-gate logic system to ensure that only the most significant market turns are highlighted:
Gate 1: The ATR Momentum Break
The system monitors an ATR (12 / 2.0) trailing stop. A potential pivot is only identified when the price successfully closes across this volatility line, proving that immediate momentum has shifted.
Gate 2: Absolute Structural Anchor
Once a trend change is triggered, the indicator performs a 60-bar retrospective scan (approximately 15 minutes of data) to identify the absolute Highest High or Lowest Low that initiated the move. This pins the marker to the "Source" of the trend rather than the signal bar itself.
Gate 3: The Persistence Proof (Faded vs. Solid)
To prevent "fake outs," the indicator uses a unique faded logic:
Faded Triangle: Appears instantly at the pivot source as a "potential" setup.
12-Tick Run: The triangle only turns Solid if the price travels 12 ticks from that absolute pivot without crossing back over the ATR trail.
Auto-Deletion: If the momentum fails and the ATR trail is breached before the 12-tick target is hit, the faded triangle is automatically wiped from the chart.
Key Features
Clean Visuals: Triangles are printed with a 2-tick offset from the candle wicks for maximum readability.
Label Memory Management: The script maintains a history of the last 200 triangles, ensuring performance stability during long trading sessions.
Fully Customizable: Users can adjust the ATR multiplier, the structural lookback window, the tick-confirmation target, and all visual colors directly from the settings menu.
Trend-Change Focus: Unlike standard Zig-Zags that repainting or mark every wiggle, this tool only prints a marker when a formal ATR trend flip occurs.
Best Use Case: This tool is built for the scalper who needs a reliable "Hard Level" for stop-loss management and re-entry identification. When a triangle turns Solid, it represents a verified structural floor or ceiling that has shown displacement strength.

Adaptive ML VWAP v1.0Overview
Adaptive ML VWAP is a next-generation "Smart Indicator" that moves beyond static deviations (Standard Deviation). Instead of assuming market volatility is distributed normally (Bell Curve), this indicator uses a k-Nearest Neighbors (k-NN) machine learning engine to learn the specific volatility behavior of the asset you are trading.
It answers the question: "When price extends away from VWAP, how far does it actually go before reversing?"
The Adaptive ML Engine
This script features a 5-Dimensional ML Engine that tracks every major extension or pullback event. It records:
Deviation Depth (Normalized to ATR)
Trend Slope (Is the trend steep or flat?)
ADX (Trend Strength)
VWAP Deviation (Relative Position)
Time of Day (Session Context)
When a new setup occurs, the k-NN engine instantly searches its memory for the 5 most similar historical events and calculates the probability of success based on what happened last time.
Two Strategy Modes
You can toggle the logic to suit your trading style:
1. Mean Reversion Mode (Default)
"Fade The Move"
Goal: Catch price at an exhaustion point returning to VWAP.
Signal: Triggers when price touches a Smart Band and reverses back toward the center.
k-NN Learning: Learns which conditions favor a snap-back.
Best For: Ranging markets, Lunch hours, Choppy sessions.
2. Trend Following Mode
"Ride The Move"
Goal: Catch breakouts that are launching away from value.
Signal: Triggers when price breaks out of the Inner Band (1.0).
k-NN Learning: Learns which breakouts tend to extend to the Outer Bands.
Best For: Morning Drives, News Events, Strong Trends.
Visual Guide
The indicator uses a Dynamic Gradient system to visualize risk/reward:
Cyan Mist (0.5 - 1.0): The Value Zone. Noise area. Safe for trend entries.
Deep Cyan (1.0 - 2.0): The Trend Zone. Price is moving proactively.
Orange Glow (2.0 - 3.0): The Danger Zone. Price is statistically overextended. Reversals are highly probable here.
"Fractal" Math
Unlike standard indicators that break when you change timeframes, Adaptive ML VWAP uses Fractal Normalization.
A "2.0 Band" on a 15-second chart means the same statistical extreme as a "2.0 Band" on a 4-hour chart.
Auto-Adaptive Lookback: The indicator automatically boosts the ML memory (Lookback) on lower timeframes (seconds/minutes) where more noise requires larger sample sizes, ensuring robust predictions without manual tweaking.
Settings
Auto-Adapting Lookback: (Default: True) automatically increases Lookback to 100+ for seconds charts and 50+ for minute charts.
Lookback (Events): Manual override base value (Default: 100).
Strategy Mode: Toggle between Mean Reversion and Trend Following.
k-Neighbors: The number of similar past events to structurally compare (Default: 5).
Disclaimer: This tool is for educational purposes. Machine learning performance is dependent on market conditions and historical recursion.

Multi-Session Volume Profile [MarkitTick]💡 This comprehensive Multi-Session Volume Profile indicator offers a sophisticated, array-based approach to Auction Market Theory. By simultaneously processing Daily, Weekly, Monthly, and Custom Session profiles, it empowers traders to visualize the migration of value across multiple timeframes without the performance overhead of standard heavy profile scripts. It is designed to identify key liquidity nodes, support/resistance zones defined by volume, and the directional bias of the market through Point of Control (POC) shifts.
✨ Originality and Utility
● Multi-Dimensional Value Analysis
Unlike standard volume profiles that often restrict users to a single timeframe or require multiple instances of an indicator, this script consolidates four distinct profile calculations into a single, efficient tool. It leverages Pine Script® arrays and custom types (`VPSlot`, `VolumeProfile`) to dynamically calculate volume distribution, ensuring minimal lag while maintaining high data granularity.
● Dynamic POC Shift Tracking
A standout feature of this utility is the "Shift Analysis." The indicator does not merely plot the current Point of Control; it calculates the delta between the current session's POC and the previous session's POC. This provides immediate visual feedback on "Value Migration"—whether the market is accepting higher prices (Bullish Shift) or lower prices (Bearish Shift).
● Granular Control via Custom Types
The script utilizes a custom quantitative structure (`type VolumeProfile`) to manage raw volume, highs, lows, and volatility slots independently for each timeframe. This allows for precise "row" calculations, ensuring that the volume distribution accurately reflects price action within the specific session, rather than broad approximations.
🔬 Methodology and Concepts
● Array-Based Bucketing
The core engine relies on a "Row Size" input to divide the session's price range into horizontal buckets (slots). As new price bars form, the script distributes the bar's volume across these slots. If a bar spans multiple slots, volume is distributed proportionally; if a bar is contained within a single slot, the total volume accumulates there. This mimics a true TPO (Time Price Opportunity) calculation using volume as the weight.
● Statistical Value Area Calculation
The Value Area (VA) is determined using a standard deviation proxy. The script identifies the POC (the slot with the highest accumulated volume) and then iteratively adds the next highest volume slots above or below the POC until the total accumulated volume reaches the user-defined percentage (default 70%).
● Session Logic and Reset
The indicator employs state-logic variables (`isNewDay`, `isNewWeek`, `isNewMonth`) to detect session boundaries. Upon a boundary cross, the `reset()` method clears the arrays and initializes a new profile, while the `draw()` method finalizes the visualization of the completed session. This ensures that the lines on the chart always represent the developing or completed structure of the specific time period.
🎨 Visual Guide
The indicator renders up to four distinct profiles, each color-coded for rapid identification.
● Daily Profile (Default: Yellow)
Solid Yellow Line: Represents the Daily POC (Point of Control)—the price level with the most volume traded today.
Dashed/Dotted Yellow Lines: Represent the Value Area High (VAH) and Value Area Low (VAL).
Yellow Background Box: Highlights the 70% Value Area, showing where the bulk of the day's trading occurred.
● Weekly Profile (Default: Blue)
Solid Blue Line: The Weekly POC. Use this to gauge the medium-term trend direction.
Blue Background: Encapsulates the weekly value area. A breakout from this zone often signals a significant trend continuation.
● Monthly Profile (Default: Purple)
Solid Purple Line: The Monthly POC. This is a high-timeframe magnet level, often acting as major support or resistance.
Purple Background: Shows the macro acceptance zone for the asset.
● Custom Session Profile (Default: Cyan)
Solid Cyan Line: Tracks the POC for a specific time window (e.g., 09:30-16:00). Ideal for isolating RTH (Regular Trading Hours) from electronic sessions.
● Labels and Shift Arrows
Right-Side Labels: Display the exact price of the POC for each active profile.
Shift Indicators (▲ / ▼): Located inside the label. A "▲" indicates the current POC is higher than the previous session's POC (Value Migration Up), while "▼" indicates the opposite.
📖 How to Use
● Trend Confirmation via Value Migration
Observe the Shift Arrows in the labels. If the Daily and Weekly profiles both show "▲" (Up Shift), it confirms that value is migrating higher, suggesting a healthy uptrend. Do not short the market when value is migrating up unless price breaks below the VAL.
● Mean Reversion Trades
When price extends far away from the POC but fails to establish value (volume) at those new levels, it often reverts back to the POC. Use the POC lines as profit targets for mean reversion strategies.
● Breakout Validation
A breakout is considered valid if price closes outside the Value Area (Background Box) and volume begins to build at the new levels. If price spikes out of the VAH but quickly returns inside the box, it is a "Failed Auction," and a rotation to the VAL is probable.
● Confluence Zones
Look for price levels where the Daily POC and Weekly VAL/VAH overlap. These "clusters" of volume act as reinforced support or resistance levels.
⚙️ Inputs and Settings
● General Settings
Row Size: Determines the resolution of the profile. Higher numbers (e.g., 100) give smoother, more precise profiles but use more resources. Lower numbers (e.g., 24) are blockier but faster.
Value Area %: The percentage of total volume to include in the VA. Standard is 70.0.
Show POC Shift Analysis: Toggles the display of the ▲/▼ drift comparison.
● Profile Toggles (Daily, Weekly, Monthly, Session)
Each section has individual toggles for Show Profile , Show Value Area , and Show Background .
Start of Week Day: Allows you to define when the weekly profile resets (e.g., Sunday or Monday).
● Alert Settings
Approach Distance (Ticks): Defines how close price must get to a POC/VAH/VAL level to trigger an "Approaching" alert.
Enable Alerts: Master switch to turn on internal alert condition checks.
🔍 Deconstruction of the Underlying Scientific and Academic Framework
● Auction Market Theory (AMT)
The script is grounded in Auction Market Theory, which posits that the market's primary purpose is to facilitate trade. Price advertises opportunity, and Volume records the acceptance of that opportunity. The "Value Area" represents the fair value established by buyers and sellers, while the POC represents the price of maximum consensus.
● Gaussian Distribution Application
The calculation of the Value Area at 70% is derived from the statistical properties of a Normal (Gaussian) Distribution, where approximately 68.2% of data points typically fall within one standard deviation of the mean. In this script, the POC acts as the mode (peak frequency), and the Value Area represents that first standard deviation of transactional volume.
● Volume-Price Integration
By integrating volume into price buckets (`VPSlot`), the indicator transforms two-dimensional time/price data into three-dimensional data (Time, Price, Volume). This reveals the "texture" of the market structure, distinguishing between high-volume nodes (strong acceptance) and low-volume nodes (rejection or emotional trading).
⚠️ Disclaimer
All provided scripts and indicators are strictly for educational exploration and must not be interpreted as financial advice or a recommendation to execute trades. I expressly disclaim all liability for any financial losses or damages that may result, directly or indirectly, from the reliance on or application of these tools. Market participation carries inherent risk where past performance never guarantees future returns, leaving all investment decisions and due diligence solely at your own discretion.

Fractal - VA (Dynamic Wicks)This indicator, which we’ve developed as the Frectal - VA (Multi-Timeframe Visual Analytics), is designed for traders who utilize multi-timeframe analysis but want to keep their main chart clean of overlapping candles.
It functions as a Projected Dashboard, pulling price action from a higher timeframe (HTF) and rendering it as a set of dynamic, solid objects in the right-hand margin of your chart.
Core Philosophy
The "Frectal - VA" is built on the principle of Nested Structure. In professional trading, the "Value Area" or the "Fractal" of a higher timeframe often dictates the trend of the lower timeframe. By projecting these candles into the future (the right side of the chart), you can monitor HTF trend shifts, volatility, and candle closes without the HTF candles obscuring your current "live" price action.
Key Components
Decoupled Visualization: Unlike standard MTF indicators that overlay large boxes behind your current bars, this indicator creates a side-by-side comparison in the chart's whitespace.
Real-Time Data Streaming: It doesn't just show historical candles; the "lead" candle in the dashboard updates with every tick of the current price, showing you exactly how the higher timeframe candle is forming.
Dynamic Color Sync: The body, border, and wick of each projected candle are linked. If a 1-hour candle flips from bullish to bearish on a 5-minute chart, the entire dashboard object changes color instantly.
Customizable Offset: You control the "Drop" (Vertical Offset) and the "Margin" (Horizontal Offset). This allows you to tuck the indicator into a corner of your screen as a heads-up display (HUD).
Strategic Use Cases
Trend Confirmation: If you are trading a 1-minute "scalp" but the 15-minute dashboard shows a solid, large-bodied bearish candle, you are alerted to trade with the HTF momentum.
Volatility Monitoring: By observing the size of the wicks in the dashboard, you can see if the higher timeframe is experiencing "rejection" at certain levels, even if your local timeframe looks like a steady trend.
Visual Backtesting: Because it maintains a queue of the last
X
candles, you can see the immediate history of the HTF structure (e.g., a "Morning Star" pattern or "Engulfing" candles) at a glance.
Technical Specifications
Pine Script Version: v6 (latest standard).
Drawing Engine: Uses box and line arrays for high-performance rendering that doesn't lag the UI.
Memory Management: Automatically deletes old objects to stay within TradingView’s script limits, ensuring stability during long trading sessions.

Apex Wallet - Real-Time Market Volume Delta & Order FlowOverview The Apex Wallet Market Volume Delta is a professional liquidity analysis tool designed to decode the internal structure of market volume. Unlike standard volume bars, this script calculates the "Delta"—the net difference between buying and selling pressure—to reveal the true conviction of market participants in real-time.
Dynamic Multi-Mode Intelligence This indicator features an adaptive calculation engine that recalibrates its internal logic based on your trading style:
Scalping: Fast-response settings (9-period MA) for immediate execution on low timeframes.
Day-Trading: Balanced settings (26-period MA) optimized for intraday sessions.
Swing-Trading: High-filter settings (52-period MA) for major trend confirmation.
Advanced Order Flow Detection
Real-Time Delta Calculation: Tracks the precise interaction between price and volume to identify aggressive buyers vs. passive sellers.
Dual Calculation Modes: Choose between "Buy/Sell" (aggressive) or "Buy/Sell/Neutral" for a more granular view of flat market periods.
Visual Delta Labels: Displays the net volume values directly above each bar, with color-coded alerts (Green for Bullish Delta, Red for Bearish Delta).
Scalable UI: Features a "Scale Down Factor" to simplify large volume numbers into readable units (10/100/1k/10k).
Key Features:
Visual Split: Clearly differentiates historical volume from real-time buying and selling flows.
Trend Confirmation: Integrated optional EMA to compare current volume surges against the average market liquidity.
Clean Interface: Professional-grade histogram styling with clear demarcation of session activity.

Apex Wallet - Adaptive Average Directional Index (ADX) & Trend DOverview The Apex Wallet Average Directional Index (ADX) is an enhanced version of the classic Wilder’s DMI/ADX system, designed to filter market noise and pinpoint trend strength with precision. Unlike standard indicators, this script features an adaptive engine that recalibrates its internal logic based on your specific trading style.
Adaptive Trading Engine The core strength of this script is its three-mode preset system:
Scalping: Fast-response settings (ADX 7) for quick scalp opportunities on low timeframes.
Day-Trading: Balanced settings (ADX 14) optimized for intraday sessions.
Swing-Trading: High-filter settings (ADX 21) designed to capture major market waves.
Visual Intelligence & Labels To ensure clarity, the script features a dynamic labeling system directly on the ADX line:
Trend Strength Zones: Clear horizontal markers for "Consolidation," "Trending," and "Extremely Strong" phases.
Real-time Status Labels: The ADX line changes color and displays its current state (Bullish, Bearish, or Consolidation) directly on the chart.
Optimized UI: No sidebar panels to clutter your view; all essential information is integrated into the oscillator window.
How to Use:
Select your Trading Mode in the settings.
Monitor the ADX color: Green indicates a strong bullish trend, Red indicates a strong bearish trend, and White/Orange signals consolidation.
Use the labels to confirm if the market is currently in a high-conviction trend phase or sideways range.
