RCV Essentials════════════════════════════════════════════
RCV ESSENTIALS - MULTI-TIMEFRAME & SESSION ANALYSIS TOOL
════════════════════════════════════════════
📊 WHAT THIS INDICATOR DOES
This professional-grade indicator combines two powerful analysis modules:
1. TRADING SESSION TRACKER - Visualizes high/low ranges for major global market sessions (NY Open, London Open, Asian Session, etc.)
2. MULTI-TIMEFRAME CANDLE DISPLAY - Shows up to 8 higher timeframes simultaneously on your chart (15m, 30m, 1H, 4H, 1D, 1W, 1M, 3M)
════════════════════════════════════════════
🎯 KEY FEATURES
════════════════════════════════════════════
TRADING SESSIONS MODULE:
✓ Track up to 6 custom trading sessions simultaneously
✓ Real-time high/low range detection during active sessions
✓ Pre-configured for NYO (7-9am), LNO (2-3am), Asian Session (4:30pm-12am)
✓ 60+ global timezone options
✓ Customizable colors, labels, and transparency
✓ Daily divider lines (optional Sunday skip for traditional markets)
✓ Only displays on ≤30m timeframes for optimal clarity
MULTI-TIMEFRAME CANDLES MODULE:
✓ Display 1-8 higher timeframes with up to 10 candles each
✓ Real-time candle updates (non-repainting)
✓ Fully customizable colors (separate bullish/bearish for body/border/wick)
✓ Adjustable candle width, spacing, and positioning
✓ Smart label system (top/bottom/both, aligned or follow candles)
✓ Automatic timeframe validation (only shows TFs higher than chart)
✓ Memory-optimized with automatic cleanup
════════════════════════════════════════════
🔧 HOW IT WORKS
════════════════════════════════════════════
TECHNICAL IMPLEMENTATION:
Session Tracking Algorithm:
• Detects session start/end using time() function with timezone support
• Continuously monitors and updates high/low during active session
• Finalizes range when session ends using var persistence
• Draws boxes using real-time bar_index positioning
• Maintains session ranges across multiple days for reference
Multi-Timeframe System:
• Uses ta.change(time()) detection to identify new MTF candle formation
• Constructs candles using custom Type definitions (Candle, CandleSet, Config)
• Stores OHLC data in arrays with automatic size management
• Renders using box objects (bodies) and line objects (wicks)
• Updates current candle every tick; historical candles remain static
• Calculates dynamic positioning based on user settings (offset, spacing, width)
Object-Oriented Architecture:
• Custom Type "Candle" - Stores OHLC values, timestamps, visual elements
• Custom Type "CandleSet" - Manages arrays of candles + settings per timeframe
• Custom Type "Config" - Centralizes all display configuration
• Efficient memory management via unshift() for new candles, pop() for old
Performance Optimizations:
• var declarations minimize recalculation overhead
• Conditional execution (sessions only on short timeframes)
• Maximum display limits prevent excessive object creation
• Timeframe validation at barstate.isfirst reduces redundant checks
════════════════════════════════════════════
📈 HOW TO USE
════════════════════════════════════════════
SETUP:
1. Add indicator to chart (works best on 1m-30m timeframes)
2. Open Settings → "Trading Sessions" group
- Enable desired sessions (NYO, LNO, AS, or custom)
- Select your timezone from 60+ options
- Adjust colors and transparency
3. Open Settings → "Multi-TF Candles" group
- Enable timeframes (TF1-TF8)
- Configure each timeframe and display count
- Customize colors and layout
READING THE CHART:
• Session boxes show high/low ranges during active sessions
• MTF candles display to the right of current price
• Labels identify each timeframe (15m, 1H, 4H, etc.)
• Real-time updates on the most recent MTF candle
TRADING APPLICATIONS:
Session Breakout Strategy:
→ Identify session high/low (e.g., Asian session 16:30-00:00)
→ Wait for break above/below range
→ Confirm with higher timeframe candle close
→ Enter in breakout direction, stop at opposite side of range
Multi-Timeframe Confirmation:
→ Spot setup on primary chart (e.g., 5m)
→ Verify 15m, 1H, 4H candles align with trade direction
→ Only take trades where higher TFs confirm
→ Exit when higher TF candles show reversal
Combined Session + MTF:
→ Asian session establishes range overnight
→ London Open breaks Asian high
→ Confirm with bullish 15m + 1H candles
→ Enter long with stop below Asian high
════════════════════════════════════════════
🎨 ORIGINALITY & INNOVATION
════════════════════════════════════════════
What makes this indicator original:
1. INTEGRATED DUAL-MODULE DESIGN
Unlike separate session or MTF indicators, this combines both in a single performance-optimized script, enabling powerful correlation analysis between session behavior and timeframe structure.
2. ADVANCED RENDERING SYSTEM
Uses custom Pine Script v5 Types with dynamic box/line object management instead of basic plot functions. This enables:
• Precise visual control over positioning and spacing
• Real-time updates without repainting
• Efficient memory handling via automatic cleanup
• Support for 8 simultaneous timeframes with independent settings
3. INTELLIGENT SESSION TRACKING
The algorithm continuously recalculates ranges bar-by-bar during active sessions, then preserves the final range. This differs from static zone indicators that simply draw fixed boxes at predefined levels.
4. MODULAR ARCHITECTURE
Custom Type definitions (Candle, CandleSet, Config) create extensible, maintainable code structure while supporting complex multi-timeframe operations with minimal performance impact.
5. PROFESSIONAL FLEXIBILITY
Extensive customization: 6 configurable sessions, 8 timeframe slots, 60+ timezones, granular color/sizing/spacing controls, multiple label positioning modes—adaptable to any market or trading style.
6. SMART VISUAL DESIGN
Automatic timeframe validation, dynamic label alignment options, and intelligent spacing calculations ensure clarity even with multiple timeframes displayed simultaneously.
════════════════════════════════════════════
⚙️ CONFIGURATION OPTIONS
════════════════════════════════════════════
TRADING SESSIONS:
• Session 1-6: On/Off toggles
• Time Ranges: Custom start-end times
• Labels: Custom text for each session
• Colors: Individual color per session
• Timezone: 60+ options (Americas, Europe, Asia, Pacific, Africa)
• Range Transparency: 0-100%
• Outline: Optional border
• Label Display: Show/hide session names
• Daily Divider: Dotted lines at day changes
• Skip Sunday: For traditional markets vs 24/7 crypto
MULTI-TF CANDLES:
• Timeframes 1-8: Enable/disable individually
• Timeframe Selection: Any TF (seconds to months)
• Display Count: 1-10 candles per timeframe
• Bullish Colors: Body/Border/Wick (independent)
• Bearish Colors: Body/Border/Wick (independent)
• Candle Width: 1-10+ bars
• Right Margin: 0-200+ bars from edge
• TF Spacing: Gap between timeframe groups
• Label Color: Any color
• Label Size: Tiny/Small/Normal/Large/Huge
• Label Position: Top/Bottom/Both
• Label Alignment: Follow Candles or Align
════════════════════════════════════════════
📋 TECHNICAL SPECIFICATIONS
════════════════════════════════════════════
• Pine Script Version: v5
• Chart Overlay: True
• Max Boxes: 500
• Max Lines: 500
• Max Labels: 500
• Max Bars Back: 5000
• Update Frequency: Real-time (every tick)
• Timeframe Compatibility: Chart TF must be lower than selected MTFs
• Session Display: Activates only on ≤30 minute timeframes
• Memory Management: Automatic cleanup via array operations
Cari dalam skrip untuk "sessions"

Last 10 Sessions: High, Low, Pivot, GapLast 10 Sessions: High, Low, Pivot, Gap
This indicator highlights the most important price levels from the last 10 completed trading sessions to help intraday and swing traders quickly spot potential support, resistance, and price reaction zones.
Key Features:
Previous Highs and Lows : Visualize the high and low from each of the past 10 sessions. These are the most commonly tested breakout and reversal points for day trading.
Session Pivots: The classic pivot formula ((High + Low + Close) / 3) for each of the last 10 sessions, often acting as a market “equilibrium” or intraday magnet.
Gaps: Displays the difference between each day’s open and the previous session’s close (“gap”), showing sentiment shifts and possible gap fill targets.
Clean, Faded Visuals: All lines and labels are subtly faded so your chart remains clear and uncluttered, with each level labeled by how many sessions ago it occurred.
Full Customization: Instantly toggle any level type (High, Low, Pivot, Gap) ON/OFF in settings, extend lines to the right, and adjust their forward length.
Bulletproof Logic: Never throws runtime errors. Lines and labels only display when valid data is present.
How to Use:
Use recent highs/lows for breakout, breakdown, or mean reversion trades.
Spot where multiple levels from past sessions cluster together for high-probability reversal or breakout areas.
Watch pivots for intraday bias, and gaps for sentiment and possible fill plays.
Perfect for all intraday timeframes.
If you want a powerful yet minimal map of where price is most likely to react, this indicator is for you!
Developed by

Trading Sessions with Highs and LowsTrading Sessions with Highs and Lows is designed to visually highlight specific trading sessions on the chart, providing traders with key insights into market behavior during these time periods. Here’s a detailed explanation of how the indicator works:
Key Features
1. Session Boxes:
• The indicator plots colored boxes on the chart to represent the price range of defined trading sessions.
• Each box spans the session’s start and end times and encapsulates the high and low prices during that period.
• Two trading sessions are defined by default:
• USA Trading Session: 9:30 AM - 4:00 PM (New York Time).
• UK Trading Session: 8:00 AM - 4:30 PM (London Time).
2. Session Labels:
• The name of the session (e.g., “USA” or “UK”) is displayed above the session box for clear identification.
3. High and Low Markers:
• Markers are added to the chart at the session’s high and low points:
• High Marker: A green label indicating the session high.
• Low Marker: A red label indicating the session low.
4. Dynamic Reset:
• After the session ends, the session high and low values are reset to na to prepare for the next trading day.
5. Customizable Background Colors:
• Each session’s box has a distinct, semi-transparent background color for better visual separation.
How It Works
1. Core Functionality:
• A function, plot_box, takes the session name, start time, end time, and background color as input.
• It calculates whether the current time is within the session.
• During the session:
• It tracks the session’s highest and lowest prices.
• It identifies the bars where the high and low occurred.
• At the session’s end:
• It plots a box on the chart covering the session’s time and price range.
• Labels are created for the session name and its high/low points.
2. Session Timing:
• Timestamps for the USA and UK trading sessions are calculated using the timestamp function with respective time zones.
3. Visual Elements:
• The box.new function draws the session boxes on the chart.
• The label.new function creates session name and high/low labels.
Usage
• Overlay Mode: The indicator is applied directly on the price chart (overlay=true), making it easy to visualize session-specific price behavior.
• Trading Strategy:
• Identify session-specific support and resistance levels.
• Observe price action trends during key trading periods.
• Align trading decisions with session dynamics.
Customization
While the indicator is preset for the USA and UK trading sessions, it can be easily modified:
1. Add/Remove Sessions: Define additional sessions by providing their start and end times.
2. Change Colors: Update the background_color in the plot_box calls to use different colors for sessions.
3. Adjust Time Zones: Replace the current time zones with others relevant to your trading style.
Visualization Example
• USA Session:
• Time: 9:30 AM - 4:00 PM (New York Time).
• Box Color: Semi-transparent orange.
• UK Session:
• Time: 8:00 AM - 4:30 PM (London Time).
• Box Color: Semi-transparent green.
Why Use This Indicator?
1. Market Awareness: Easily spot price behavior during high-liquidity trading periods.
2. Trend Analysis: Analyze how sessions overlap or affect each other.
3. Session Boundaries: Use session high/low levels as dynamic support and resistance zones.
This indicator is an essential tool for intraday and swing traders who want to align their strategies with key market timings.

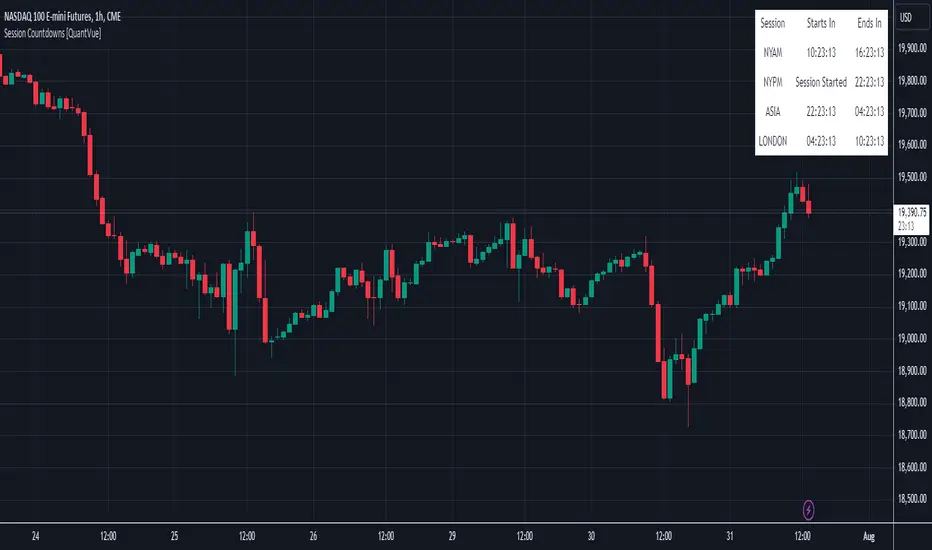
Session Countdowns [QuantVue]The Session Countdowns indicator is a powerful tool designed for traders who want to keep track of multiple trading sessions throughout the day. This indicator allows users to customize and monitor up to four different trading sessions with real-time countdowns until the session starts and ends.
Customizable Sessions:
Define up to four trading sessions with specific start and end times.
Customize session names for easy identification (e.g., NYAM, NYPM, ASIA, LONDON).
Real-Time Countdown:
Displays countdown timers for each session, showing time remaining until the session starts and ends.
Real-time updates ensure accurate and timely information.
Display Options:
Choose the display position on the chart (Top, Middle, Bottom) and alignment (Left, Center, Right).
Select table size.
Dynamic color theme adjusts the text and background colors based on the session status (upcoming, active, ending soon).
Alerts:
Receive alerts 30 minutes before a session starts, ensuring you never miss a crucial trading period.
Alerts can be customized for each session, providing timely reminders.
Give this indicator a BOOST and COMMENT your thoughts below!
We hope you enjoy.
Cheers!
Forex Session Tracker [MacroGlide]Forex Session Tracker is a tool designed to track and visualize trading activity across the four key Forex market sessions: New York, London, Tokyo, and Sydney. The indicator helps traders see the time intervals of each session, their impact on price movements, and analyze volatility within these sessions.
Key Features:
• Session Visualization: The indicator highlights price ranges during the New York, London, Tokyo, and Sydney sessions using different colors, making data easier to visually interpret and analyze. Users can customize the color scheme for each session.
• Price Change Analysis: The indicator tracks the opening prices of each session and calculates the price changes by the session's close. This allows traders to assess market dynamics within each session and make informed trading decisions.
• Average Price Changes: The average price change for a specified number of sessions is calculated for each session, helping to identify trends and volatility levels.
• Time Zone Support: The indicator takes into account time zones, allowing users to adjust the display according to their location or use the market's time zone.
• Interactive Dashboard: The built-in dashboard shows the status of each session in real-time (active or inactive), recent price changes, and average changes, providing quick access to key information directly on the chart.
How to Use:
• Add the indicator to your chart and configure the displayed sessions according to your needs.
• Use color differentiation to easily identify active trading sessions and assess their impact on price movements.
• Monitor price changes in each session and analyze averages for a deeper understanding of market trends.
Methodology:
The indicator uses the time intervals of each trading session to calculate and display opening prices, price ranges, and price changes for the session. Based on this data, the Forex Session Tracker visualizes the session's high and low prices and calculates the average price change over the last several sessions. All data is displayed in real-time, considering the user's time zone settings or the market's time zone.
Originality and Usefulness:
Forex Session Tracker stands out for its ability to combine price change information from several key trading sessions into one indicator, providing traders with a simple and clear way to analyze market activity across different time zones.
Charts:
The indicator displays clean and clear charts, where each trading session is highlighted with its own color, making visual interpretation easier. The charts focus only on essential information for analysis: opening prices, session ranges, and price changes. The integrated dashboard provides quick access to key session metrics, such as activity status, recent price changes, and average values for the selected period. These features make the charts highly useful for rapid analysis and trading decision-making.
Enjoy the game!

Session Status Table📌 Session Status Table
Session Status Table is an indicator that displays the real-time status of the four major trading sessions:
* 🇯🇵 Asia (Tokyo)
* 🇬🇧 London
* 🇺🇸 New York AM
* 🇺🇸 New York PM
It shows which sessions are currently open, how much time remains until they open or close, and optionally sends alerts in advance.
🧩 Features:
* Real-time session table — shows the status of each session on the chart.
* Color-coded statuses:
* 🟢 Green – Session is open
* 🔴 Red – Session is closed
* ⚪ Gray – Weekend
* Countdown timers until session open or close.
* User alerts — receive a notification a custom number of minutes before a session starts.
⚙️ Customization:
* Table position — fully configurable.
* Session colors — customizable for open, closed, and weekend states.
* Session labels — customizable with icons.
* Notifications:
* Enabled through TradingView's Alerts panel.
* User-defined lead time before session opens.
🕒 Time Zones:
All times are calculated in UTC to ensure consistency across different markets and regions, avoiding discrepancies from time zones and daylight saving time.
🚨 How to enable alerts:
1. Open the "Alerts" panel in TradingView.
2. Click "Create Alert".
3. In the condition dropdown, choose "Session Status Table".
4. Set to any alert() trigger.
5. Save — you'll be notified a set number of minutes before each session begins.
ℹ️ Technical Notes:
* Built with Pine Script version 6.
* Logically divided into clear sections: inputs, session calculations, table rendering, and alerts.
* Optimized for performance and reliability on all timeframes.
Ideal for traders who use session activity in their strategies — especially in Forex, crypto, and futures markets.

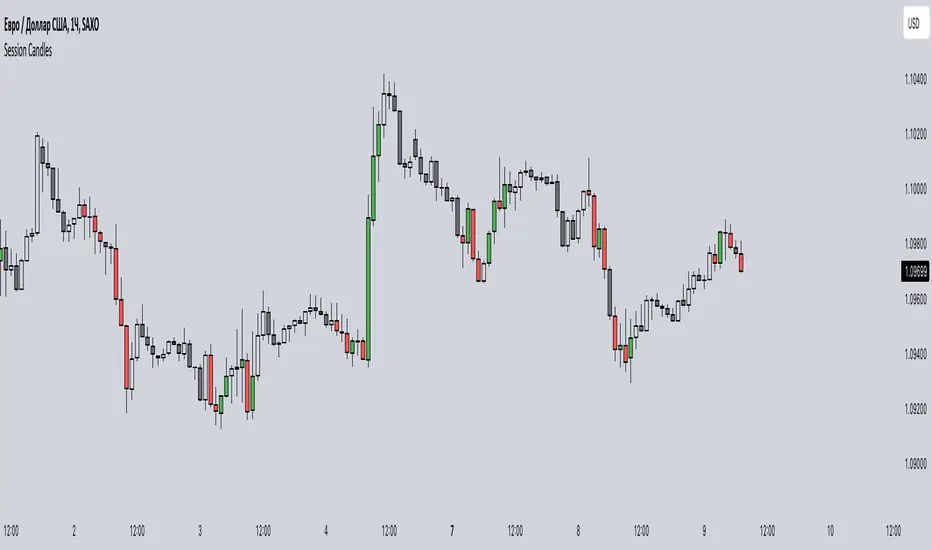
Session CandlesThis indicator is designed to visually represent different trading sessions on a price chart, highlighting candlestick colors to distinguish between bullish (upward movement) and bearish (downward movement) trends during various market sessions. Here's an overview of how the indicator works:
1. Session Definition: The indicator defines four distinct trading sessions:
- London Session: Typically covering the European trading hours.
- New York AM Session: Representing the morning hours of the New York trading session.
- New York PM Session: Representing the afternoon hours of the New York trading session.
- Asia Session: Encompassing the trading hours of the Asian markets.
2. Configuration Options: Users can customize the behavior of the indicator through input options. For each session, users can enable or disable the display of session-specific candles.
3. Candle Coloring: The indicator determines the color of candles based on the following criteria:
- For each session, it checks whether the current candle's closing price is higher than its opening price.
- If the closing price is higher, the candle is considered bullish, and a user-defined green color is used for the candle.
- If the closing price is lower, the candle is considered bearish, and a user-defined red color is applied.
4. Display: The indicator then applies the calculated candle colors to the respective candles of each trading session on the price chart. This visual distinction helps traders quickly identify the prevailing trend during different market sessions.
To use the indicator, traders can overlay it on their price charts in TradingView. By enabling or disabling specific trading sessions, they can focus on the trends and price movements during those specific time periods.
Please note that the actual appearance of the indicator on the chart depends on the user's chosen settings for session enablement and color preferences.
ICT Sessions_One Setup for Life [MK]The script plots the High/Low of the following trading sessions:
London - 02:00-05:00
NY AM - 09:30-12:00
New York Lunch - 12:00-13:30
New York PM - 13:30-16:00
Due to the high level of liquidity (resting orders), highs and lows of these sessions may be used as buy/sell areas and also as profit target areas. Typically, buy orders would be initiated below a session low and sell orders would be initiated above a
session high.
The script also plots 'RTH (Regular Trading Hours) Opening Gaps'. The RTH gaps are drawn from the closing price of regular trading at 16:15 (EST) to the open price of regular trading at 09:30 (EST). Gaps can be areas that traders might anticipate to be filled at some time in the future. A gap 'midline' is available if needed and yesterday RTH close line can be shown and extended to the current bar.
This script is simply a means to draw boxes around certain areas/periods on the charts. It is in no way a trading strategy and users should spend much time to study the concept and should also perform extensive back-testing before taking any trades.
By setting the lookback value to a much higher value then the default of 6, users can utilise the script to perform their own backtesting studies.
The above chart shows the default setup of the indicator. Note that the user has to choose how far (in days) to lookback and draw the sessions/gaps.
It is also possible to show the session high//low lines and extend them to the current bar time. If this is used it is advised to keep the lookback period as low as possible to ensure charts stay clean/uncluttered.
All boxes/lines styles/colors are fully customisable.

Quantura - Session High/LowIntroduction
“Quantura – Session High/Low” is a professional-grade session mapping indicator that automatically identifies and visualizes the highs, lows, and ranges of key global trading sessions — London, New York, and Asia. It helps traders understand when and where liquidity tends to accumulate, allowing for better market structure analysis and session-based strategy alignment.
Originality & Value
This indicator unifies the three most influential global sessions into a single, adaptive visualization tool. Unlike typical session indicators, it dynamically updates live session highs and lows in real time while marking session boundaries and transitions. Its multi-session management system allows for immediate recognition of overlapping liquidity zones — a crucial feature for institutional and intraday traders.
The value and originality come from:
Real-time tracking of session highs, lows, and developing ranges.
Simultaneous visualization of multiple global sessions.
Optional vertical range lines for clearer visual segmentation.
Customizable session times, colors, and time zone offset for global accuracy.
Automatically extending and updating lines as each session progresses.
Functionality & Core Logic
Detects the start and end of each trading session (London, New York, Asia) using built-in time logic and user-defined UTC offsets.
Initializes session-specific high and low variables at the start of each new session.
Continuously updates session high/low levels as new candles form.
Draws color-coded horizontal lines for each session’s high and low.
Optionally adds vertical dotted lines to visually connect session range extremes.
Locks each session’s range once it ends, preserving historical structure for review.
Parameters & Customization
New York Session: Enable/disable, customize time (default 15:30–21:30), and set color.
London Session: Enable/disable, customize time (default 09:00–16:30), and set color.
Asia Session: Enable/disable, customize time (default 02:30–08:00), and set color.
Vertical Line: Toggle dotted vertical lines connecting session high and low levels.
UTC Offset: Adjust session timing to align with your chart’s local time zone.
Visualization & Display
Each session is color-coded for quick identification (default: blue for London, red for New York, green for Asia).
Horizontal lines track evolving session highs and lows in real time.
Once a session closes, the lines remain fixed to mark historical range boundaries.
Vertical dotted lines (optional) visually connect the session’s high and low for clarity.
Supports full overlay display without interfering with other technical indicators.
Use Cases
Identify liquidity zones and range extremes formed during active trading sessions.
Observe session overlaps (London–New York) to anticipate volatility spikes.
Combine with volume or market structure tools for session-based confluence.
Track how price interacts with prior session highs/lows to detect potential reversals.
Analyze session-specific performance patterns for algorithmic or discretionary systems.
Limitations & Recommendations
The indicator is designed for intraday analysis and may not provide meaningful output on daily or higher timeframes.
Adjust session times and UTC offset based on your broker’s or exchange’s timezone.
Does not provide trading signals — it visualizes session structure only.
Combine with liquidity and volatility indicators for full contextual understanding.
Markets & Timeframes
Compatible with all asset classes — including crypto, forex, indices, and commodities — and optimized for intraday timeframes (1m–4h). Particularly useful for traders analyzing session overlaps and volatility transitions.
Author & Access
Developed 100% by Quantura. Published as a Open-source script indicator. Access is free.
Compliance Note
This description fully complies with TradingView’s Script Publishing Rules and House Rules . It provides a detailed explanation of functionality, parameters, and realistic use cases without making any performance or predictive claims.

Four Trading SessionsIve adapted this from someone else's script to include 4 sessions instead of 3
TradingView Indicator Description: Trading Sessions
Overview:
The "Trading Sessions" indicator, written in Pine Script v5, visually highlights major forex trading sessions (Tokyo, London, New York, and Sydney) on intraday charts. It displays session ranges as colored boxes, with optional open/close lines, average price lines, and labels showing session names, tick ranges, and average prices. Users can customize session times, time zones, colors, and display options.
Key Features:
Customizable Sessions: Supports up to four trading sessions (Tokyo, London, New York, Sydney) with user-defined names, time ranges, and time zones (e.g., "Asia/Tokyo", "America/New_York").
Visual Elements:
Draws semi-transparent boxes to mark session price ranges (high/low).
Optional dashed lines for session open and close prices.
Optional dotted line for the session's average price.
Labels displaying session name, tick range, and/or average price (configurable).
Time Zone Support: Specify time zones using IANA database names (e.g., "Australia/Sydney") or GMT notation, with a recommendation for IANA to handle daylight savings.
Display Options: Toggle session names, open/close lines, tick range, and average price visibility.
Intraday Restriction: Works only on intraday timeframes, with an error for daily/weekly/monthly charts.
Performance Optimized: Limits boxes, lines, and labels to 500 each to ensure smooth performance.
Inputs:
General Settings:
Show session names, open/close lines, tick range, and average price (all enabled by default).
Per Session (Tokyo, London, New York, Sydney):
Enable/disable session display.
Custom session name (e.g., "Tokyo").
Session time range (e.g., "0900-1500" for Tokyo).
Time zone (e.g., "Asia/Tokyo").
Session color (semi-transparent blue, orange, green, purple by default).
How It Works:
The script checks if the current bar falls within a session’s time range (adjusted for the specified time zone).
For each active session, it creates a box spanning the session’s high/low and updates it bar-by-bar.
Optional open/close lines and an average price line are drawn and updated dynamically.
Labels display user-selected metrics (name, range, average price) at the bottom of each session box.
Sessions reset daily, ensuring accurate representation across days.
Use Case:
Ideal for forex traders who want to analyze price action during specific trading sessions. The indicator helps identify session-specific volatility, key price levels, and trends, with clear visual cues and customizable settings.
Limitations:
Only works on intraday timeframes.
Limited to 500 boxes, lines, and labels to prevent performance issues.
Requires accurate time zone settings for proper session alignment.
Example:
Enable the Tokyo and New York sessions, set their respective time zones, and toggle on all display options to see colored boxes, open/close lines, average price lines, and labels with tick ranges and averages for each session.

Session High and Session LowI have heard many people ask for a script that will identify the high and low of a specific session. So, I made one.
Important Note: This indicator has to be set up properly or you will get an error. Important things to note are the length of the range and the session definition. The idea is that you would set it up for what's relevant to your trading. Going too far back in the chart history will cause errors. Setting the session for a time that is not on the chart can cause errors. If you set it to look farther back than there are bars to display, you may get an error. What I've found is that if you get an error, you just need to change the settings to reflect available data and it will be able to compile the script. At the time of its publishing, the default range start is set to 10/01/2020. If you're looking at this years later, you'll probably have to set the range to something more recent.
Features:
Plot or Lines:
Using Plot (displayed), the indicator will track the high/low from the end of the session into the next session. Then at the start of the next session, it will start tracking the high/low of that session until its end, then track that high/low until the start of the next session then reset.
Using lines, it will extend horizontal lines to the right indefinitely. The number of sessions back that the lines apply to is a user-defined number of sessions. There are limits to the number of lines that can be cast on a chart (roughly 40-50). So, the maximum number of sessions you can apply the lines to is the last 21 sessions (42 lines total). That gets really noisy though so I can't imagine that is a limiting factor.
Colors:
You can change the background color and its transparency, as well as turn the background color on or off.
You can change the highs and lows colors
You can adjust the line width to your preference
Session Length:
You can use a continuous session covering any user-defined period (provided its not tooooo many candles back)
You can define the session length for intraday
You can exclude weekends
Display Options:
You can adjust the colors, transparency, and linewidth
You can display the plotline or horizontal lines
You can show/hide the background color.
You can change how many sessions back the horizontal lines will track
Let me know if there's anything this script is missing or if you run into any issues that I might be able to help resolve.
Here's what it looks like with Lines for the last 5 sessions and different background color.

Market Sessions - by Alexander RottasMarket Sessions - Alexander Rottas
This TradingView indicator displays market sessions for USA, EUROPE, and ASIA on your chart. It provides a clear and intuitive way to identify the active market periods, making it easier to plan your trades.
Features:
Session Display: Optionally show market sessions for USA, EUROPE, and ASIA.
Customizable Timings: Set start and end times in UTC for each market session.
Visual Indicators: Color-coded squares indicate active sessions and their combinations:
USA Session: Blue
EUROPE Session: Purple
ASIA Session: Dull Orange
Combined Sessions: Lighter shades to show overlapping sessions
Session Labels: Dynamic labels at the start of each session to easily identify session beginnings on weekdays.
User-Friendly Design: This indicator is designed to be non-intrusive and easy to use, with a simple setup and clear visual cues. Unlike other complex tools, it integrates seamlessly into your chart without overwhelming your view, making it an ideal choice for traders seeking a straightforward way to track market sessions.
DISCLAIMER: This script is provided for educational purposes only. It cannot be used for commercial purposes or plagiarized. All rights reserved by the author. Unauthorized use or distribution of this script is prohibited. For more details, please contact the author directly.

ICT Silver Bullet Zones (All Sessions)This Pine Script v6 indicator highlights the ICT Silver Bullet windows (10:00–11:00 local time) for all major forex/trading sessions: London, New York AM, New York PM, and Asia.
✅ Features:
Clearly visualizes Silver Bullet zones for each session.
Labels are centered inside each zone for easy identification.
Fully compatible with Pine Script v6 and TradingView.
Adjustable opacity and label size for better chart visibility.
Works on any timeframe and keeps historical zones visible.
Use Case:
Perfect for ICT strategy traders who want to identify high-probability trading windows during major market sessions. Helps in planning entries and understanding liquidity timing without cluttering the chart.
Instructions:
Add the script to your TradingView chart.
Adjust opacity and label size to suit your chart style.
Observe the SB zones for all sessions and plan trades according to ICT methodology.

ORB Norman (2 Sessions, Auto Timezone)ORB Norman (2 Sessions, Auto Timezone)
This script plots Opening Range Breakout (ORB) levels for two configurable sessions. It’s designed for intraday traders—especially in futures markets like Gold (GC), Nasdaq (NQ), and S&P (ES)—who trade based on early session breakouts or range rejections. Unlike standard indicators, this tool auto-adjusts for timezones based on the instrument, ensuring precise session alignment.
Features:
Automatically adjusts for NQ/ES (Chicago time) and GC (New York time) based on the symbol.
Plots high, low, and optional midpoint lines for each session.
Clean, minimal settings with visual separation for better usability.
Ray extension length is fully customizable.
Works on any intraday chart (recommended: 5–15 minute timeframes).
Includes customizable session times, colors, ray length, and an optional midpoint line.
Default Sessions:
Session 1:
‣ 07:00–08:00 EST for GC
‣ 06:00–07:00 CT for NQ/ES
Session 2:
‣ 09:30–09:45 EST for GC
‣ 08:30–08:45 CT for NQ/ES
This tool is ideal for traders who scalp the early morning breakout or look for range rejections based on the opening auction.
This script was developed from scratch based on the author's own intraday trading needs.

Chart Box Session Indicator [The Quant Science]This indicator allows highlighting specific time sessions within a chart by creating colored boxes to represent the price range of the selected session. Is an advanced and flexible tool for chart segmenting trading sessions. Thanks to its extensive customization options and advanced visualization features, it allows traders to gain a clear representation of key market areas based on chosen time intervals.
The indicator offers two range calculation modes:
Body to Body: considers the range between the opening and closing price.
Wick to Wick: considers the range between the session's low and high.
Body To Body
Wick to Wick
Key Features
1. Session Configuration
- Users can select the time range of the session of interest.
- Option to choose the day of the week for the calculation.
- Supports UTC timezone selection to correctly align data.
2. Customizable Visualization
- Option to display session price lines.
- Ability to show a central price line.
- Extension of session lines beyond the specified duration.
3. Design Display Configuration
- Three different background configurations to suit light and dark themes.
- Two gradient modes for session coloring:
- Centered: the color is evenly distributed.
- Off-Centered: the gradient is asymmetrical.
How It Works
The indicator determines whether the current time falls within the selected session, creating a colored box that highlights the corresponding price range. Depending on user preferences, the indicator draws horizontal lines at the minimum and maximum price levels and, optionally, a central line.
During the session:
- The lowest and highest session prices are dynamically updated.
- The range is divided into 10 bands to create a gradient effect.
- A colored box is generated to visually highlight the chosen session.
If the Extend Lines option is enabled, price lines continue even after the session ends, keeping the range visible for further analysis.
This indicator is useful for traders who want to analyze price behavior in specific timeframes. It is particularly beneficial for strategies based on market sessions (e.g., London or New York open) or for identifying accumulation and distribution zones.

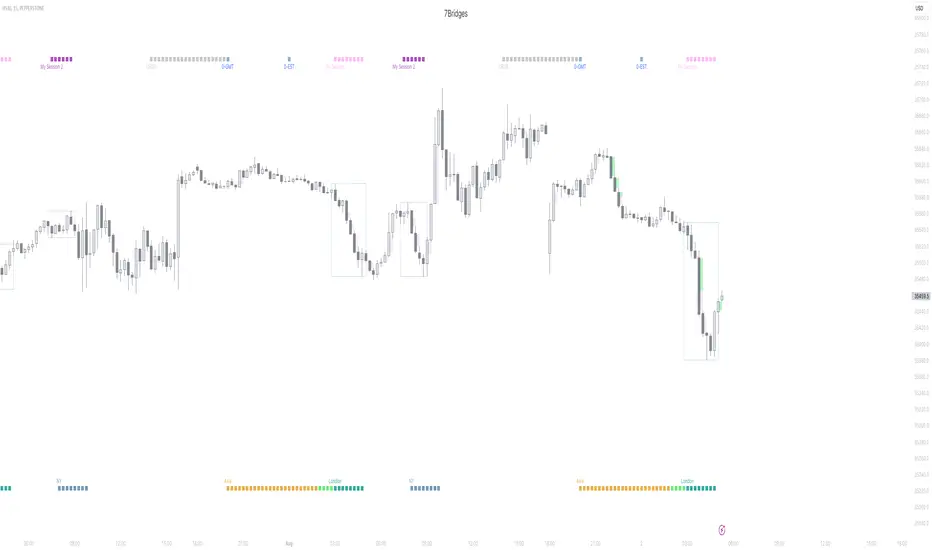
Session KillZones [7Bridges]Session Killzones by 7Bridges indicator display the killzones of asian, LND and NY sessions. There is also a custom session of your choice.
The times of each killzone are GMT time and you can adjust it in the settings.
You have also the beginning of the day, GMT and EST timezones.
By default the killzones are set like that on the GMT/UTC timezone :
-> Asia : 00:00 - 06:00
-> Pre London : 06:00 - 07:00
-> London : 07:00 - 10:00
-> New York : 12:00 - 15:00
-> Custom session : choose your own time
What makes the indicator very different is that the session is not overlapping the price but you have bars below and above the price.
Settings:
-> you can chose to display the Killzones (Asia, pre LND, LND and NY)
-> you can manages the time of the sessions
-> you can chose to display the start of the day (GMT/UTC and EST )
The indicator is displayed by default only for all the timeframes below 60min.
Market Sessions — VerticalA clean visual guide to global market sessions.
This indicator plots vertical lines at the opening and closing times of the four major forex sessions:
London, New York, Tokyo, and Sydney.
Fully customizable — toggle each session on/off, choose separate colors for open/close, and enable/disable labels.
Supports both Local (auto-DST) and GMT (fixed) modes — switch between realistic market-clock times or the standardized UTC schedule used by most trading resources.
Helps you visually identify session overlaps (e.g., London–New York) where volatility typically increases.
Ideal for forex, indices, and commodities traders who trade around session opens.
Default session times (GMT mode):
Sydney 21:00 – 06:00 GMT
Tokyo 00:00 – 09:00 GMT
London 08:00 – 17:00 GMT
New York 13:00 – 22:00 GMT
Tip: Set Anchor times by → Local (auto-DST) if you want the lines to follow each region’s real-world daylight-saving adjustments automatically.
Clean, lightweight, and built for traders who want precise, minimal clutter — just the key time windows that move the market.

Trading Sessions Background ColorTrading Sessions Background Color
This indicator provides a visual representation of the major trading sessions — Asia, London, and USA — by applying distinct background colors to the chart. It allows traders to easily identify active market hours and session overlaps.
Features:
Customizable Sessions: Users can modify time ranges, and colors according to their preferences.
Predefined Major Trading Sessions: The indicator includes Asia, London, and USA sessions by default.
Time Zone Adjustment: A configurable UTC offset ensures accurate session display.
Clear Visual Differentiation: Background colors indicate when each session is active.
Usage Instructions:
Apply the indicator to a TradingView chart.
Adjust session settings and time zone offset as needed.
The chart background will update dynamically to reflect the active trading session.

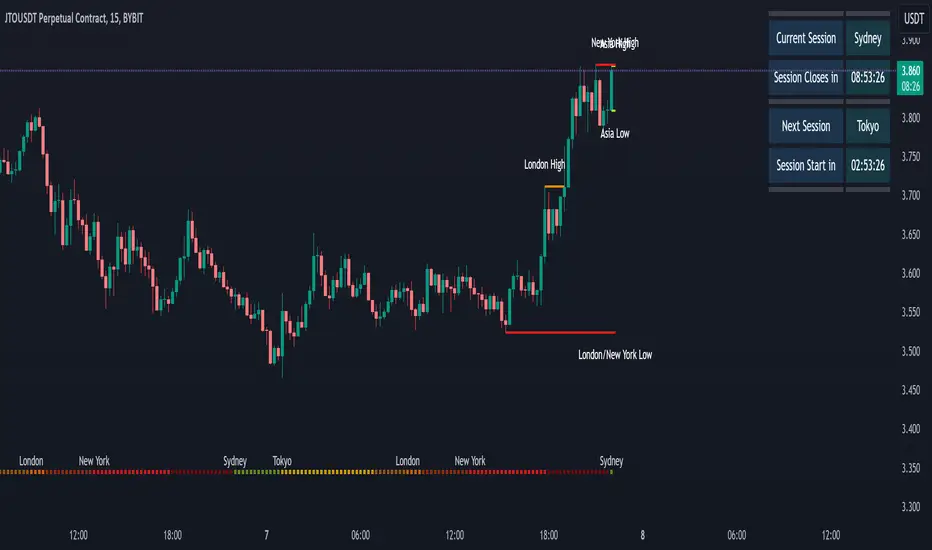
Session Sweeps [LuxAlgo]The Session Sweeps indicator combines ICT-based features for a complete trading methodology involving market sessions, market structure, and fair value gaps to find optimal entry conditions for trading price action.
Traders frequently tend to place stop/limit orders at the high and low points of major trading sessions such as Asian (Tokyo), European (London), and North American (New York), resulting in the establishment of liquidity pools at those particular levels. The Session Sweeps indicator is crafted to recognize and underscore occurrences of session sweeps or liquidity sweeps during these major trading sessions.
🔶 USAGE
Default settings utilize major forex trading sessions, yet users can select their preferred opening and closing times, rename the sessions, or adjust the colors. It's important to note that the specified times for each session align with the respective local timezones: Asian (Tokyo) UTC+9, European (London) UTC, and North American (New York) UTC-5.
If the price briefly crosses either the highest or lowest point of a market session. These movements, aiming at triggering stop losses, suggest potential shifts in the market direction. Detecting such movements is the fundamental purpose and core functionality of the script.
🔹Market Structure Shifts
A Market Structure Shift refers to a change in market direction, either from an uptrend to a downtrend or vice versa. A part of a common entry model when using session sweeps is waiting for the formation of a CHoCH after a session sweep.
🔹Fair Value Gaps
A Fair Value Gap (FVG) holds particular appeal for price action traders, emerging when there are inefficiencies or imbalances in the market, often a result of uneven buying and selling activity. The underlying concept of FVGs is that the market tends to revisit these inefficiencies before resuming its trajectory in alignment with the initial impulsive move.
After the formation of a CHoCH traders can enter a position when the price enters the area of a Fair Value Gap (FVG).
🔹Setup Examples
This entry setup is commonly used by ICT traders and is shared for informational & educational purposes only.
Long Positions (5-Minute Timeframe):
Wait for the previous session's low to be swept.
Look for a Bullish Choch.
Find a Bullish FVG formed by or before the Choch.
Entry Point: At the FVG.
Take Profit (TP): At the session high or aim for a 1:2 Risk-Reward Ratio.
Stop Loss (SL): At the session low or nearest Swing Low.
Take partial profits at intermediate swings, but don’t shift SL prematurely.
Short Positions (5-Minute Timeframe):
Wait for the previous session's high to be swept.
Look for a Bearish Choch.
Find a FVG formed by or before the Choch.
Entry Point: At the FVG.
Take Profit (TP): At the previous session's low or aim for a 1:2 RR.
Stop Loss (SL): At the session high or nearest Swing High.
Take partial profits at intermediate swings, but don’t shift SL prematurely.
🔶 SETTINGS
🔹Session Sweeps
Buyside Sweep Zones, Color, and Margin: toggles the visibility of bullside sweep zones, customizes the associated color, and sets the margin value defining the range of a bullside sweep zone.
Sellside Sweep Zones, Color, and Margin: toggles the visibility of sell-side sweep zones, customizes the associated color, and sets the margin value defining the range of a sell-side sweep zone.
Sweep Margin Length: specifies the maximum allowed length of a sweep zone invalidation, the length over which the price slightly invalidated the margin range.
Detect Sweeps Once per Session: if enabled will detect only once a sweep zone within a session.
Hide Fake Sweep Zones, and Color: controls the visibility and color of the fake sweep zones.
🔹Sessions
Session (Asia, London, New York AM, and New York PM), Start Time, and End Time: enables or disables the visibility of the named market session range, and customization of the session hours.
Color: color customization option of the named session.
Extend Max/Min: extends the highest and lowest price levels of the named session until the end of the next enabled session. This option is recommended to be enabled when sweep zone detection is activated to observe the relationship between the sweep zone and previous session extreme levels.
Extend Mid: extends the mean price levels of the named session until the end of the next enabled session. The extended line may serve as potential support and resistance levels.
Fill: enables/disables background coloring of the named session.
New York DST | London DST: enabling this option initiates Daylight Saving Time (DST) for New York or London. Note: Daylight Saving Time is not applied to the Asian (Tokyo) session.
Sessions Extreme Lines | Sessions Names: toggles the visibility of the highest and lowest price levels, as well as the names, for all market sessions.
Session Lines Width: sets the width of the lines for all sessions.
Session Fill Transparency: sets the background color transparency of the range for all sessions.
🔹Market Structure Shifts
Market Structure Shifts: toggles the visibility of market structure shifts, also known as change of character (CHoCH).
Detection Length: specifies the detection length.
Market Structure Shifts; Bull & Bear: color customization options.
🔹Fair Value Gaps
Fair Value Gaps: toggles the visibility of the fair value gaps.
Fair Value Gap Width Filter: specifies the filtering multiplier; additional details can be found in the tooltip of the respective input option.
Bullish & Bearish Imbalance: color customization options.
🔹Sessions Tabular View
Sessions Tabular View: toggles the visibility of the tabular view of the sessions, displaying date &time, status, and countdown counter.
Hide if not Forex Market Instrument: checks the market and automatically enables/disables the option based on the market instrument.
Table Text Size & Position: size and placement customization options
🔶 LIMITATIONS
Please be aware that fair value gap filtering cannot be applied to the initial 144 candles (with a fixed-length ATR) as the ATR value necessary for filtering won't be available during this period.
🔶 RELATED SCRIPTS
Buyside-Sellside-Liquidity
Sessions
Liquidity-Voids-FVG
Thank you to our community for the recommendation of this script. To explore additional conceptual scripts and related content, we invite you to visit >>> LuxAlgo-Scripts .

Relative Performance Areas [LuxAlgo]The Relative Performance Areas tool enables traders to analyze the relative performance of any asset against a user-selected benchmark directly on the chart, session by session.
The tool features three display modes for rescaled benchmark prices, as well as a statistics panel providing relevant information about overperforming and underperforming streaks.
🔶 USAGE
Usage is straightforward. Each session is highlighted with an area displaying the asset price range. By default, a green background is displayed when the asset outperforms the benchmark for the session. A red background is displayed if the asset underperforms the benchmark.
The benchmark is displayed as a green or red line. An extended price area is displayed when the benchmark exceeds the asset price and is set to SPX by default, but traders can choose any ticker from the settings panel.
Using benchmarks to compare performance is a common practice in trading and investing. Using indexes such as the S&P 500 (SPX) or the NASDAQ 100 (NDX) to measure our portfolio's performance provides a clear indication of whether our returns are above or below the broad market.
As the previous chart shows, if we have a long position in the NASDAQ 100 and buy an ETF like QQQ, we can clearly see how this position performs against BTSUSD and GOLD in each session.
Over the last 15 sessions, the NASDAQ 100 outperformed the BTSUSD in eight sessions and the GOLD in six sessions. Conversely, it underperformed the BTCUSD in seven sessions and the GOLD in nine sessions.
🔹 Display Mode
The display mode options in the Settings panel determine how benchmark performance is calculated. There are three display modes for the benchmark:
Net Returns: Uses the raw net returns of the benchmark from the start of the session.
Rescaled Returns: Uses the benchmark net returns multiplied by the ratio of the benchmark net returns standard deviation to the asset net returns standard deviation.
Standardized Returns: Uses the z-score of the benchmark returns multiplied by the standard deviation of the asset returns.
Comparing net returns between an asset and a benchmark provides traders with a broad view of relative performance and is straightforward.
When traders want a better comparison, they can use rescaled returns. This option scales the benchmark performance using the asset's volatility, providing a fairer comparison.
Standardized returns are the most sophisticated approach. They calculate the z-score of the benchmark returns to determine how many standard deviations they are from the mean. Then, they scale that number using the asset volatility, which is measured by the asset returns standard deviation.
As the chart above shows, different display modes produce different results. All of these methods are useful for making comparisons and accounting for different factors.
🔹 Dashboard
The statistics dashboard is a great addition that allows traders to gain a deep understanding of the relationship between assets and benchmarks.
First, we have raw data on overperforming and underperforming sessions. This shows how many sessions the asset performance at the end of the session was above or below the benchmark.
Next, we have the streaks statistics. We define a streak as two or more consecutive sessions where the asset overperformed or underperformed the benchmark.
Here, we have the number of winning and losing streaks (winning means overperforming and losing means underperforming), the median duration of each streak in sessions, the mode (the number of sessions that occurs most frequently), and the percentages of streaks with durations equal to or greater than three, four, five, and six sessions.
As the image shows, these statistics are useful for traders to better understand the relative behavior of different assets.
🔶 SETTINGS
Benchmark: Benchmark for comparison
Display Mode: Choose how to display the benchmark; Net Returns: Uses the raw net returns of the benchmark. Rescaled Returns: Uses the benchmark net returns multiplied by the ratio of the benchmark and asset standard deviations. Standardized Returns: Uses the benchmark z-score multiplied by the asset standard deviation.
🔹 Dashboard
Dashboard: Enable or disable the dashboard.
Position: Select the location of the dashboard.
Size: Select the dashboard size.
🔹 Style
Overperforming: Enable or disable displaying overperforming sessions and choose a color.
Underperforming: Enable or disable displaying underperforming sessions and choose a color.
Benchmark: Enable or disable displaying the benchmark and choose colors.

Market SessionsMarket Sessions Indicator Overview:
The "Market Sessions" indicator is a powerful tool designed to enhance traders' insights by providing comprehensive information about key market sessions, daily high/low values, and important exponential moving averages (EMAs) directly on the trading chart.
Key Features:
Market Sessions Display:
Visually represents Sydney/Tokyo, London, and New York sessions using distinct color-coded shapes.
Enhances visibility by dynamically changing the background color during specific trading sessions.
Daily High/Low:
Plots and labels the high and low values of the previous trading day on the chart.
Customizable colors for daily high and low markers.
Exponential Moving Averages (EMAs):
Includes 20, 50, and 200-period EMAs for comprehensive trend analysis.
Users have the flexibility to customize the visibility and color of each EMA.
Dashboard Information:
Real-time information about the current and upcoming market sessions.
Displays the time remaining for the upcoming session, aiding in timely decision-making.
Stock Session Information:
Clearly marks open and close times for Asia, Euro, and USA stock sessions.
Customizable visibility options for stock open/close lines, allowing for a tailored chart display.
Usage Guidelines:
Market Session Identification: Easily identify distinct market sessions using color-coded shapes and background color changes.
Daily Analysis: Quickly reference labeled lines for the high and low values of the previous trading day.
Trend Analysis: Observe the plotted EMAs on the chart for insights into the prevailing trends.
Real-time Monitoring: Utilize the dashboard for real-time information on current and upcoming sessions.
Stock Session Details: Identify specific open and close times for stock sessions, aiding in strategic planning.
Customization Options:
User-Friendly Parameters: Customize visibility, color, and positioning based on individual preferences.
Dashboard Configuration: Adjust dashboard position, text placement, and EMA parameters to tailor the indicator to specific needs.
Backtesting Feature:
The indicator includes a backtest feature, allowing users to visualize past sessions for testing and refining trading strategies.
This Market Sessions Indicator provides traders with a holistic view of market dynamics, facilitating informed decision-making and enhancing overall trading experiences.
market sessions by sellstreetIndicator of trading sessions:
Indicator created to track the opening of trading sessions:
Asia, Frankfurt, London, New York.
Tracking the opening of these key levels
- Day Opening (DO), Week Opening (WO), Month Opening (MO).
- New York (NYM) openings display.
- Highs and lows of the previous day (PDH/PDL).
- Day of the week display.
- Formation of the Сentral Bank Dealers Range (CBDR).
Indicator settings.
The open source code will help traders to understand the technical part of the script.
Flexible visual and technical setup of the indicator:
- Ability to enable/disable the display of trading sessions on the history.
- Enabling/disabling the display of the key opening levels on the chart history for a convenient backtest.
- Automatically switch to summer/winter time.
To use this indicator, add it to your favorites after the chart
TradingView must be overloaded to work correctly.

SessionLibrary "Session"
Helper functions for trading sessions. TradingView doesn't provide correct data when
calling some of the convenience methods like session.ismarket when you are looking at futures charts. This library corrects those mistakes by providing functions with the same names as the TradingView default properties. that reference a custom defined set of session hours for futures. It also provides a way for consumers to customize the map values by calling getSessionMap() and then overwriting (or adding) custom session definitions.
getSessionMap()
Returns a map of the futures rth & eth session hours. The map is keyed with symbol:session format (eg. ES:market or ES:overnight).
Returns: A map of futures symbols and their associated session hours.
getSessionString(session, symbol, sessionMap)
Returns a session string representing the session hours (and days) for the requested symbol (or the chart's symbol if the symbol value is not provided). If the session string is not found in the collection, it will return a blank string.
Parameters:
session (string) : A string representing the session hour being requested. One of: market (regular trading hours), overnight (extended/electronic trading hours), postmarket (after-hours), premarket
symbol (string) : The symbol to check. Optional. Defaults to chart symbol.
sessionMap (map) : The map of futures session hours. Optional. Uses default if not provided.
inSession(session, sessionMap, barsBack)
Returns true if the current symbol is currently in the session parameters defined by sessionString.
Parameters:
session (string) : A string representing the session hour being requested. One of: market (regular trading hours), overnight (extended/electronic trading hours), postmarket (after-hours), premarket
sessionMap (map) : The map of futures session hours. Optional. Uses default if not provided.
barsBack (int) : Private. Only used by futures to check islastbar. Optional. The default is 0.
ismarket(sessionMap)
Returns true if the current bar is a part of the regular trading hours (i.e. market hours), false otherwise. Works for futures (TradingView's methods do not).
Parameters:
sessionMap (map) : The map of futures session hours. Optional. Uses default if not provided.
Returns: bool
isfirstbar()
Returns true if the current bar is the first bar of the day's session, false otherwise. If extended session information is used, only returns true on the first bar of the pre-market bars. Works for futures (TradingView's methods do not).
Returns: bool
islastbar()
Returns true if the current bar is the last bar of the day's session, false otherwise. If extended session information is used, only returns true on the last bar of the post-market bars. Works for futures (TradingView's methods do not).
Returns: bool
ispremarket(sessionMap)
Returns true if the current bar is a part of the pre-market, false otherwise. On non-intraday charts always returns false. Works for futures (TradingView's methods do not).
Parameters:
sessionMap (map) : The map of futures session hours. Optional. Uses default if not provided.
Returns: bool
ispostmarket(sessionMap)
Returns true if the current bar is a part of the post-market, false otherwise. On non-intraday charts always returns false. Works for futures (TradingView's methods do not).
Parameters:
sessionMap (map) : The map of futures session hours. Optional. Uses default if not provided.
Returns: bool
isfirstbar_regular(sessionMap)
Returns true on the first regular session bar of the day, false otherwise. The result is the same whether extended session information is used or not. Works for futures (TradingView's methods do not).
Parameters:
sessionMap (map) : The map of futures session hours. Optional. Uses default if not provided.
Returns: bool
islastbar_regular(sessionMap)
Returns true on the last regular session bar of the day, false otherwise. The result is the same whether extended session information is used or not. Works for futures (TradingView's methods do not).
Parameters:
sessionMap (map) : The map of futures session hours. Optional. Uses default if not provided.
Returns: bool
isovernight(sessionMap)
Returns true if the current bar is a part of the pre-market or post-market, false otherwise. On non-intraday charts always returns false.
Parameters:
sessionMap (map) : The map of futures session hours. Optional. Uses default if not provided.
Returns: bool
getSessionHighAndLow(session, sessionMap)
Returns a tuple containing the high and low print during the specified session.
Parameters:
session (string) : The session for which to get the high & low prints. Defaults to market.
sessionMap (map) : The map of futures session hours. Optional. Uses default if not provided.
Returns: A tuple containing
