Market Sessions - by Alexander RottasMarket Sessions - Alexander Rottas
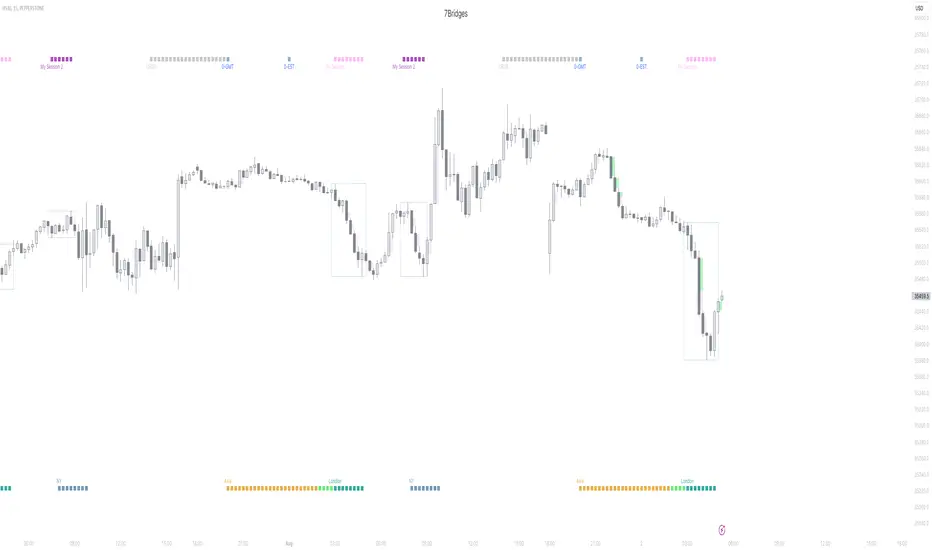
This TradingView indicator displays market sessions for USA, EUROPE, and ASIA on your chart. It provides a clear and intuitive way to identify the active market periods, making it easier to plan your trades.
Features:
Session Display: Optionally show market sessions for USA, EUROPE, and ASIA.
Customizable Timings: Set start and end times in UTC for each market session.
Visual Indicators: Color-coded squares indicate active sessions and their combinations:
USA Session: Blue
EUROPE Session: Purple
ASIA Session: Dull Orange
Combined Sessions: Lighter shades to show overlapping sessions
Session Labels: Dynamic labels at the start of each session to easily identify session beginnings on weekdays.
User-Friendly Design: This indicator is designed to be non-intrusive and easy to use, with a simple setup and clear visual cues. Unlike other complex tools, it integrates seamlessly into your chart without overwhelming your view, making it an ideal choice for traders seeking a straightforward way to track market sessions.
DISCLAIMER: This script is provided for educational purposes only. It cannot be used for commercial purposes or plagiarized. All rights reserved by the author. Unauthorized use or distribution of this script is prohibited. For more details, please contact the author directly.
Penunjuk Pine Script®