Multi-indicator Signal Builder [Skyrexio]Overview
Multi-Indicator Signal Builder is a versatile, all-in-one script designed to streamline your trading workflow by combining multiple popular technical indicators under a single roof. It features a single-entry, single-exit logic, intrabar stop-loss/take-profit handling, an optional time filter, a visually accessible condition table, and a built-in statistics label. Traders can choose any combination of 12+ indicators (RSI, Ultimate Oscillator, Bollinger %B, Moving Averages, ADX, Stochastic, MACD, PSAR, MFI, CCI, Heikin Ashi, and a “TV Screener” placeholder) to form entry or exit conditions. This script aims to simplify strategy creation and analysis, making it a powerful toolkit for technical traders.
Indicators Overview
1. RSI (Relative Strength Index)
Measures recent price changes to evaluate overbought or oversold conditions on a 0–100 scale.
2. Ultimate Oscillator (UO)
Uses weighted averages of three different timeframes, aiming to confirm price momentum while avoiding false divergences.
3. Bollinger %B
Expresses price relative to Bollinger Bands, indicating whether price is near the upper band (overbought) or lower band (oversold).
4. Moving Average (MA)
Smooths price data over a specified period. The script supports both SMA and EMA to help identify trend direction and potential crossovers.
5. ADX (Average Directional Index)
Gauges the strength of a trend (0–100). Higher ADX signals stronger momentum, while lower ADX indicates a weaker trend.
6. Stochastic
Compares a closing price to a price range over a given period to identify momentum shifts and potential reversals.
7. MACD (Moving Average Convergence/Divergence)
Tracks the difference between two EMAs plus a signal line, commonly used to spot momentum flips through crossovers.
8. PSAR (Parabolic SAR)
Plots a trailing stop-and-reverse dot that moves with the trend. Often used to signal potential reversals when price crosses PSAR.
9. MFI (Money Flow Index)
Similar to RSI but incorporates volume data. A reading above 80 can suggest overbought conditions, while below 20 may indicate oversold.
10. CCI (Commodity Channel Index)
Identifies cyclical trends or overbought/oversold levels by comparing current price to an average price over a set timeframe.
11. Heikin Ashi
A type of candlestick charting that filters out market noise. The script uses a streak-based approach (multiple consecutive bullish or bearish bars) to gauge mini-trends.
12. TV Screener
A placeholder condition designed to integrate external buy/sell logic (like a TradingView “Buy” or “Sell” rating). Users can override or reference external signals if desired.
Unique Features
1. Multi-Indicator Entry and Exit
You can selectively enable any subset of 12+ classic indicators, each with customizable parameters and conditions. A position opens only if all enabled entry conditions are met, and it closes only when all enabled exit conditions are satisfied, helping reduce false triggers.
2. Single-Entry / Single-Exit with Intrabar SL/TP
The script supports a single position at a time. Once a position is open, it monitors intrabar to see if the price hits your stop-loss or take-profit levels before the bar closes, making results more realistic for fast-moving markets.
3. Time Window Filter
Users may specify a start/end date range during which trades are allowed, making it convenient to focus on specific market cycles for backtesting or live trading.
4. Condition Table and Statistics
A table at the bottom of the chart lists all active entry/exit indicators. Upon each closed trade, an integrated statistics label displays net profit, total trades, win/loss count, average and median PnL, etc.
5. Seamless Alerts and Automation
Configure alerts in TradingView using “Any alert() function call.”
The script sends JSON alert messages you can route to your own webhook.
The indicator can be integrated with Skyrexio alert bots to automate execution on major cryptocurrency exchanges
6. Optional MA/PSAR Plots
For added visual clarity, optionally plot the chosen moving averages or PSAR on the chart to confirm signals without stacking multiple indicators.
Methodology
1. Multi-Indicator Entry Logic
When multiple entry indicators are enabled (e.g., RSI + Stochastic + MACD), the script requires all signals to align before generating an entry. Each indicator can be set for crossovers, crossunders, thresholds (above/below), etc. This “AND” logic aims to filter out low-confidence triggers.
2. Single-Entry Intrabar SL/TP
One Position At a Time: Once an entry signal triggers, a trade opens at the bar’s close.
Intrabar Checks: Stop-loss and take-profit levels (if enabled) are monitored on every tick. If either is reached, the position closes immediately, without waiting for the bar to end.
3. Exit Logic
All Conditions Must Agree: If the trade is still open (SL/TP not triggered), then all enabled exit indicators must confirm a closure before the script exits on the bar’s close.
4. Time Filter
Optional Trading Window: You can activate a date/time range to constrain entries and exits strictly to that interval.
Justification of Methodology
Indicator Confluence: Combining multiple tools (RSI, MACD, etc.) can reduce noise and false signals.
Intrabar SL/TP: Capturing real-time spikes or dips provides a more precise reflection of typical live trading scenarios.
Single-Entry Model: Straightforward for both manual and automated tracking (especially important in bridging to bots).
Custom Date Range: Helps refine backtesting for specific market conditions or to avoid known irregular data periods.
How to Use
1. Add the Script to Your Chart
In TradingView, open Indicators , search for “Multi-indicator Signal Builder”.
Click to add it to your chart.
2. Configure Inputs
Time Filter: Set a start and end date for trades.
Alerts Messages: Input any JSON or text payload needed by your external service or bot.
Entry Conditions: Enable and configure any indicators (e.g., RSI, MACD) for a confluence-based entry.
Close Conditions: Enable exit indicators, along with optional SL (negative %) and TP (positive %) levels.
3. Set Up Alerts
In TradingView, select “Create Alert” → Condition = “Any alert() function call” → choose this script.
Entry Alert: Triggers on the script’s entry signal.
Close Alert: Triggers on the script’s close signal (or if SL/TP is hit).
Skyrexio Alert Bots: You can route these alerts via webhook to Skyrexio alert bots to automate order execution on major crypto exchanges (or any other supported broker).
4. Visual Reference
A condition table at the bottom summarizes active signals.
Statistics Label updates automatically as trades are closed, showing PnL stats and distribution metrics.
Backtesting Guidelines
Symbol/Timeframe: Works on multiple assets and timeframes; always do thorough testing.
Realistic Costs: Adjust commissions and potential slippage to match typical exchange conditions.
Risk Management: If using the built-in stop-loss/take-profit, set percentages that reflect your personal risk tolerance.
Longer Test Horizons: Verify performance across diverse market cycles to gauge reliability.
Example of statistic calculation
Test Period: 2023-01-01 to 2025-12-31
Initial Capital: $1,000
Commission: 0.1%, Slippage ~5 ticks
Trade Count: 468 (varies by strategy conditions)
Win rate: 76% (varies by strategy conditions)
Net Profit: +96.17% (varies by strategy conditions)
Disclaimer
This indicator is provided strictly for informational and educational purposes .
It does not constitute financial or trading advice.
Past performance never guarantees future results.
Always test thoroughly in demo environments before using real capital.
Enjoy exploring the Multi-Indicator Signal Builder! Experiment with different indicator combinations and adjust parameters to align with your trading preferences, whether you trade manually or link your alerts to external automation services. Happy trading and stay safe!
Cari dalam skrip untuk "signal"

Donchian Reversal Signals with LabelsOverview:
This indicator is designed to identify potential reversal signals based on price action relative to two Donchian Channels. It plots **"BUY"** and **"SELL"** labels on the chart when specific conditions are met, helping traders spot potential trend reversals.
---
Key Features:
1. Dual Donchian Channels:
- The indicator uses two Donchian Channels with user-defined lengths (`length1` and `length2`).
- The upper band of each channel is the highest high over the specified period.
- The lower band of each channel is the lowest low over the specified period.
2. Reversal Signals:
- A yellow "BUY" label appears below a green (bullish) candle if:
- The previous candle is red (bearish).
- The previous red candle touches or breaches either of the lower Donchian Channels.
- A green "SELL" label appears above a red (bearish) candle if:
- The previous candle is green (bullish).
- The previous green candle touches or breaches either of the upper Donchian Channels.
3. Visual Clarity:
- The labels are placed above or below the candles for easy visibility.
- The use of colors (yellow for buy, green for sell) makes it intuitive to interpret the signals.
---
How It Works:
1. Donchian Channel Calculation:
- The upper and lower bands of the two Donchian Channels are calculated using the highest high and lowest low over the specified periods (`length1` and `length2`).
2. Candle Color Detection:
- The script identifies whether the current and previous candles are bullish (green) or bearish (red) based on their open and close prices.
3. Signal Conditions:
- For a **"BUY" signal**:
- The current candle must be green.
- The previous candle must be red and touch or breach either of the lower Donchian Channels.
- For a **"SELL" signal**:
- The current candle must be red.
- The previous candle must be green and touch or breach either of the upper Donchian Channels.
4. Label Placement:
- The labels are plotted using `shape.labelup` and `shape.labeldown` for clear visibility.
---
Input Parameters:
- **Donchian Channel Length 1 (`length1`)**: The period for the first Donchian Channel (default: 20).
- **Donchian Channel Length 2 (`length2`)**: The period for the second Donchian Channel (default: 34).
---
How to Use:
1. Add the indicator to your chart.
2. Adjust the lengths of the Donchian Channels if needed.
3. Look for **"BUY"** and **"SELL"** labels on the chart:
- A **yellow "BUY" label** below a green candle suggests a potential bullish reversal.
- A **green "SELL" label** above a red candle suggests a potential bearish reversal.
4. Use these signals in conjunction with other technical analysis tools for confirmation.
---
Example Use Case:
- If the price touches the lower Donchian Channel and forms a red candle, followed by a green candle, a **"BUY" label** will appear, indicating a potential upward reversal.
- If the price touches the upper Donchian Channel and forms a green candle, followed by a red candle, a **"SELL" label** will appear, indicating a potential downward reversal.
---
Customization:
- You can modify the lengths of the Donchian Channels to suit your trading style.
- The colors and text of the labels can also be adjusted in the script if desired.
---
Disclaimer:
This indicator is designed to assist traders in identifying potential reversal signals. However, it should not be used in isolation. Always confirm signals with additional analysis and risk management strategies.
Supertrend with Buy/Sell SignalsThis simple Supertrend with Buy/Sell Signals is a trend-following indicator that helps identify market direction and potential entry/exit points. It uses the Average True Range (ATR) to calculate a dynamic support and resistance line:
Buy Signal: A green "BUY" label appears when the price crosses above the Supertrend line, indicating a possible bullish trend.
Sell Signal: A red "SELL" label appears when the price crosses below the Supertrend line, signaling a potential bearish trend.
The indicator also adapts to market volatility and displays the trend line in green for uptrends and red for downtrends. It is best used in trending markets.

Trend Filter (2-pole) [BigBeluga]Trend Filter (2-pole)
The Trend Filter (2-pole) is an advanced trend-following indicator based on a two-pole filter, which smooths out market noise while effectively highlighting trends and their strength. It incorporates color gradients and support/resistance dots to enhance trend visualization and decision-making for traders.
SP500:
🔵What is a Two-Pole Filter?
A two-pole filter is a digital signal processing technique widely used in electronics, control systems, and time series data analysis to smooth data and reduce noise.
//@function Two-pole filter
//@param src (series float) Source data (e.g., price)
//@param length (float) Length of the filter (higher value means smoother output)
//@param damping (float) Damping factor for the filter
//@returns (series float) Filtered value
method two_pole_filter(float src, int length, float damping) =>
// Calculate filter coefficients
float omega = 2.0 * math.pi / length
float alpha = damping * omega
float beta = math.pow(omega, 2)
// Initialize the filter variables
var float f1 = na
var float f2 = na
// Update the filter
f1 := nz(f1 ) + alpha * (src - nz(f1 ))
f2 := nz(f2 ) + beta * (f1 - nz(f2 ))
f2
It operates using two cascaded smoothing stages (poles), allowing for a more refined and responsive output compared to simple moving averages or other basic filters.
Two-pole filters are particularly valued for their ability to maintain smooth transitions while reducing lag, making them ideal for applications where precision and responsiveness are critical.
In trading, this filter helps detect trends by smoothing price data while preserving significant directional changes.
🔵Key Features of the Indicator:
Gradient-Colored Trend Filter Line: The main filter line dynamically changes color based on trend strength and direction:
- Green: Strong uptrend.
- Red: Strong downtrend.
- Yellow: Indicates a transition phase, signaling potential trend shifts.
Support and Resistance Dots with Signals:
- Dots are plotted below the filter line during uptrends and above it during downtrends.
- These dots represent consecutive rising or falling conditions of the filter line, which traders can set in the settings (e.g., the number of consecutive rises or falls required).
- The dots often act as dynamic support or resistance levels, providing valuable guidance during trends.
- Trend Signals:
Customizable Sensitivity: The indicator allows traders to adjust the filter length, damping factor, and the threshold for rising/falling conditions, enabling it to adapt to different trading styles and timeframes.
Bar Color Option: The indicator can optionally color bars to match the gradient of the filter line, enhancing visual clarity of trends directly on the price chart.
🔵How It Works:
The Trend Filter (2-pole) smooths price data using a two-pole filter, which reduces noise and highlights the underlying trend.
The gradient coloring of the filter line helps traders visually assess the strength and direction of trends.
Rising and falling conditions of the filter line are tracked, and dots are plotted when consecutive conditions meet the threshold, acting as potential support or resistance levels during trends.
The yellow transition color signals periods of indecision, helping traders anticipate potential reversals or consolidations.
🔵Use Cases:
Identify and follow strong uptrends and downtrends with gradient-based visual cues.
Use the yellow transition color to anticipate trend shifts or consolidation zones.
Leverage the plotted dots as dynamic support and resistance levels to refine entry and exit strategies.
Combine with other indicators for confirmation of trends and reversals.
This indicator is perfect for traders who want a visually intuitive and highly customizable tool to spot trends, gauge their strength, and make informed trading decisions.

Advanced Ichimoku SignalThe Advanced Ichimoku Signal is an innovative indicator that combines the strengths of the Ichimoku Cloud system with enhanced signal processing features. This tool is designed to provide traders with clearer insights into market trends and potential trading opportunities.
Key Features of the Advanced Ichimoku Signal
1. Integration of Ichimoku Components:
- The indicator utilizes essential Ichimoku elements such as **Tenkan-sen** (Conversion Line) and **Kijun-sen** (Base Line) to determine short-term and long-term market trends.
2. Enhanced Signal Logic:
- It incorporates a Weighted Moving Average (WMA) to smooth price data, allowing for better trend identification and reducing noise in volatile markets.
3. Customizable Parameters:
- Traders can adjust various parameters, including the lengths of the Tenkan-sen, Kijun-sen, and WMA, as well as their colors and thicknesses for improved visibility.
4. Dynamic Visual Signals:
- The background color changes based on bullish or bearish conditions, providing immediate visual cues for potential trade setups.
5. Signal Strength Calculation:
- The indicator calculates the strength of signals based on the distance between the closing price and the WMA, helping traders gauge the reliability of trade signals.
Importance of the Advanced Ichimoku Signal
- Trend Analysis: By combining multiple indicators, traders can identify both short-term and long-term trends effectively.
- Improved Decision Making: The clear visual signals help traders make informed decisions quickly, reducing the chances of emotional trading.
- Flexibility in Trading Strategies: The customizable nature of the indicator allows it to fit various trading styles, whether scalping or long-term investing.
- Risk Management: Understanding market momentum through this indicator aids in better risk management by providing clear entry and exit points.
Conclusion
The Advanced Ichimoku Signal is a powerful tool for traders looking to enhance their market analysis capabilities. With its advanced features and customizable settings, it offers a comprehensive approach to identifying trading opportunities in various market conditions. Integrating this indicator into your trading strategy can lead to more informed decisions and improved trading performance.

Adaptive Trend Flow [QuantAlgo]Adaptive Trend Flow 📈🌊
The Adaptive Trend Flow by QuantAlgo is a sophisticated technical indicator that harnesses the power of volatility-adjusted EMAs to navigate market trends with precision. By seamlessly integrating a dynamic dual-EMA system with adaptive volatility bands, this premium tool enables traders and investors to identify and capitalize on sustained market moves while effectively filtering out noise. The indicator's unique approach to trend detection combines classical technical analysis with modern adaptive techniques, providing traders and investors with clear, actionable signals across various market conditions and asset class.
💫 Indicator Architecture
The Adaptive Trend Flow provides a sophisticated framework for assessing market trends through a harmonious blend of EMA dynamics and volatility-based boundary calculations. Unlike traditional moving average systems that use fixed parameters, this indicator incorporates smart volatility measurements to automatically adjust its sensitivity to market conditions. The core algorithm employs a dual EMA system combined with standard deviation-based volatility bands, creating a self-adjusting mechanism that expands and contracts based on market volatility. This adaptive approach allows the indicator to maintain its effectiveness across different market phases - from ranging to trending conditions. The volatility-adjusted bands act as dynamic support and resistance levels, while the gradient visualization system provides instant visual feedback on trend strength and duration.
📊 Technical Composition and Calculation
The Adaptive Trend Flow is composed of several technical components that create a dynamic trending system:
Dual EMA System: Utilizes fast and slow EMAs for primary trend detection
Volatility Integration: Computes and smooths volatility for adaptive band calculation
Dynamic Band Generation: Creates volatility-adjusted boundaries for trend validation
Gradient Visualization: Provides progressive visual feedback on trend strength
📈 Key Indicators and Features
The Adaptive Trend Flow utilizes customizable length parameters for both EMAs and volatility calculations to adapt to different trading styles. The trend detection component evaluates price action relative to the dynamic bands to validate signals and identify potential reversals.
The indicator incorporates multi-layered visualization with:
Color-coded basis and trend lines (bullish/bearish)
Adaptive volatility-based bands
Progressive gradient background for trend duration
Clear trend reversal signals (𝑳/𝑺)
Smooth fills between key levels
Programmable alerts for trend changes
⚡️ Practical Applications and Examples
✅ Add the Indicator: Add the indicator to your TradingView chart by clicking on the star icon to add it to your favorites ⭐️
👀 Monitor Trends: Watch the basis line and trend band interactions to identify trend direction and strength. The gradient background intensity indicates trend duration and conviction.
🎯 Track Signals: Pay attention to the trend reversal markers that appear on the chart:
→ Long signals (𝑳) appear when price action confirms a bullish trend reversal
→ Short signals (𝑺) indicate validated bearish trend reversals
🔔 Set Alerts: Configure alerts for trend changes in both bullish and bearish directions, ensuring you never miss significant technical developments.
🌟 Summary and Tips
The Adaptive Trend Flow by QuantAlgo is a sophisticated technical tool designed to support trend-following strategies across different market environments and asset class. By combining dual EMA analysis with volatility-adjusted bands, it helps traders and investors identify significant trend changes while filtering out market noise, providing validated signals. The tool's adaptability through customizable EMA lengths, volatility smoothing, and sensitivity settings makes it suitable for various trading timeframes and styles, allowing users to capture trending opportunities while maintaining protection against false signals.
Key parameters to optimize for your trading and/or investing style:
Main Length: Adjust for more or less sensitivity to trend changes (default: 10)
Smoothing Length: Fine-tune volatility calculations for signal stability (default: 14)
Sensitivity: Balance band width for trend validation (default: 2.0)
Visual Settings: Customize appearance with color and display options
The Adaptive Trend Flow is particularly effective for:
Identifying sustained market trends
Detecting trend reversals with confirmation
Measuring trend strength and duration
Filtering out market noise and false signals
Remember to:
Allow the indicator to validate trend changes before taking action
Use the gradient background to gauge trend strength
Combine with volume analysis for additional confirmation
Consider multiple timeframes for a complete market view
Adjust sensitivity based on market volatility conditions

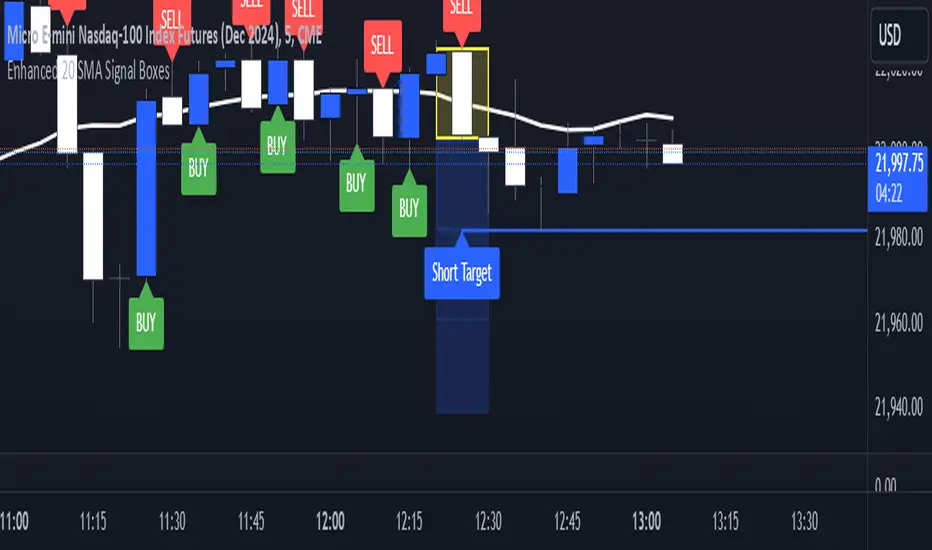
Enhanced 20 SMA Signal BoxesEnhanced 20 SMA Signal Boxes
This indicator leverages the 20-period Simple Moving Average (SMA) to generate clear and actionable trading signals. Designed for traders looking to streamline their entry and exit decisions, the script provides a visual hierarchy with dynamic signal boxes and target levels.
Features:
Buy & Sell Signals:
Automatically detects when the price crosses above or below the 20 SMA and marks the signal candle with a yellow box for clear visualization of entry (top of the box) and risk (bottom of the box).
Dynamic Target Levels:
Three blue outlined boxes are generated for each signal to indicate profit-taking levels. The boxes dynamically adjust based on the signal candle’s range and come with customizable labels:
"Long Target" for buy signals
"Short Target" for sell signals
Alert System:
Get notified when the price enters or exits the signal candle or when target levels are reached.
Customization Options:
Adjust SMA color, thickness, and length.
Modify box opacity for better chart visibility.
Edit target labels and positionings to suit your trading style.
Risk/Reward Visualization:
The script calculates and displays the risk/reward ratio visually between the signal candle and the first target box.
Dynamic Styling:
Target boxes feature gradient shades to highlight increasing profit potential, and optional lines connect the signal candle to targets for organized visuals.
This indicator simplifies decision-making by providing clear signals and targets, making it suitable for day traders, swing traders, and scalpers alike.
Wave Surge [UAlgo]The "Wave Surge " is a comprehensive indicator designed to provide advanced wave pattern analysis for market trends and price movements. Built with customizable parameters, it caters to both beginner and advanced traders looking to improve their decision-making process.
This indicator utilizes wave-based calculations, adaptive thresholds, and volume analysis to detect and visualize key market signals. By integrating multiple analysis techniques.
It calculates waves for high, low, and close prices using a configurable moving average (EMA) technique and pairs it with volume and baseline analysis to confirm patterns. The result is a robust framework for identifying potential entry and exit points in the market.
🔶 Key Features
Wave-Based Analysis: This indicator computes waves using exponential moving averages (EMA) of high, low, and close prices, with an adjustable wave period to suit different market conditions.
Customizable Baseline: Traders can select from multiple baseline types, including VWMA (Volume-Weighted Moving Average), EMA, SMA (Simple Moving Average), and HMA (Hull Moving Average), for trend confirmation.
Adaptive Thresholds: The adaptive threshold feature dynamically adjusts sensitivity based on a chosen period, ensuring the indicator remains responsive to varying market volatility.
Volume Analysis: The integrated volume analysis calculates volume ratios and allows traders to enable or disable this feature to refine signal accuracy.
Pattern Recognition: The indicator identifies specific wave patterns (Wave 1, Wave 3, Wave 4, Wave 5, Wave 6) and visually plots them on the chart for easy interpretation.
Visual and Color-Coded Signals: Clear visual signals (upward and downward arrows) are plotted on the chart to highlight potential bullish or bearish patterns. The baseline is color-coded for an intuitive understanding of market trends.
Configuration: Parameters for wave period, baseline length, volume factors, and sensitivity can be tailored to align with the trader’s strategy and market environment.
🔶 Interpreting the Indicator
Wave Patterns
The indicator detects and plots six unique wave patterns based on price changes that exceed an adaptive threshold. These patterns are validated by the direction of the baseline:
Wave 1 (Bullish): Triggered when the price increases above the threshold while the baseline is falling.
Wave 3, 4, and 6 (Bearish): Indicate potential downtrends validated by a rising baseline.
Wave 5 (Bullish): Suggests upward momentum when prices exceed the threshold with a falling baseline.
Baseline Trend
The baseline serves as a trend confirmation tool, dynamically changing color to reflect market direction:
Aqua (Rising): Indicates an upward trend.
Red (Falling): Indicates a downward trend.
Volume Confirmation
When enabled, the volume analysis feature ensures that signals are supported by significant volume movements. Patterns with high volume are considered more reliable.
Signal Visualization
Upward Arrows (🡹): Highlight potential bullish opportunities.
Downward Arrows (🡻): Highlight potential bearish opportunities.
Alerts
Alerts are triggered when key wave patterns are identified, providing traders with timely notifications to take action without being tied to the screen.
🔶 Disclaimer
Use with Caution: This indicator is provided for educational and informational purposes only and should not be considered as financial advice. Users should exercise caution and perform their own analysis before making trading decisions based on the indicator's signals.
Not Financial Advice: The information provided by this indicator does not constitute financial advice, and the creator (UAlgo) shall not be held responsible for any trading losses incurred as a result of using this indicator.
Backtesting Recommended: Traders are encouraged to backtest the indicator thoroughly on historical data before using it in live trading to assess its performance and suitability for their trading strategies.
Risk Management: Trading involves inherent risks, and users should implement proper risk management strategies, including but not limited to stop-loss orders and position sizing, to mitigate potential losses.
No Guarantees: The accuracy and reliability of the indicator's signals cannot be guaranteed, as they are based on historical price data and past performance may not be indicative of future results.

Eze Profit - VWAP + MACD Combined SignalThe Eze Profit - VWAP + MACD Combined Signal is an advanced trading tool designed to help traders align price trends with momentum confirmation for better decision-making. By combining Volume-Weighted Average Price (VWAP) and Moving Average Convergence Divergence (MACD), this indicator provides clear entry and exit signals, allowing traders to follow trends and take advantage of momentum shifts.
How It Works:
VWAP:
VWAP represents the average price of an asset, weighted by volume, over a specific period.
It acts as a dynamic support/resistance level and trend filter. Price above VWAP indicates bullish conditions, while price below VWAP suggests bearish conditions.
MACD:
MACD measures momentum through the difference between fast and slow exponential moving averages (EMAs).
Signals are generated when the MACD line crosses its signal line:
Bullish Crossover: Indicates increasing upward momentum.
Bearish Crossunder: Indicates increasing downward momentum.
Combined Logic:
Long Signal: Triggered when price is above VWAP, and MACD exhibits a bullish crossover.
Short Signal: Triggered when price is below VWAP, and MACD exhibits a bearish crossunder.
The script tracks the trader's "in-position" state to prevent redundant signals and ensure clarity.
How to Use:
Use this script to identify potential long and short trading opportunities:
Buy Signal: Enter a long position when the price moves above VWAP and MACD confirms bullish momentum.
Sell Signal: Exit or short when the price drops below VWAP and MACD confirms bearish momentum.
Combine with additional tools like support/resistance, volume analysis, or candlestick patterns for confirmation.
Features:
VWAP Trend Filter: Dynamically adjusts to the trading session to identify overall trend direction.
MACD Momentum Confirmation: Detects key momentum shifts with configurable settings for fast, slow, and signal lengths.
Position State Tracking: Avoids signal redundancy by monitoring open positions.
Buy/Sell Visualizations: Plots Buy/Sell signals directly on the chart for ease of use.
Alerts: Notifies traders in real-time when a long or short signal is triggered.
Customizable Settings:
MACD Fast Length, Slow Length, and Signal Smoothing parameters.
VWAP timeframe resolution to adapt to different trading styles (e.g., intraday or daily).
Credits:
This script is based on standard VWAP and MACD calculations provided by TradingView’s library and has been enhanced with unique logic for combined signal generation.
Notes:
This indicator is intended for educational purposes and should not be considered financial advice. Use it as part of a broader trading strategy alongside other tools for optimal results.

Moving Average Pullback Signals [UAlgo]The "Moving Average Pullback Signals " indicator is designed to identify potential trend continuation or reversal points based on moving average (MA) pullback patterns. This tool combines multiple types of moving averages, customized trend validation parameters, and candlestick wick patterns to provide reliable buy and sell signals. By leveraging several advanced MA methods (such as TEMA, DEMA, ZLSMA, and McGinley-D), this script can adapt to different market conditions, providing traders with flexibility and more precise trend-based entries and exits. The addition of a gradient color-coded moving average line and wick validation logic enables traders to visualize market sentiment and trend strength dynamically.
🔶 Key Features
Multiple Moving Average (MA) Calculation Methods: This indicator offers various MA calculation types, including SMA, EMA, DEMA, TEMA, ZLSMA, and McGinley-D, allowing traders to select the MA that best fits their strategy.
Trend Validation and Pattern Recognition: The indicator includes a customizable trend validation length, ensuring that the trend is consistent before buy/sell signals are generated. The "Trend Pattern Mode" setting provides flexibility between "No Trend in Progress," "Trend Continuation," and "Both," tailoring signals to the trader’s preferred style.
Wick Validation Logic: To enhance the accuracy of entries, this indicator identifies specific wick patterns for bullish or bearish pullbacks, which signal potential trend continuation or reversal. Wick length and validation factor are adjustable to suit various market conditions and timeframes.
Gradient Color-coded MA Line: This feature provides a quick visual cue for trend strength, with color changes reflecting relative highs and lows of the MA, enhancing market sentiment interpretation.
Alerts for Buy and Sell Signals: Alerts are triggered when either a bullish or bearish pullback is detected, allowing traders to receive instant notifications without continuously monitoring the chart.
Visual Labels for Reversal Points: The indicator plots labels ("R") at potential reversal points, with color-coded labels for bullish (green) and bearish (red) pullbacks, highlighting pullback opportunities that align with the trend or reversal potential.
🔶 Disclaimer
Use with Caution: This indicator is provided for educational and informational purposes only and should not be considered as financial advice. Users should exercise caution and perform their own analysis before making trading decisions based on the indicator's signals.
Not Financial Advice: The information provided by this indicator does not constitute financial advice, and the creator (UAlgo) shall not be held responsible for any trading losses incurred as a result of using this indicator.
Backtesting Recommended: Traders are encouraged to backtest the indicator thoroughly on historical data before using it in live trading to assess its performance and suitability for their trading strategies.
Risk Management: Trading involves inherent risks, and users should implement proper risk management strategies, including but not limited to stop-loss orders and position sizing, to mitigate potential losses.
No Guarantees: The accuracy and reliability of the indicator's signals cannot be guaranteed, as they are based on historical price data and past performance may not be indicative of future results.

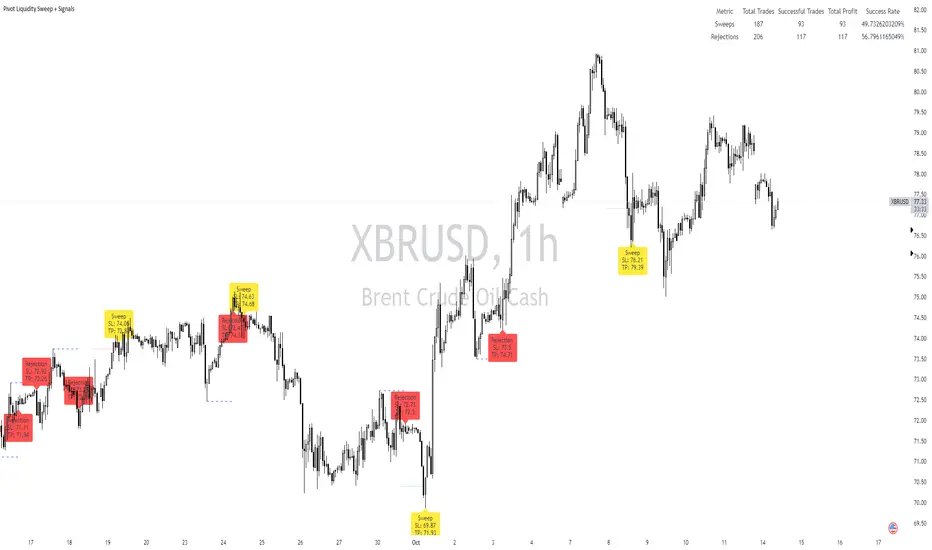
Pivot Liquidity Sweep + SignalsCore Functionalities:
Sweep Signals:
The indicator identifies sweeps of liquidity by detecting when price exceeds recent pivot highs (swing highs) or pivot lows (swing lows) and then reverses direction. It draws attention to these scenarios by labeling them on the chart.
For bullish sweep signals, the entry point is the closing price of the sweep candle, with the stop loss placed at the highest point between the sweep candle and the previous candle.
For bearish sweeps, the entry point is similarly identified, with the stop loss being the lowest price of the sweep candle and the candle before it. The profit target is dynamically set to the low or high of the closest valid pivot depending on the direction of the trade.
Rejection Signals:
Rejection signals are identified when price attempts to break a pivot high or low but fails, causing a rejection.
Bullish rejections involve price trying to break a pivot low but closing back above it, indicating potential for a bounce.
Bearish rejections follow a similar pattern, with price attempting to break a pivot high but failing to hold above it, signaling a potential bearish move.
High-Precision Intrabar Data:
The "Intrabar Precision" feature allows the indicator to use lower timeframe data to accurately plot sweeps and rejections, providing traders with precise entry and exit points.
The intrabar settings are particularly useful for traders looking for high-precision trades, such as scalpers who want to capture small yet consistent moves.
ATR and Percentage-Based Filters:
The indicator allows for customizable filters to ensure signals meet certain thresholds before being validated. Traders can use ATR (Average True Range) or percentage-based conditions to filter out low-quality signals, ensuring that the trades captured have enough volatility or price movement potential.
Dashboard:
The built-in dashboard provides a quick overview of trades executed using the indicator, displaying metrics such as the total number of sweep and rejection trades, their success rates, and total profit in points.
The dashboard is color-coded for easy reading and offers traders insights into the overall performance of their strategy, helping with ongoing evaluation and optimization.
Labeling and Alerts:
Every time a sweep or rejection signal is detected, the indicator automatically labels the chart to help traders quickly identify the trading opportunities.
Alerts are also generated for each trading signal, providing the trader with real-time notifications, which can be useful for those who are not constantly monitoring their charts.
Stop Loss and Target Adaptation:
The stop loss levels are adjusted dynamically based on the recent pivot points, and the target profit is derived from valid subsequent pivot levels to ensure realistic and efficient trade exits.
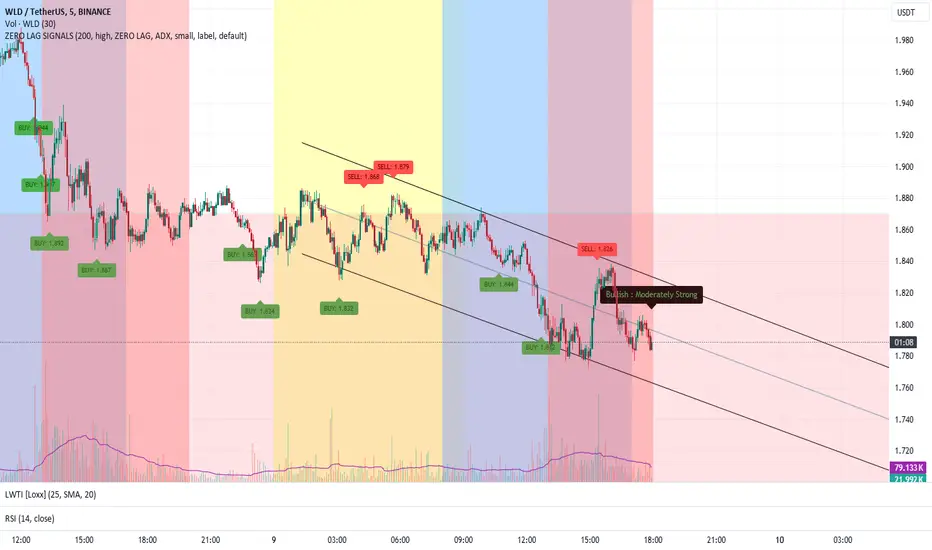
ZERO LAG TRADE SIGNALS by BootcampZeroThe ZERO LAG TRADE SIGNALS by BootcampZero indicator is a versatile tool designed to help traders identify optimal entry and exit points for both short-term scalping and long-term trading across multiple time frames. It combines several well-known technical analysis methods, including moving averages, trend analysis, directional indicators, and adaptive trend calculations, to deliver reliable buy and sell signals.
Short-Term Scalping (Under 5-Minute Time Frames)
For short-term traders who prefer quick trades on lower time frames, such as under 5 minutes, this indicator uses a combination of the EMA (Exponential Moving Average) and SMA (Simple Moving Average) to spot fast trend reversals. The indicator is particularly useful for scalpers because it focuses on detecting short-term price momentum by comparing the faster-moving averages with slower ones, triggering signals based on their crossover.
Buy Signals are generated when a fast-moving EMA crosses above a slower-moving SMA, indicating upward momentum.
Sell Signals are triggered when the fast-moving EMA crosses below the slower-moving SMA, signaling potential downward price movement.
In addition, the Adaptive Trend Finder feature dynamically adjusts to recent price deviations and volatility, making it easier for scalpers to spot the prevailing short-term trend with high confidence. The indicator also uses ADX (Average Directional Index) for momentum confirmation, ensuring that signals are only generated during strong price trends, reducing false positives in sideways markets.
Long-Term Trading (Above 1-Day Charts)
When applied to higher time frames such as daily charts or above, this indicator excels in generating reliable long-term buy and sell signals, perfect for swing traders and long-term investors. The Kaufman Adaptive Moving Average (KAMA) and the Ichimoku Cloud are used to assess long-term trends by filtering out market noise and focusing on sustainable price direction.
KAMA helps to adapt the moving average based on market volatility, providing smoother signals that minimize whipsawing in longer-term trades.
Ichimoku Cloud provides additional trend confirmation by identifying whether the market is bullish or bearish based on the relationship between key lines like the Tenkan-Sen (Conversion Line) and Kijun-Sen (Base Line), and how the current price interacts with the Ichimoku Cloud itself.
The indicator also integrates PPO (Percentage Price Oscillator) to capture divergences between price and momentum, further supporting traders in holding positions for extended periods when the signal strength is robust.
Key Technical Values and Factors for Signals
EMA and SMA Crossover: Fast EMA vs. Slow SMA to detect short-term trend reversals.
ADX: Helps gauge the strength of the trend; signals are only generated in trending markets.
KAMA: Filters noise in long-term trends, providing smooth signals based on market volatility.
Ichimoku Cloud: Offers insight into long-term trends and momentum by analyzing price relative to the cloud.
PPO: Detects divergences between price and momentum for trend continuation or reversal signals.
How It Works
Buy signals are generated when bullish conditions are met, and the indicator confirms momentum with ADX, crossover of the EMAs, or a bullish breakout from the Ichimoku Cloud.
Sell signals are triggered when bearish conditions prevail, confirmed by the same factors in reverse, such as a bearish EMA crossover or weakness in ADX.
By combining these powerful tools, ZERO LAG TRADE SIGNALS by BootcampZero offers traders a comprehensive system for both quick scalping trades and more conservative long-term positioning, providing reliable and adaptive signals across different market conditions.
US Sentiment Index [CryptoSea]The US Sentiment Index is an advanced analytical tool designed for traders seeking to uncover patterns, correlations, and potential leading signals across key market tickers. This indicator surpasses traditional sentiment measures, providing a data-driven approach that offers deeper insights compared to conventional indices like the Fear and Greed Index.
Key Features
Multi-Ticker Analysis: Integrates data from a diverse set of market indicators, including gold, S&P 500, U.S. Dollar Index, Volatility Index, and more, to create a comprehensive view of market sentiment.
Customisable Sensitivity Settings: Allows users to adjust the moving average period to fine-tune the sensitivity of sentiment calculations, adapting the tool to various market conditions and trading strategies.
Detailed Sentiment Scaling: Utilises a 0-100 scale to quantify sentiment strength, with colour gradients that visually represent bearish, neutral, and bullish conditions, aiding in quick decision-making.
Below is an example where the sentiment index can give leading signals. We see a first sign of wekaness in the index as it drops below its moving average. Shortly after we see it dip below our median 50 level, another sign of weakeness. We see the SPX price action to take a hit following the sentiment index decrease.
Tickers Used and Their Impact on Sentiment
The impact of each ticker on sentiment can be bullish or bearish, depending on their behaviour:
Gold (USGD): Typically seen as a safe-haven asset, rising gold prices often indicate increased market fear or bearish sentiment. Conversely, falling gold prices can signal reduced fear and a shift towards bullish sentiment in riskier assets.
S&P 500 (SPX): A rising S&P 500 is usually a sign of bullish sentiment, reflecting confidence in economic growth and market stability. A decline, however, suggests bearish sentiment and a potential move towards risk aversion.
U.S. Dollar Index (DXY): A strengthening U.S. Dollar can be a sign of fear as investors seek safety in the dollar, which is bearish for risk assets. A weakening dollar, on the other hand, can signal bullish sentiment as capital flows into riskier assets.
Volatility Index (VIX): Known as the "fear gauge," a rising VIX indicates increased market fear and bearish sentiment. A falling VIX suggests a calm, bullish market environment.
Junk Bonds (JNK): Rising junk bond prices often reflect bullish sentiment as investors take on more risk for higher returns. Conversely, falling junk bond prices signal increased fear and bearish sentiment.
Long-Term Treasury Bonds (TLT): Higher prices for long-term treasuries usually indicate a flight to safety, reflecting bearish sentiment. Lower prices suggest a shift towards riskier assets, indicating bullish sentiment.
Financial Sector ETF (XLF): Strength in the financial sector is typically bullish, indicating confidence in economic conditions. Weakness in this sector can reflect bearish sentiment and concerns about financial stability.
Unemployment Rate (USUR): A rising unemployment rate is a bearish signal, indicating economic weakness. A declining unemployment rate is bullish, reflecting economic strength and job growth.
U.S. Interest Rates (USINTR, USIRYY): Higher interest rates can be bearish, as they increase borrowing costs and reduce spending. Lower rates are generally bullish, promoting economic growth and risk-taking.
How it Works
Sentiment Calculation: The US Sentiment Index combines data from multiple tickers, calculating sentiment by scaling the distance from their respective moving averages. Each asset's behaviour is interpreted within the context of market fear or greed, providing a refined sentiment reading that adjusts dynamically.
Market Strength Analysis: When the index is above 50 and also above its moving average, it indicates particularly strong or bullish market conditions, driven by greed. Conversely, when the index is below 50 and under its moving average, it signals bearish or weak market conditions, associated with fear.
Correlation and Pattern Detection: The indicator analyses correlations among the included assets to detect patterns that might signal potential market movements, giving traders a leading edge over simpler sentiment measures.
Adaptive Background Colouring: Utilises a colour gradient that dynamically adjusts based on sentiment values, highlighting extreme fear, neutral, and extreme greed levels directly on the chart.
Flexible Display Options: Offers settings to toggle the moving average plot and adjust its period, giving users the ability to tailor the indicator's sensitivity and display to their specific needs.
In this example below, we can see the Sentiment rise above the Moving Average (MA). Price action goes on to follow this, although there is an instance where it dips below the MA, it quickly rises back above again as a sign of strength.
Another way you can use this index is by simply using the MA, if its trending up, we know the macro sentiment is bullish.
Application
Data-Driven Insights: Offers traders a detailed, data-driven approach to sentiment analysis, incorporating a broad spectrum of market indicators to deliver actionable insights.
Pattern Recognition: Helps identify patterns and correlations that may lead to market reversals or continuations, providing a nuanced view that goes beyond simple sentiment gauges.
Enhanced Decision-Making: Equips traders with a robust tool to validate trading strategies and make informed decisions based on comprehensive sentiment analysis.
The US Sentiment Index by is an essential addition to the toolkit of any trader looking to navigate market complexities with precision and confidence. Its advanced features and data-driven approach offer unparalleled insights into market sentiment, setting it apart from conventional sentiment indicators.

Auto Signal Buy/SellAuto Signal Buy/Sell with Time Filter and Dynamic ZLEMA (GMT+2) 🌟
Are you looking for an indicator that combines efficiency and simplicity while integrating advanced elements like SuperTrend, ZLEMA (Zero Lag EMA), and a MACD DEMA for clear and precise buy/sell signals? 📈 Introducing Auto Signal Buy/Sell, the ultimate indicator designed for intraday and swing traders, optimized for market hours in GMT+2.
🛠️ Key Features:
- **Advanced SuperTrend**: Follow the dominant trend with a robust SuperTrend, adjustable to your preferences (customizable multiplier and period).
- **Dynamic ZLEMA**: Get a zero-lag EMA curve with a visual signal. Additionally, the ZLEMA turns blue when it’s nearly flat, helping you easily spot market consolidation phases.
- **MACD DEMA**: An enhanced version of the traditional MACD, using the Double EMA to capture more responsive buy/sell cross signals. 📊
- **Buy/Sell Signals**: Visual arrows clearly indicate potential entry and exit points on your chart, filtered by MACD crossovers and the SuperTrend trend.
- **Smart Time Filter (GMT+2)**: This script adapts to trading hours (customizable) and only displays signals during trading hours. The background turns light blue when the market is closed, preventing confusion during inactivity periods. 🕒
⚙️ Full Customization:
- Adjustable trading hours (default 9 AM to 5 PM in GMT+2) with dynamic background indicating when markets are closed.
- Flexible settings for SuperTrend, ZLEMA, and MACD DEMA to suit any strategy.
🎯 Why Choose This Indicator?
- Optimized for maximum precision with advanced algorithms like ZLEMA and DEMA.
- Easy to use: it provides clear, visual signals directly on the chart—no need to decipher complex indicators.
- A complete intraday and swing indicator that combines trend analysis and signal filtering with precise market hours.
🚀 Boost Your Trading!
Add this indicator to your toolkit and enhance your decision-making. Thanks to its intuitive interface and clear visual signals, you can trade with confidence. 💡
Don't forget to like 👍 and comment if you find this indicator useful! Your feedback helps us continue improving such tools. 🚀
📌 How to Use:
1. Add the indicator to your chart.
2. Adjust the SuperTrend and ZLEMA settings to suit your needs.
3. Follow the buy/sell signals and watch for the light blue background outside of trading hours.
4. Trade effectively and stay in control, even during consolidation phases.

VWAP and MA Crossover SignalsDescription: The VWAP and 20 MA Crossover Indicator is a powerful trading tool designed to capitalize on trend reversals and momentum shifts. This indicator overlays two key technical analysis tools on the price chart: the Volume Weighted Average Price (VWAP) and the 20-period Moving Average (MA).
Functionality:
VWAP: Represents the average price a security has traded at throughout the day, based on volume and price. It is a measure of the market's trend and trading volume.
20 MA: Offers a smoothed average of the closing prices over the last 20 periods, providing a glimpse of the underlying trend.
Signals:
Buy Signal: Generated when the VWAP crosses above the 20-period MA, suggesting an upward momentum and a potential bullish trend reversal.
Sell Signal: This occurs when the VWAP crosses below the 20-period MA, indicating a downward momentum and a potential bearish trend reversal.
Usage: This indicator is ideal for traders focusing on intraday and swing trading strategies, providing clear visual cues for entry and exit points based on the interaction between VWAP and the 20 MA. By identifying key crossover points, traders can make informed decisions about potential bullish or bearish movements in the market.
Application: To use this indicator, simply add it to your TradingView chart setup. The buy and sell signals will be displayed directly on the chart, allowing for easy interpretation and quick action. Adjust the settings to fit your specific trading strategy or market conditions.

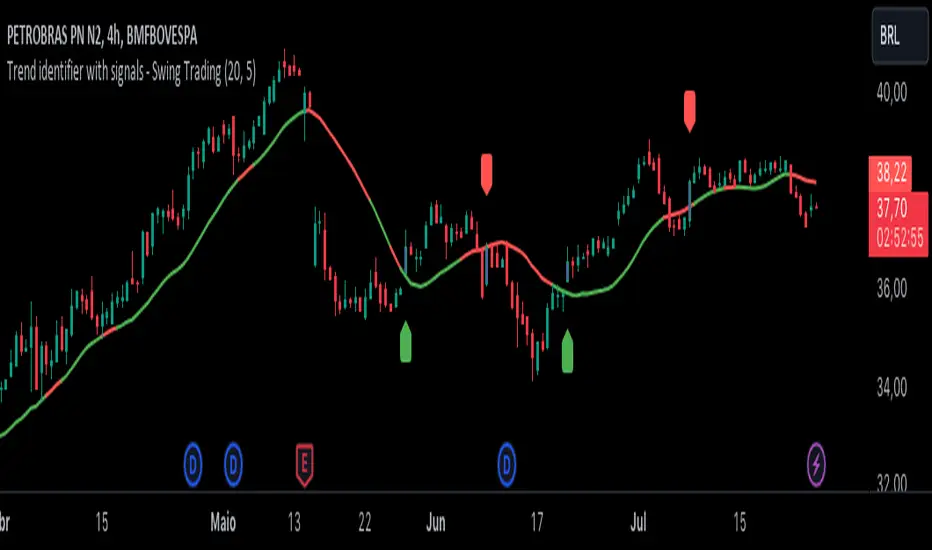
Trend identifier with signals - Swing TradingIndicator Objective
The "Trend identifier with signals - Swing Trading" indicator is designed to help traders identify market trends and provide clear visual signals for potential buy and sell points based on the interaction of price with the 20-period moving average.
How the Indicator Works
20-Period Moving Average:
The indicator calculates the 20-period simple moving average (SMA), which is a common tool for smoothing out price fluctuations and identifying the overall market direction.
The moving average is plotted on the chart, changing color according to the identified trend:
Green: Indicates an uptrend.
Red: Indicates a downtrend.
Gray: Indicates a neutral or undefined market condition.
Trend Identification on the Daily Chart:
The indicator checks the trend based on an adjustable period (default is 5 periods):
Uptrend: When the short-term moving average (5 periods) is above the long-term moving average (10 periods).
Downtrend: When the short-term moving average (5 periods) is below the long-term moving average (10 periods).
Signal for Touching the Moving Average:
When the price crosses the 20-period moving average, the candles are colored purple to indicate that there was a touch on the moving average.
This helps identify critical points where the price may reverse or continue its trend.
Trend Signal:
Green Flag: Appears below the candle when there is a touch on the moving average and the trend is up, suggesting a potential buy point.
Red Flag: Appears above the candle when there is a touch on the moving average and the trend is down, suggesting a potential sell point.
Lateral Zone Identification:
The indicator also checks if the price touched the moving average for 5 consecutive candles, indicating a possible consolidation or lateral zone.
If this occurs, a message "Possible Lateral Zone" is shown on the chart, helping the trader avoid trades in a market without a clear direction.
How the Indicator Helps Traders
Clear Trend Identification:
By changing the color of the moving average according to the trend (green for up, red for down), the indicator provides a clear visualization of market direction.
This allows traders to align their trades with the prevailing trend, increasing the probability of success.
Visual Buy and Sell Signals:
The green and red flags provide direct visual signals for potential entry and exit points, based on the interaction of price with the moving average.
This is particularly useful for novice traders who may struggle to identify these points on their own.
Risk Management and Trade Planning:
Identifying lateral zones helps traders avoid trading in trendless markets, where price movements are more unpredictable.
This improves risk management and allows traders to focus on more favorable opportunities.
Turbo Oscillator [RunRox]Introducing Turbo Oscillator by RunRox, our new indicator that combines a multitude of useful and unique features, which we will detail in this post.
List of Advanced Technologies:
Real-Time Divergences: Detects discrepancies between price movements and oscillator indicators to forecast potential price reversals.
Real-Time Hidden Divergences: We identify hidden divergences in real-time. These are not the standard type of divergences; they are opposite to regular divergences, providing unique insights into potential market movements.
Overbought and Oversold Zones: Identifies areas where the market is potentially overextended, suggesting possible entry and exit points.
Signal Line: Indicates the market direction, helping traders to quickly understand current trends.
Money Flow Histogram: Shows the flow of money into and out of the market, providing insights into buying and selling pressure.
Predicted Reversal Zones: Pinpoints areas where the market might experience reversals, aiding in strategic planning and risk management. These zones also serve as potential areas for taking profits, enhancing their utility for exit strategy planning.
Customizable Alerts: You can flexibly set up alerts for any events detected by our indicator, ensuring you stay informed about critical market movements.
To begin with, I would like to describe the difference between classic divergences and hidden divergences.
As you can see, these are opposite situations. Our oscillator identifies both types of divergences and displays them in real-time.
Divergences can serve as points where the price might reverse in the opposite direction, making both classic and hidden divergences powerful tools for spotting reversal points. I'll show a few examples of how divergences are used in our oscillator.
Classic Divergences - which we identify in real-time. As you can see, the price often reacts strongly to the formation of these divergences, frequently changing its direction.
Hidden Divergences - we also observe frequent movement in the opposite direction on the chart. The advantage of our indicator is that we show divergences in real-time without delays, allowing you to react immediately to trend changes.
Overbought and Oversold Zones - These zones allow you to see trend changes when the price is clearly overbought or oversold. When the color changes from a contrasting shade to a neutral one, you can observe the trend shift. The lines work by combining the positivity/negativity of the histogram, the positivity/negativity of the signal line, and the direction of the signal line (red/green). This sophisticated interaction provides precise insights into market conditions, making it an invaluable tool for traders.
Signal Line - This provides insights into trend changes and price reversals. The points on the line better indicate the beginning of a trend shift. These points can vary in size, offering a clearer understanding of the strength of the emerging trend. This feature works in combination with RSI, Stochastic, and MFI. RSI and MFI are top-tier indicators, while Stochastic adds responsiveness and sensitivity to trend changes, ensuring you capture every market movement accurately and promptly.
Money Flow Histogram - As shown in the example, our histogram displays the divergence between money flow and the actual price. You can see that while the price is rising, the money flow is decreasing, indicating insufficient demand for the asset and an imminent trend change. This feature uses MFI with an extended period, providing a more comprehensive and accurate analysis of market conditions. The extended period enhances the reliability of the Money Flow Index, making it an essential tool for identifying subtle shifts in market dynamics.
Predicted Reversal Zones - We automatically identify potential price reversal zones and display them above our overbought and oversold zones. In cases of strong overbought or oversold conditions, we detect potential price pullbacks and mark the beginning of a trend change. This helps you better identify trend shifts. We recommend considering these zones as potential take profit points for your trades.
Customizable Alerts - Our flexible alert system allows you to receive notifications only for the events you are interested in. These can include:
1. Classic Divergences
2. Hidden Divergences
3. Overbought or Oversold conditions on the status line
4. Strong Overbought or Oversold conditions on the status line
5. Signals from the signal line
6. Reversal zones in any direction
Our oscillator is a unique indicator that provides a comprehensive understanding of price movements. It can be used as a standalone tool for analyzing price action.
Here are a few examples of using our Oscillator in practice:
In the example above, you can see three conditions that have formed for a potential trade:
1. Clear overbought condition with a formed reversal point.
2. Decreasing Money Flow Index diverging from the rising price.
3. Formed classic divergence.
The entry point could be the formed divergence, while the exit point could be the overbought condition at the bottom of the oscillator along with the reversal points.
Here's another example of using hidden divergence, where you can see three conditions for a potential trade:
1. Overbought zone
2. Formed hidden divergence
3. Start of bearish movement indicated by the signal line
You can enter the trade either when the hidden divergence forms or wait for confirmation of the trend change by the signal line and enter the trade when the corresponding signal forms on the signal line. The exit point could be the opposite reversal point or the formation of a new hidden divergence.
We have demonstrated a few examples of how you can use our indicator, but we are confident that you will find many more applications in your own strategies.
Oscillator offers a variety of customizable parameters to tailor the indicator to your trading preferences. Here’s what our settings include:
Signal Line
Turn On/Off: Enable or disable the signal line.
Length: Set the length period for the signal line calculation.
Smooth: Adjust the smoothing level of the signal line for more accurate display.
Histogram
Turn On/Off: Enable or disable the histogram.
Length: Set the length period for the histogram calculation.
Smooth: Adjust the smoothing level of the histogram.
Other
Show Divergence Line: Display divergence lines on the chart.
Show Hidden Divergence: Display hidden divergences.
Show Status Line: Show the status line indicating overbought or oversold conditions.
Show TP Signal: Display signals for take profit.
Show Reversal Points: Display potential trend reversal points.
Delete Broken Divergence Lines: Remove broken divergence lines from the chart.
Alerts Customization
Signal Line Bull/Bear: Set alerts for bullish or bearish signals from the signal line.
TP Bull/Bear: Set alerts for take profit signals.
Status Bull/Bear: Set alerts for bullish or bearish status conditions.
Status Bull+/Bear+: Set enhanced alerts for stronger bullish or bearish status conditions.
Divergence Bull/Bear: Set alerts for bullish or bearish divergences.
Hidden Divergence Bull/Bear: Set alerts for hidden bullish or bearish divergences.
With these comprehensive settings, you can fine-tune the Oscillator to perfectly fit your trading strategy and preferences.
Our indicator utilizes technologies such as RSI, Stochastic, and Money Flow Index, with numerous enhancements from our team. It includes exclusive features such as real-time detection of hidden and classic divergences, identification of reversal points using our unique methodology, and much more.
Disclaimer:
While we consider our Turbo Oscillator to be an excellent tool, it is important to understand that past performance is not indicative of future results. We recommend approaching market analysis comprehensively, using a combination of tools and techniques to make well-informed trading decisions. Always consider the full range of market data and risks when using any trading indicator.

Advanced MACD [CryptoSea]Advanced MACD (AMACD) enhances the traditional MACD indicator, integrating innovative features for traders aiming for deeper insights into market momentum and sentiment. It's crafted for those seeking to explore nuanced behaviors of the MACD histogram, thus offering a refined perspective on market dynamics.
Divergence moves can offer insight into continuation or potential reversals in structure, the example below is a clear continuation signal.
Key Features
Enhanced Histogram Analysis: Precisely tracks movements of the MACD histogram, identifying growth or decline periods, essential for understanding market momentum.
High/Low Markers: Marks the highest and lowest points of the histogram within a user-defined period, signaling potential shifts in the market.
Dynamic Averages Calculation: Computes average durations of histogram phases, providing a benchmark against historical performance.
Color-Coded Histogram: Dynamically adjusts the histogram's color intensity based on the current streak's duration relative to its average, offering a visual cue of momentum strength.
Customisable MACD Settings: Enables adjustments to MACD parameters, aligning with individual trading strategies.
Interactive Dashboard: Showcases an on-chart table with average durations for each phase, aiding swift decision-making.
Settings & Customisation
MACD Settings: Customise fast length, slow length, and signal smoothing to tailor the MACD calculations to your trading needs.
Reset Period: Determine the number of bars to identify the histogram's significant high and low points.
Histogram High/Lows: Option to display critical high and low levels of the histogram for easy referencing.
Candle Colours: Select between neutral or traditional candle colors to match your analytical preferences.
When in strong trends, you can use the average table to determine when to look to get into a position. This example we are in a strong downtrend, we then see the histogram growing above the average in these conditions which is where we should look to get into a shorting position.
Strategic Applications
The AMACD serves not just as an indicator but as a comprehensive analytical tool for spotting market trends, momentum shifts, and potential reversal points. It's particularly useful for traders to:
Spot Momentum Changes Utilise dynamic coloring and streak tracking to alert shifts in momentum, helping anticipate market movements.
Identify Market Extremes Use high and low markers to spot potential market turning points, aiding in risk management and decision-making.
Alert Conditions
Above Average Movement Alerts: Triggered when the duration of the MACD histogram's growth or decline is unusually long, these alerts signal sustained momentum:
Above Zero: Alerts for both growing and declining movements above zero, indicating either continued bullish trends or potential bearish reversals.
Below Zero: Alerts for growth and decline below zero, pointing to potential bullish reversals or confirmed bearish trends.
High/Low Break Alerts: Activated when the histogram reaches new highs or falls to new lows beyond the set thresholds, these alerts are crucial for identifying shifts in market dynamics:
Break Above Last High: Indicates a potential upward trend as the histogram surpasses recent highs.
Break Below Last Low: Warns of a possible downward trend as the histogram drops below recent lows.
These alert conditions enable traders to automate part of their market monitoring or potential to automate the signals to take action elsewhere.
Johnny's Adjusted BB Buy/Sell Signal"Johnny's Adjusted BB Buy/Sell Signal" leverages Bollinger Bands and moving averages to provide dynamic buy and sell signals based on market conditions. This indicator is particularly useful for traders looking to identify strategic entry and exit points based on volatility and trend analysis.
How It Works
Bollinger Bands Setup: The indicator calculates Bollinger Bands using a specified length and multiplier. These bands serve to identify potential overbought (upper band) or oversold (lower band) conditions.
Moving Averages: Two moving averages are calculated — a trend moving average (trendMA) and a long-term moving average (longTermMA) — to gauge the market's direction over different time frames.
Market Phase Determination: The script classifies the market into bullish or bearish phases based on the relationship of the closing price to the long-term moving average.
Strong Buy and Sell Signals: Enhanced signals are generated based on how significantly the price deviates from the Bollinger Bands, coupled with the average candle size over a specified lookback period. The signals are adjusted based on whether the market is bullish or bearish:
In bullish markets, a strong buy signal is triggered if the price significantly drops below the lower Bollinger Band. Conversely, a strong sell signal is activated when the price rises well above the upper band.
In bearish markets, these signals are modified to be more conservative, adjusting the thresholds for triggering strong buy and sell signals.
Features:
Flexibility: Users can adjust the length of the Bollinger Bands and moving averages, as well as the multipliers and factors that determine the strength of buy and sell signals, making it highly customizable to different trading styles and market conditions.
Visual Aids: The script vividly plots the Bollinger Bands and moving averages, and signals are visually represented on the chart, allowing traders to quickly assess trading opportunities:
Regular buy and sell signals are indicated by simple shapes below or above price bars.
Strong buy and sell signals are highlighted with distinctive colors and placed prominently to catch the trader's attention.
Background Coloring: The background color changes based on the market phase, providing an immediate visual cue of the market's overall sentiment.
Usage:
This indicator is ideal for traders who rely on technical analysis to guide their trading decisions. By integrating both Bollinger Bands and moving averages, it provides a multi-faceted view of market trends and volatility, making it suitable for identifying potential reversals and continuation patterns. Traders can use this tool to enhance their understanding of market dynamics and refine their trading strategies accordingly.

Alert Sender Library [TradingFinder]Library "AlertSenderLibrary_TradingFinder"
🔵 Introduction
The "Alert Sender Library" is a management and production program for "Alert Messages" that enables the creation of unique messages for any type of signal generated by indicators or strategies.
These messages include the direction of the signal, symbol, time frame, the date and time the condition was triggered, prices related to the signal, and a personal message from you. To make better and more optimal use of this "library", you should carefully study " Key Features" and "How to Use".
🔵 Key Features
Automatic Detection of Appropriate Type :
Using two parameters, "AlertType" and "DetectionType", which you must enter at the beginning into the "AlertSender" function, the type of the alert message is determined.
For example, if you select one of the "DetectionType"s such as "Order Block Signal", "Signal", and "Setup", your alert type will be chosen based on "Long" and "Short". Whether it's "Long" or "Short" depends on the "AlertType" you have set to either "Bullish" or "Bearish".
Automatic Symbol Detection :
Whenever you add an alert for a specific symbol, if you want the name of that symbol to be in your message text, you must manually write the name of the symbol in your message. One of the capabilities of the "Alert Sender" is the automatic detection of the symbol and adding it to the message text.
Automatic Time Frame Detection :
When adding your alert, the "Alert Sender" detects the time frame of the symbol you intend to add the alert for and adds it to the text. This feature is very practical and can prevent traders from making mistakes.
For example, a trader might add alerts for a specific symbol using a specific indicator in different time frames, taking the main signal in the 1-hour time frame and only a confirmation signal in the 15-minute time frame. This feature helps to identify in which time frame the signal is set.
Detection of Date and Time When the Signal is Triggered :
You can have the date and time at the moment the message is sent. This feature has various uses. For example, if you use the Webhook URL feature to send messages to a Telegram channel, there might be issues with alert delivery on your server, causing delays, and you might receive the message when it has lost its validity.
With this feature, you can match the sending time of the message from TradingView with the receipt time in your messenger and detect if there is a delay in message delivery.
Important :
You can also set the Time Zone you wish to receive the date and time based on.
Display of "Key Prices" :
Key prices can vary based on the type of signals. For example, when the "DetectionType" is in "Order Block Signal" mode, the key prices are the "Distal" and "Proximal" prices. Or if the "DetectionType" is in "Setup" mode, the key prices are "Entry", "Stop Loss", and "Take Profit".
Receipt of Personal "Messages" :
You can enter your personal message using "input.string" or "input.text_area" in addition to the messages that are automatically created.
Beautiful and Functional Display of Messages :
The titles of messages sent by "AlertSender" are displayed using related emojis to prevent mistakes due to visual errors, enhancing beauty.
🔵 How to Use
🟣 Familiarity with Function and Parameters
AlertSender(Condition, Alert, AlertName, AlertType, DetectionType, SetupData, Frequency, UTC, MoreInfo, Message, o, h, l, c, Entry, TP, SL, Distal, Proximal)
Parameters:
- Condition (bool)
- Alert (string)
- AlertName (string)
- AlertType (string)
- DetectionType (string)
- SetupData (string)
- Frequency (string)
- UTC (string)
- MoreInfo (string)
- Message (string)
- o (float)
- h (float)
- l (float)
- c (float)
- Entry (float)
- TP (float)
- SL (float)
- Distal (float)
- Proximal (float)
To add "Alert Sender Library", you must first add the following code to your script.
import TFlab/AlertSenderLibrary_TradingFinder/1
🟣 Parameters
"Condition" : This parameter is a Boolean. You need to set it based on the condition that, when met (or fired), you want to receive an alert. The output should be either "true" or "false".
"Alert" : This parameter accepts one of two inputs, "On" or "Off". If set to "On", the alarm is active; if "Off", the alarm is deactivated. This input is useful when you have numerous alerts in an indicator or strategy and need to activate only a few of them. "Alert" is a string parameter.
Alert = input.string('On', 'Alert', , 'If you turn on the Alert, you can receive alerts and notifications after setting the "Alert".', group = 'Alert')
"AlertName" : This is a string parameter where you can enter the name you choose for your alert.
AlertName = input.string('Order Blocks Finder ', 'Alert Name', group = 'Alert')
"AlertType" : The inputs for this parameter are "Bullish" or "Bearish". If the condition selected in the "Condition" parameter is of a bullish bias, you should set this parameter to "Bullish", and if the condition is of a bearish bias, it should be set to "Bearish". "AlertType" is a string parameter.
"DetectionType" : This parameter's predefined inputs include "Order Block Signal", "Signal", "Setup", and "Analysis". You may provide other inputs, but some functionalities, like "Key Price", might be lost. "DetectionType" is a string parameter.
"SetupData" :
If "DetectionType" is set to "Setup", you must specify "SetupData" as either "Basic" or "Full". In "Basic" mode, only the "Entry" price needs to be defined in the function, and "TP" (Take Profit) and "SL" (Stop Loss) can be any number or NA. In "Full" mode, you need to define "Entry", "SL", and "TP". "Setup" is a string parameter.
"Frequency" : This string parameter defines the announcement frequency. Choices include: "All" (activates the alert every time the function is called), "Once Per Bar" (activates the alert only on the first call within the bar), and "Once Per Bar Close" (the alert is activated only by a call at the last script execution of the real-time bar upon closing). The default setting is "Once per Bar".
Frequency = input.string('Once Per Bar', 'Message Frequency', , 'The triggering frequency. Possible values are: All (all function calls trigger the alert), Once Per Bar (the first function call during the bar triggers the alert), Per Bar Close (the function call triggers the alert only when it occurs during the last script iteration of the real-time bar, when it closes). The default is alert.freq_once_per_bar.', group = 'Alert')
"UTC" : With this parameter, you can set the Time Zone for the date and time of the alert's dispatch. "UTC" is a string parameter and can be set as "UTC-4", "UTC+1", "UTC+9", or any other Time Zone.
UTC = input.string('UTC', 'Show Alert time by Time Zone', group = 'Alert')
"MoreInfo" : This parameter can take one of two inputs, "On" or "Off", which are strings. Additional information, including "Time" and "Key Price", is included. If set to "On", this information is received; if "Off", it is not displayed in the sent message.
MoreInfo = input.string('On', 'Display More Info', , group = 'Alert')
"Message" : This parameter captures the user's personal message through an input and displays it at the end of the sent message. It is a string input.
MessageBull = input.text_area('Long Position', 'Long Signal Message', group = 'Alert') MessageBear = input.text_area('Short Position', 'Short Signal Message', group = 'Alert')
"o" (Open Price): A floating-point number representing the opening price of the candle. This input is necessary when the "DetectionType" is set to "Signal". Otherwise, it can be any number or "na".
"h" (High Price): A float variable for the highest price of the candle. Required when "DetectionType" is "Signal"; in other cases, any number or "na" is acceptable.
"l" (Low Price): A float representing the lowest price of the candle. This field must be filled if "DetectionType" is "Signal". If not, it can be any number or "na".
"c" (Close Price): A floating-point variable indicating the closing price of the candle. Needed for "Signal" type detections; otherwise, it can take any value or "na".
"Entry" : A float variable indicating the entry price into a trading setup. This is relevant when "DetectionType" is in "Setup" mode. In other scenarios, it can be any number or "na". It denotes the price at which the trade setup is entered.
"TP" (Take Profit): A float that is necessary when "DetectionType" is "Setup" and "SetupData" is "Full". Otherwise, it can be any number or "na". It signifies the price target for taking profits in a trading setup.
"SL" (Stop Loss): A float required when "DetectionType" is "Setup" and "SetupData" is "Full". It can be any number or "na" in other cases. This value represents the price at which a stop loss is set to limit losses.
"Distal" : A float important for "Order Block Signal" detection. It can be any number or "na" if not in use. This variable indicates the price reaching the distal line of an order block.
"Proximal" : A float needed for "Order Block Signal" detection mode. It can take any value or "na" otherwise. It marks the price reaching the proximal line of an order block.

Danger Signals from The Trading MindwheelThe " Danger Signals " indicator, a collaborative creation from the minds at Amphibian Trading and MARA Wealth, serves as your vigilant lookout in the volatile world of stock trading. Drawing from the wisdom encapsulated in "The Trading Mindwheel" and the successful methodologies of legends like William O'Neil and Mark Minervini, this tool is engineered to safeguard your trading journey.
Core Features:
Real-Time Alerts: Identify critical danger signals as they emerge in the market. Whether it's a single day of heightened risk or a pattern forming, stay informed with specific danger signals and a tally of signals for comprehensive decision-making support. The indicator looks for over 30 different signals ranging from simple closing ranges to more complex signals like blow off action.
Tailored Insights with Portfolio Heat Integration: Pair with the "Portfolio Heat" indicator to customize danger signals based on your current positions, entry points, and stops. This personalized approach ensures that the insights are directly relevant to your trading strategy. Certain signals can have different meanings based on where your trade is at in its lifecycle. Blow off action at the beginning of a trend can be viewed as strength, while after an extended run could signal an opportunity to lock in profits.
Forward-Looking Analysis: Leverage the 'Potential Danger Signals' feature to assess future risks. Enter hypothetical price levels to understand potential market reactions before they unfold, enabling proactive trade management.
The indicator offers two different modes of 'Potential Danger Signals', Worst Case or Immediate. Worst Case allows the user to input any price and see what signals would fire based on price reaching that level, while the Immediate mode looks for potential Danger Signals that could happen on the next bar.
This is achieved by adding and subtracting the average daily range to the current bars close while also forecasting the next values of moving averages, vwaps, risk multiples and the relative strength line to see if a Danger Signal would trigger.
User Customization: Flexibility is at your fingertips with toggle options for each danger signal. Tailor the indicator to match your unique trading style and risk tolerance. No two traders are the same, that is why each signal is able to be turned on or off to match your trading personality.
Versatile Application: Ideal for growth stock traders, momentum swing traders, and adherents of the CANSLIM methodology. Whether you're a novice or a seasoned investor, this tool aligns with strategies influenced by trading giants.
Validation and Utility:
Inspired by the trade management principles of Michael Lamothe, the " Danger Signals " indicator is more than just a tool; it's a reflection of tested strategies that highlight the importance of risk management. Through rigorous validation, including the insights from "The Trading Mindwheel," this indicator helps traders navigate the complexities of the market with an informed, strategic approach.
Whether you're contemplating a new position or evaluating an existing one, the " Danger Signals " indicator is designed to provide the clarity needed to avoid potential pitfalls and capitalize on opportunities with confidence. Embrace a smarter way to trade, where awareness and preparation open the door to success.
Let's dive into each of the components of this indicator.
Volume: Volume refers to the number of shares or contracts traded in a security or an entire market during a given period. It is a measure of the total trading activity and liquidity, indicating the overall interest in a stock or market.
Price Action: the analysis of historical prices to inform trading decisions, without the use of technical indicators. It focuses on the movement of prices to identify patterns, trends, and potential reversal points in the market.
Relative Strength Line: The RS line is a popular tool used to compare the performance of a stock, typically calculated as the ratio of the stock's price to a benchmark index's price. It helps identify outperformers and underperformers relative to the market or a specific sector. The RS value is calculated by dividing the close price of the chosen stock by the close price of the comparative symbol (SPX by default).
Average True Range (ATR): ATR is a market volatility indicator used to show the average range prices swing over a specified period. It is calculated by taking the moving average of the true ranges of a stock for a specific period. The true range for a period is the greatest of the following three values:
The difference between the current high and the current low.
The absolute value of the current high minus the previous close.
The absolute value of the current low minus the previous close.
Average Daily Range (ADR): ADR is a measure used in trading to capture the average range between the high and low prices of an asset over a specified number of past trading days. Unlike the Average True Range (ATR), which accounts for gaps in the price from one day to the next, the Average Daily Range focuses solely on the trading range within each day and averages it out.
Anchored VWAP: AVWAP gives the average price of an asset, weighted by volume, starting from a specific anchor point. This provides traders with a dynamic average price considering both price and volume from a specific start point, offering insights into the market's direction and potential support or resistance levels.
Moving Averages: Moving Averages smooth out price data by creating a constantly updated average price over a specific period of time. It helps traders identify trends by flattening out the fluctuations in price data.
Stochastic: A stochastic oscillator is a momentum indicator used in technical analysis that compares a particular closing price of an asset to a range of its prices over a certain period of time. The theory behind the stochastic oscillator is that in a market trending upwards, prices will tend to close near their high, and in a market trending downwards, prices close near their low.
While each of these components offer unique insights into market behavior, providing sell signals under specific conditions, the power of combining these different signals lies in their ability to confirm each other's signals. This in turn reduces false positives and provides a more reliable basis for trading decisions
These signals can be recognized at any time, however the indicators power is in it's ability to take into account where a trade is in terms of your entry price and stop.
If a trade just started, it hasn’t earned much leeway. Kind of like a new employee that shows up late on the first day of work. It’s less forgivable than say the person who has been there for a while, has done well, is on time, and then one day comes in late.
Contextual Sensitivity:
For instance, a high volume sell-off coupled with a bearish price action pattern significantly strengthens the sell signal. When the price closes below an Anchored VWAP or a critical moving average in this context, it reaffirms the bearish sentiment, suggesting that the momentum is likely to continue downwards.
By considering the relative strength line (RS) alongside volume and price action, the indicator can differentiate between a normal retracement in a strong uptrend and a when a stock starts to become a laggard.
The integration of ATR and ADR provides a dynamic framework that adjusts to the market's volatility. A sudden increase in ATR or a character change detected through comparing short-term and long-term ADR can alert traders to emerging trends or reversals.
The "Danger Signals" indicator exemplifies the power of integrating diverse technical indicators to create a more sophisticated, responsive, and adaptable trading tool. This approach not only amplifies the individual strengths of each indicator but also mitigates their weaknesses.
Portfolio Heat Indicator can be found by clicking on the image below
Danger Signals Included
Price Closes Near Low - Daily Closing Range of 30% or Less
Price Closes Near Weekly Low - Weekly Closing Range of 30% or Less
Price Closes Near Daily Low on Heavy Volume - Daily Closing Range of 30% or Less on Heaviest Volume of the Last 5 Days
Price Closes Near Weekly Low on Heavy Volume - Weekly Closing Range of 30% or Less on Heaviest Volume of the Last 5 Weeks
Price Closes Below Moving Average - Price Closes Below One of 5 Selected Moving Averages
Price Closes Below Swing Low - Price Closes Below Most Recent Swing Low
Price Closes Below 1.5 ATR - Price Closes Below Trailing ATR Stop Based on Highest High of Last 10 Days
Price Closes Below AVWAP - Price Closes Below Selected Anchored VWAP (Anchors include: High of base, Low of base, Highest volume of base, Custom date)
Price Shows Aggressive Selling - Current Bars High is Greater Than Previous Day's High and Closes Near the Lows on Heaviest Volume of the Last 5 Days
Outside Reversal Bar - Price Makes a New High and Closes Near the Lows, Lower Than the Previous Bar's Low
Price Shows Signs of Stalling - Heavy Volume with a Close of Less than 1%
3 Consecutive Days of Lower Lows - 3 Days of Lower Lows
Close Lower than 3 Previous Lows - Close is Less than 3 Previous Lows
Character Change - ADR of Last Shorter Length is Larger than ADR of Longer Length
Fast Stochastic Crosses Below Slow Stochastic - Fast Stochastic Crosses Below Slow Stochastic
Fast & Slow Stochastic Curved Down - Both Stochastic Lines Close Lower than Previous Day for 2 Consecutive Days
Lower Lows & Lower Highs Intraday - Lower High and Lower Low on 30 Minute Timeframe
Moving Average Crossunder - Selected MA Crosses Below Other Selected MA
RS Starts Curving Down - Relative Strength Line Closes Lower than Previous Day for 2 Consecutive Days
RS Turns Negative Short Term - RS Closes Below RS of 7 Days Ago
RS Underperforms Price - Relative Strength Line Not at Highs, While Price Is
Moving Average Begins to Flatten Out - First Day MA Doesn't Close Higher
Price Moves Higher on Lighter Volume - Price Makes a New High on Light Volume and 15 Day Average Volume is Less than 50 Day Average
Price Hits % Target - Price Moves Set % Higher from Entry Price
Price Hits R Multiple - Price hits (Entry - Stop Multiplied by Setting) and Added to Entry
Price Hits Overhead Resistance - Price Crosses a Swing High from a Monthly Timeframe Chart from at Least 1 Year Ago
Price Hits Fib Level - Price Crosses a Fib Extension Drawn From Base High to Low
Price Hits a Psychological Level - Price Crosses a Multiple of 0 or 5
Heavy Volume After Significant Move - Above Average and Heaviest Volume of the Last 5 Days 35 Bars or More from Breakout
Moving Averages Begin to Slope Downward - Moving Averages Fall for 2 Consecutive Days
Blow Off Action - Highest Volume, Largest Spread, Multiple Gaps in a Row 35 Bars or More Post Breakout
Late Buying Frenzy - ANTS 35 Bars or More Post Breakout
Exhaustion Gap - Gap Up 5% or Higher with Price 125% or More Above 200sma

Adaptive Fisherized Z-scoreHello Fellas,
It's time for a new adaptive fisherized indicator of me, where I apply adaptive length and more on a classic indicator.
Today, I chose the Z-score, also called standard score, as indicator of interest.
Special Features
Advanced Smoothing: JMA, T3, Hann Window and Super Smoother
Adaptive Length Algorithms: In-Phase Quadrature, Homodyne Discriminator, Median and Hilbert Transform
Inverse Fisher Transform (IFT)
Signals: Enter Long, Enter Short, Exit Long and Exit Short
Bar Coloring: Presents the trade state as bar colors
Band Levels: Changes the band levels
Decision Making
When you create such a mod you need to think about which concepts are the best to conclude. I decided to take Inverse Fisher Transform instead of normalization to make a version which fits to a fixed scale to avoid the usual distortion created by normalization.
Moreover, I chose JMA, T3, Hann Window and Super Smoother, because JMA and T3 are the bleeding-edge MA's at the moment with the best balance of lag and responsiveness. Additionally, I chose Hann Window and Super Smoother because of their extraordinary smoothing capabilities and because Ehlers favours them.
Furthermore, I decided to choose the half length of the dominant cycle instead of the full dominant cycle to make the indicator more responsive which is very important for a signal emitter like Z-score. Signal emitters always need to be faster or have the same speed as the filters they are combined with.
Usage
The Z-score is a low timeframe scalper which works best during choppy/ranging phases. The direction you should trade is determined by the last trend change. E.g. when the last trend change was from bearish market to bullish market and you are now in a choppy/ranging phase confirmed by e.g. Chop Zone or KAMA slope you want to do long trades.
Interpretation
The Z-score indicator is a momentum indicator which shows the number of standard deviations by which the value of a raw score (price/source) is above or below the mean value of what is being observed or measured. Easily explained, it is almost the same as Bollinger Bands with another visual representation form.
Signals
B -> Buy -> Z-score crosses above lower band
S -> Short -> Z-score crosses below upper band
BE -> Buy Exit -> Z-score crosses above 0
SE -> Sell Exit -> Z-score crosses below 0
If you were reading till here, thank you already. Now, follows a bunch of knowledge for people who don't know the concepts I talk about.
T3
The T3 moving average, short for "Tim Tillson's Triple Exponential Moving Average," is a technical indicator used in financial markets and technical analysis to smooth out price data over a specific period. It was developed by Tim Tillson, a software project manager at Hewlett-Packard, with expertise in Mathematics and Computer Science.
The T3 moving average is an enhancement of the traditional Exponential Moving Average (EMA) and aims to overcome some of its limitations. The primary goal of the T3 moving average is to provide a smoother representation of price trends while minimizing lag compared to other moving averages like Simple Moving Average (SMA), Weighted Moving Average (WMA), or EMA.
To compute the T3 moving average, it involves a triple smoothing process using exponential moving averages. Here's how it works:
Calculate the first exponential moving average (EMA1) of the price data over a specific period 'n.'
Calculate the second exponential moving average (EMA2) of EMA1 using the same period 'n.'
Calculate the third exponential moving average (EMA3) of EMA2 using the same period 'n.'
The formula for the T3 moving average is as follows:
T3 = 3 * (EMA1) - 3 * (EMA2) + (EMA3)
By applying this triple smoothing process, the T3 moving average is intended to offer reduced noise and improved responsiveness to price trends. It achieves this by incorporating multiple time frames of the exponential moving averages, resulting in a more accurate representation of the underlying price action.
JMA
The Jurik Moving Average (JMA) is a technical indicator used in trading to predict price direction. Developed by Mark Jurik, it’s a type of weighted moving average that gives more weight to recent market data rather than past historical data.
JMA is known for its superior noise elimination. It’s a causal, nonlinear, and adaptive filter, meaning it responds to changes in price action without introducing unnecessary lag. This makes JMA a world-class moving average that tracks and smooths price charts or any market-related time series with surprising agility.
In comparison to other moving averages, such as the Exponential Moving Average (EMA), JMA is known to track fast price movement more accurately. This allows traders to apply their strategies to a more accurate picture of price action.
Inverse Fisher Transform
The Inverse Fisher Transform is a transform used in DSP to alter the Probability Distribution Function (PDF) of a signal or in our case of indicators.
The result of using the Inverse Fisher Transform is that the output has a very high probability of being either +1 or –1. This bipolar probability distribution makes the Inverse Fisher Transform ideal for generating an indicator that provides clear buy and sell signals.
Hann Window
The Hann function (aka Hann Window) is named after the Austrian meteorologist Julius von Hann. It is a window function used to perform Hann smoothing.
Super Smoother
The Super Smoother uses a special mathematical process for the smoothing of data points.
The Super Smoother is a technical analysis indicator designed to be smoother and with less lag than a traditional moving average.
Adaptive Length
Length based on the dominant cycle length measured by a "dominant cycle measurement" algorithm.
Happy Trading!
Best regards,
simwai
---
Credits to
@cheatcountry
@everget
@loxx
@DasanC
@blackcat1402

Ichimoku Slope Filtered Signals [UAlgo]
🔶Description:
The "Ichimoku Slope Filtered Signals" indicator is designed to provide trading signals based on the Ichimoku Cloud indicator while incorporating a slope filter. The Ichimoku Cloud is a comprehensive indicator that defines support and resistance, identifies trend direction, and provides trading signals. This script enhances the traditional Ichimoku Cloud signals by incorporating a slope filter, which helps to confirm the strength and direction of the trend.
🔶Key Features:
Ichimoku Cloud Parameters: Users can customize parameters such as Tenkan, Kijun, and Senkou Span lengths, along with multipliers, to adjust the sensitivity of the Ichimoku Cloud.
Slope Filter Settings: Users can specify the number of bars to measure the slope and the lookback period for trend measurement. Additionally, there are options to filter Ichimoku signals based on slope thresholds.
Normalized Slope: The indicator calculates the normalized slope of the selected data series (in this case, Tenkan-sen) and plots it alongside the Ichimoku Cloud.
Signal Generation: Trading signals are generated based on crossovers and crossunders of the Tenkan-sen and Kijun-sen lines of the Ichimoku Cloud. These signals can be further filtered based on the normalized slope of the selected data series.
🔶 Usage:
Customization: Traders can customize the parameters of the Ichimoku Cloud and slope filter according to their trading strategy and risk tolerance.
Interpretation of Signals:
Crossover: A buy signal is generated when the Tenkan-sen line crosses above the Kijun-sen line. This signal can be further filtered based on the normalized slope.
Crossunder: A sell signal is generated when the Tenkan-sen line crosses below the Kijun-sen line. Similar to the buy signal, this can also be filtered based on the normalized slope.
Trend Confirmation: The normalized slope provides additional confirmation of the strength and direction of the trend. A positive slope indicates an upward trend, while a negative slope indicates a downward trend.
Example:
Disclaimer:
Not Financial Advice: This script is provided for educational purposes only and should not be considered financial advice. Traders should conduct their own research and/or consult with a qualified financial advisor before making any investment decisions based on this script.
Risk of Loss: Trading in financial markets involves risk of loss, and past performance is not indicative of future results. Users of this script should be aware of the risks involved in trading and should only trade with capital they can afford to lose.
No Guarantees: There is no guarantee of success or profitability when using this script. Market conditions can change rapidly, and trading results may vary.
Use at Own Risk: The author of this script (UAlgo) does not assume any responsibility for losses incurred as a result of using this script. Traders use this script at their own risk and discretion.
Terms of Use: This script is subject to the terms of the Mozilla Public License 2.0. Users are encouraged to review the license terms before using or distributing the script.
