Swing BoxesHey, folks!
Sorry for not posting anything for such a long time. Don't have enough ideas and resources to get inspiration, so trying to brainstorm good stuff in my free time from university studies.
But despite my absence more I now have 300+ people subscribed to me! Thanks, guys, for keeping interest for my work, as I still do value each boost on my script, for real :)
So here is new script , enjoy!
Swing Boxes is pretty simple indicator, which plots signals with "boxes", that help you determine price targets.
What is the idea behind?
I wanted to make indicator, that could help me make swing trades with nice accuracy (as all we want, lol), and for signal criteria I decided to use highs and lows of the price . Then I started coding some ideas to see which of them could be worthy. And, actually, Swing Boxes appeared to be good. But the thing is, that I didn't intend to build them, they appeared as an anomaly from my code :)
I started to explore this anomaly (it looked super cool, but was repainting hard) to fix it and I succeeded, now Swng Boxes don't repaint.
The main idea is that when price goes above it's highest value of p-bars back or below it's lowest value p-bars back, then there is a some god probability, that price will continue to follow current direction.
And the things about Swing Boxes is that when there is a good trend movement, the boxes become super small to track price movement and when price breaks out in the counter-trend direction, then you will be able to almost perfectly catch a top or a bottom! But most of the signals won't be so high-quality, so don't think that is this some holy grail to trade swing-trading, because it is not.
Signal logic
Quick hint:
- epsilon(variable e ) = ATR * ATR_Factor . It is used to determine box's sensitivity to price changes.
If previous close is higher than variable, which contains previous HIGHEST value (variable h in the code), then update the this variable by taking up-to-date highest value and add epsilon( e ) to it;
If previous close is lower than variable, which contains previous LOWEST value (variable l in the code), then update the this variable by taking up-to-date lowest value and substract epsilon( e ) from it.
Variables decribed above ( h and l ) are box's top and bottom respectively, so if price cross them, it is logical to update it is value.
Settings and what is what
Swing Box Period - numbers fo bars in the past to find highest and lowest price from. The bigger the input, the bigger the boxes will be;
ATR Period;
ATR Factor - multiplier for ATR, determines sensitivity for price changes. The bigger this input, the more accurate signals will be, but less the probability that the signal will be on the top or a bottom.
Show Boxes? - when chosen, plots box's top and bottom. Used to determine price targets.
Show Baseline? - when chosen, plot's baseline, which midline between box's top and bottom.
How to use?
This indicator plots green and red triangles by default.
- Green triangle --> Buy ;
- Red triangle --> Sell ;
As I've said before, many signals from indicator will probably be garbage, so you need to tune settings for youself, so it could satisfy you .
You can enable showing boxes to see box's top and bottom. Box's bottom --> your entry, top --> your profit target.
If you find a way to sort bad signals, you will be able to trade with super cool RR, because the signal from Swing Boxes appear to be a good one, there is almost 95% probability, that price will not even come close to your stop loss, so you can trade with super small stop-losses! Smaller stop-loss --> smaller risk --> smaller loss --> bigger profit, it is that easy.
Also you can enable baseline to use at as your 1st TP, and box's top/bottom as 2nd TP, closing 25% on TP1 and the rest on TP2 (but that is just mine recommendation, you can use different RM (risk-management), if you want).
Also you can use baseline as your S/R (Support/Resistance) line, test it out on your charts.
And please, hear me out: as all other indicators out here on the TradingView, Swing Boxes ARE NOT meant to be traded in solo! Many bad signal can go in a row, so PLEASE find your way to filter out bad signals with other indicators.
You can see here the example of a garabge-class signal in a row, so be don't be deluded!
I do hope that somebody will suggest and idea to improve this thing, as I personally don't have enough time to think about it because of my university studies, but I will probably try it make this thing better throughout the time.
And that's it for now, folks! If you have any ideas for scripts, strategies or anything else, feel free to DM me or leave a comment, I will check it.
Hope you will find this script useful.
Take your profits!
- Tarasenko Fyodor
Cari dalam skrip untuk "signal"

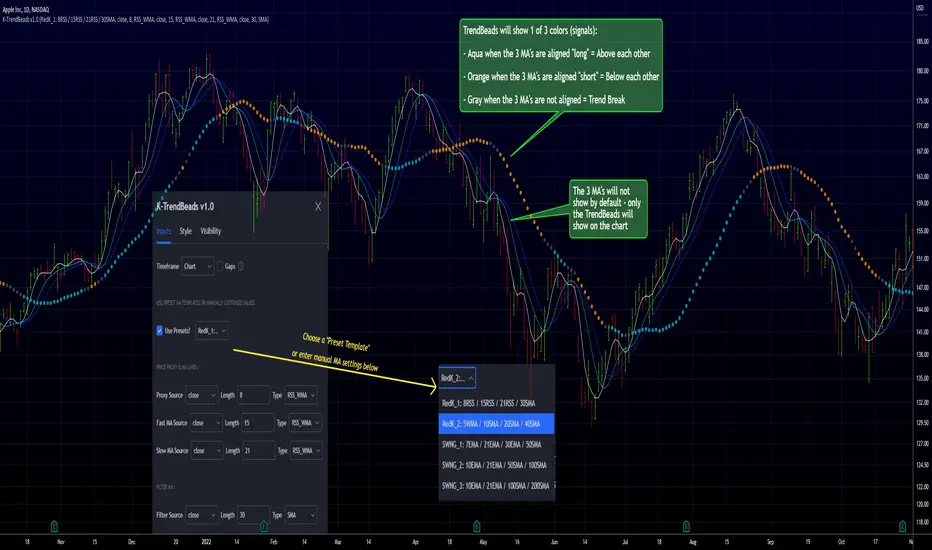
RedK TrendBeads: 3 x MA Crossover Signal with Preset TemplatesRedK TrendBeads is a super simple 3 x Moving Average Crossover Signal (Long/Short/Break) script that provides a simple and effective way for traders to identify potential trading opportunities. By combining three moving averages and only exposing a simple signal, the script helps filter out noise and focus on the trend and the trade execution.
Background
===========
A 3 x Moving Average Crossover strategy is a popular trading method in technical analysis . It uses the relationship between a fast, medium, and slow moving averages to generate buy or sell signals.
The approach usually utilizes three moving averages to track the average price of a financial instrument over different time periods. By comparing the fast, medium, and slow moving averages, we can generates a signal to trade long or short
If the fast moving average crosses above the medium moving average and the medium moving average is above the slow moving average, we have a probability of an up-trend forming, and we generate a signal to go long. Conversely, if the fast moving average crosses below the medium moving average and the medium moving average is below the slow moving average, we have a probability of a down-trend forming, and we generate a signal to go short. When the moving averages are not in the right order (above or below each other), we have a trend break, usually on consolidation or base forming.
in TrendBeads, the fastest MA is called "Price Proxy MA" and will be used with a relatively short length to represent the price itself - then there are the Fast MA, Slow MA and a Filter MA (usually with the longest/slowest length) which is the main line that will be used to plot the TrendBeads - So the TrendBeads will represent the state of the other 3 Moving Average lines (Proxy, Fast and Slow) and how they are aligned - and it will also be common to use the Filter / Beads line itself as a main filter, i.e., take long positions *only* when the price action is above the Filter MA, and short positions *only* when the price is below the Filter MA.
So what is different with TrendBeads:
=====================================
Simplicity, No Clutter: I put this together to provide a super simple mechanism to track trend on the price chart without so much noise as i also wanted to have other top-chart indicators (like LadderTrader) - so TrendBeads only shows the "beads" on the chart - they act like "traffic lights" with little distracting information - Simplicity here was deliberately part if the idea
Presets, What others are Watching: The other feature I needed was the ability to track price action against "different sets" of Moving Averages quickly - for example, when executing short-term trades, I needed to use Moving Averages with shorter length and want to utilize my RSS_WMA MA type - but when assessing big breakout opportunities, I need to analyze price action against a different set of MA's with (usually) longer length and mainly SMA's (hint, The Minervini template) - This is where the built-in Preset Templates become very useful.
Having these preset templates quickly available (thru the dropdown in indicator settings) provides time saving, convenience and the confidence that we're looking at what other traders are using in their analysis - so not missing out on key-level breakouts or reversals
TrendBeads v1.0 includes the following 5 preset MA templates
======================================================
Preset 1 : RedK_1: 8RSS / 15RSS / 21RSS / 30SMA
Preset 2 : RedK_2: 5WMA / 10SMA / 20SMA / 40SMA
Preset 3 : SWNG_1: 7EMA / 21EMA / 30EMA / 50SMA
Preset 4 : SWNG_2: 10EMA / 21EMA / 50SMA / 100SMA
Preset 5 : SWNG_3: 10EMA / 21EMA / 100SMA / 200SMA
The above presets represent some of the most common sets of MA's traders use in various scenarios (Short-term/day trading, Swing, Long term / growth). Well, except for the first one since it utilizes my own RSS_WMA :) which I use in many charts
I may add some more presets in future.
below chart shows an example of different presets against AAPL for the same time range / window
There's also the ability to manually set different MA source price, MA type and length for each of the 4 MA lines. Supported MA types are SMA , EMA , WMA , HMA and my RSS_WMA
TrendBeads Usage Tips:
=====================
*If you have used any MA crossover (2 lines or 3 lines) on your chart, your should find TradeBeads very easy to use. TrendBeads works the same way except that the signal will show as colored beads on the Filter MA line instead of showing multiple crossing lines .. and that is by design.
* Feel free to expose any or all of the individual MA lines - for example, i find that exposing the Proxy Line helps in quickly finding famous chart patterns ( cup & handle , H&S ..etc)
* Experiment with the different presets depending on the type of trade you're working on (swing, long term growth candidates, day trades..etc)
* Note that in a long trend up (Aqua Beads), usually the first gray + orange sequence will usually act as a "reversal sign" - and are usually not actionable - always look for the "second" color sequence to action/trade .. Same thing for a long trend down -- get used to how the beads change color against the trend changes and play with various timeframes.
* As usual - we should have other indicators that track strength, volume , etc and ensure proper confirmation before trade execution - A good signal is only a small part of a trade - risk management and good trade execution are key to winning.
Hope some fellow traders will find this useful - feel free to leave me any comments or feedback - Good luck!
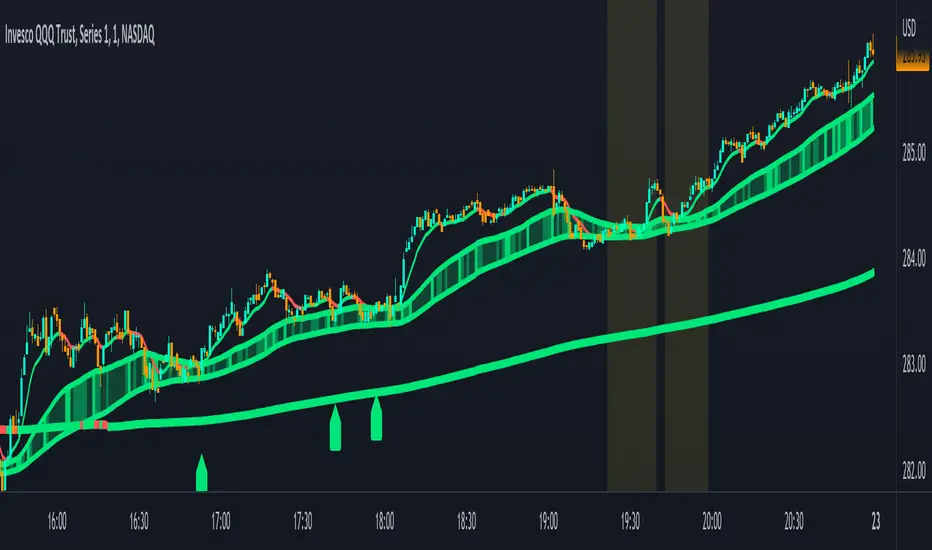
Combined Moving Averages + Squeeze & Volume Spike SignalsThis is a set of 4 combined moving averages. Each moving average is a combination of an EMA, SMA, HMA, RMA, WMA and VWMA with the same length as set in your input settings. All 6 of them are added together and then divided by 6 for an average of all of them. This is based on the theory that most traders use their own preference of moving averages, so combining them all should give us a better idea of where price should actually react since we are using the average of what most traders are using on their charts. It also smooths the moving averages out as well so you get a much easier to read moving average than any of them on their own which should help you hold positions longer and time your entries better.
The default lengths used for this indicator are as follows: 10, 50, 100 and 500. These lengths can be updated in the settings. The 10 and 500 will change colors when the individual moving average is less than or greater than its previous value. Price above or below the moving average does not affect the colors. The 50 and 100 are colored based on whether the 50 is greater/less than the 100.
The two middle length moving averages by default are the 50 and 100. This has been turned into a cloud because it is the area where price typically bounces, since tons of traders use the 50 and 100 moving averages. This should be your long/short zone when price is trending.
Each moving average can be set to use a different source such as close, open, high, low, ohlc4, etc. You can also adjust the length of each moving average. Default settings work well, but feel free to customize them to your liking. You can also change the colors of the lines in the settings.
Beware that changing the lengths of MA #2 and MA #3 will change the signals, squeezes and the cloud.
VOLUME SPIKES
The cloud will change to a brighter color when a volume spike is detected. When a major volume spike is detected, it will turn very bright colored green/red according to the direction of the cloud. This notifies you of volume spikes so you have a better idea of how strong the trend is. If the cloud is a dark green/red then that means that volume is less than or equal to the recent median volume.
SIGNALS
There are also signals that will be given when the current candle is in the cloud, the candle is going in the same direction as the cloud, the MA #2 and MA #3 is going in the same direction and a volume spike is detected. These help you identify good entries when markets are trending. Be cautious of these signals when the trend is sideways and not clearly moving in one direction. The signals can be turned on or off in the settings.
SQUEEZE
Many times when moving averages squeeze together, a big move happens shortly after. Because of this I added a yellow background color when a squeeze is detected. It looks at the median value difference of the MA #2 and MA #3 and if the current value difference is less than the median multiplied by the multiplier in the settings then it will change the background color to notify you. The default value of the multiplier is .6, meaning the squeeze signal will only show if the current value difference of the cloud is less than .6 of the median difference. The multiplier can be adjusted in the settings to suit your preferences. Lower values will only show tighter squeezes.
MARKETS
This indicator can be used on all markets including stocks, crypto, futures and forex.
TIMEFRAMES
This indicator can be used on all timeframes.
PAIRINGS
We recommend pairing this combined moving average with Trend Friend Swing Trade And Scalp Signals for extra confluence. Look for price to bounce in the cloud with good volume and a confirming signal from Trend Friend for highly probable moves.
Chop and explode (ps5)Description : This is a renovated version of my previous mod that was based on the original script from fhenry0331.
Added are:
a data cleaning function
a seasonal random index function
an updated scaler and
a signalling procedure.
-
The following description is moved here from the old script.
The purpose of this script is to decipher chop zones from runs/movement/explosion spans. The chop is RSI movement between 40 and 60. Tight chop is RSI movement between 45 and 55. There should be an explosion after RSI breaks through 60 (long) or 40 (short). Tight chop bars are colored gray, a series of gray bars indicates a tight consolidation and should explode imminently. The longer the chop the longer the explosion will go for. The tighter the better. Loose chop (jig saw/gray bars on the silver background) will range between 40 and 60. The move begins with green and red bars.
Couple it with your trading system to help stay out of chop and enter when there is a movement.

DB KCBB%D Wave SignalsDB KCBB%D Wave Signals
What does the indicator do?
This indicator is a version of my DB KCBB%D indicator updated with signal detection. It results from weeks of analysis of the KCBB%D waves for patterns. I'm releasing it publicly to help those who like the KCBB%D indicator but desire a version with signals built into it.
The indicator plots the percent difference between the low and high prices against a combined Kelpler Channel Bollinger Bands for the current timeframe. The low percent difference and the high percent difference each have their own waves plotted. A mirror mode default allows both waves to be visualized in a mirrored plot that clearly shows when outer bands are present and when they swap. Each percent difference band is displayed with a 1 bar lookback to visualize local tops/bottoms.
The overall trend is displayed using two sets of green/red colors on the percent difference waves so that each wave is recognizable, but the overall price trend is visible. A fast 3 SMA is taken of each percent difference wave to obtain the overall trend and then averaged together. The trend is then calculated based on direction from the previous bar period.
How should this indicator be used?
By default, the indicator will display in a mirror mode which will display both the low and high percent change waves mirrored to allow for the most pattern recognition possible. You will notice the percent difference waves swap from inner to outer, showing the overall market direction for that timeframe. When each percent difference wave interacts with the zero line, it indicates either buys or sells opportunities depending on which band is on the inside. When the inner wave crosses zero, special attention should be paid to the outer wave to know if it's a significant move. Likewise, when the outer wave peaks, it can indicate buy or sell opportunities depending on which wave is on the outside.
A zero line and other lines are displayed from the highest of the high percent difference wave over a long period of time. The lines can measure movement and possible oversold/overbought locations or large volatility . You can also use the lines for crossing points for either wave as alerts to know when to buy or sell zones are happening.
When individual percent difference waves are designed to be reviewed without mirroring, the mirror checkbox can be unchecked in the settings. Doing so will display both the high and low percent difference waves separately. Using this display, you can more cleanly review how each wave interacts with various line levels.
For those who desire to only have half of the mirror or one set of waves inverted against each other, check the "mirrored" and the "mirrored flipped" checkboxes in the settings. Doing so will display the top half of the mirror indicator, which is the low percent difference wave with the high percent difference wave inverted.
The indicator will also change the background color of its own pane to indicate possible buy/sell periods (work in progress).
Does the indicator include any alerts?
Yes, they are a work in progress but starting out with this release, we have:
NOTE: This is an initial release version of this indicator. Please do not use these alerts with bots yet, as they will repaint in real-time.
NOTE: A later release may happen that will delay firing the events until 1/2 of the current bar time has passed.
NOTE: As with any indicator, watch your upper timeframe waves first before zooming into lower.
DB KCBB%D Buy Signal
DB KCBB%D Buy Warning Signal
DB KCBB%D Sell Signal
DB KCBB%D Sell Warning Signal
DB KCBB%D Death Cross Sell Signal
DB KCBB%D Trend Up Alert
DB KCBB%D Trend Down Alert
Use at your own risk and do your own diligence.
Enjoy!

Simple Buy and Sell SignalsThis is a Simple Indicator which shows buy and sell signals based on MACD and SSL channel.
It is not a Holy Grail Indicator. It shows a lot of false signals when the market is Consolidation Zone.
So don't use this indicator to place trades based on signals given by the indicator.
Use this as a confluence along with your technical analysis
On lower timeframes there are a lot of signals so to eliminate false signals , get a signal on higher timeframe and place a trade in the direction of the trend on lower timeframe.
Hope you'll find this helpful. Enjoy👍.
TheATR: Fisher Oscillator.Fisher Oscillator(FO).
The Fisher Oscillator is inspired by John Ehlers "Fisher Transform".
The oscillator highlights when prices have moved to an extreme, based on recent prices.
The FO may help in spotting turning points, in the short-medium trends of an asset, also, it helps in recognizing the asset's trends themselves, giving a picture of mkt conditions affected by less noise.
Fisher Oscillator Components.
Fisher V1 -> Main FO.
Fisher V2 -> Past Candle FO.
0-line threshold -> Directional Component.
How to read the Fisher Oscillator.
The FO is super easy to read by itself.. also, I coded some features which make it even easier to read.
It's suggestions, which we can call "Signals", come from 2 different sources, accessible thanks to the variable "Signals Type".
- 0-Line Crosses:
When the "Fisher V1" upcrosses the oscillator 0-line, the oscillator suggests a Long scenario.
When the "Fisher V1" downcrosses the oscillator 0-line, the oscillator suggests a Short scenario.
- Classic Lines Crosses:
When the "Fisher V1" upcrosses the "Fisher V2", the oscillator suggests a Long scenario.
When the "Fisher V1" downcrosses the "Fisher V2", the oscillator suggests a Short scenario.
Users will be able to recognise these Signals visually, thanks to some color customisation to the "Fisher V1" line, and thanks to the ability of the oscillator of plotting Signals.
TheATR Documentation regarding TheATR: Fisher Oscillator.
Researching and backtesting the FO, I noticed it's skill of being able to dynamically identify trend reversals with a nice degree of reliability.
Also, the FO's able to keep up with trends up to their tops/bottoms, as it's very responsive.
This makes the FO a trend-following oscillator in my personal view, because its nature of being very fast in detecting reversals will lead to many false reversals as well.
On the other face of this coin, if we look at the FO as a source for confirmations for a trend-following strategy, may be very useful.
To conclude, I would use the FO as a confirmation oscillator, in a trend-following strategy that needs to have other components.
Thanks for reading,
TheATR.

Multi Type RSI [Misu]█ This Indicator is based on RSI ( Relative Strength Index ) & multiple type of MA (Moving Average) to show different variations of RSI.
The relative strength index (RSI) is a momentum indicator used in technical analysis to evaluate overvalued or undervalued conditions in the price of that security.
█ Usages:
The purpose of this indicator is to obtain the RSI calculated with different MAs modes instead of the classic RMA.
The red and green zones indicate the oversold and overbought zones.
Buy or sell signals are marked by the green and red circles
We have 2 different signal modes : when the different size RSIs cross and when the fast RSI crosses the extreme bands.
Alerts are setup.
█ Parameters:
Lenght RSI: The lenght of the RSI. (14 by default)
RSI MA Type: The type of MA with which the rsi will be calculated. ("SMA", "EMA", "SMMA (RMA)", "WMA", "VWMA")
Fast Lenght MA: The fast lenght smoothing MA.
Slow Lenght MA: The Slow lenght smoothing MA.
Lower Band: The lenght of the lower band. (25 by default)
Upper Band: The lenght of the upper band. (75 by default)
Signal Type: The mode with which buy and sell signals are triggered. ("Cross 2 Mas", "Cross Ma/Bands")

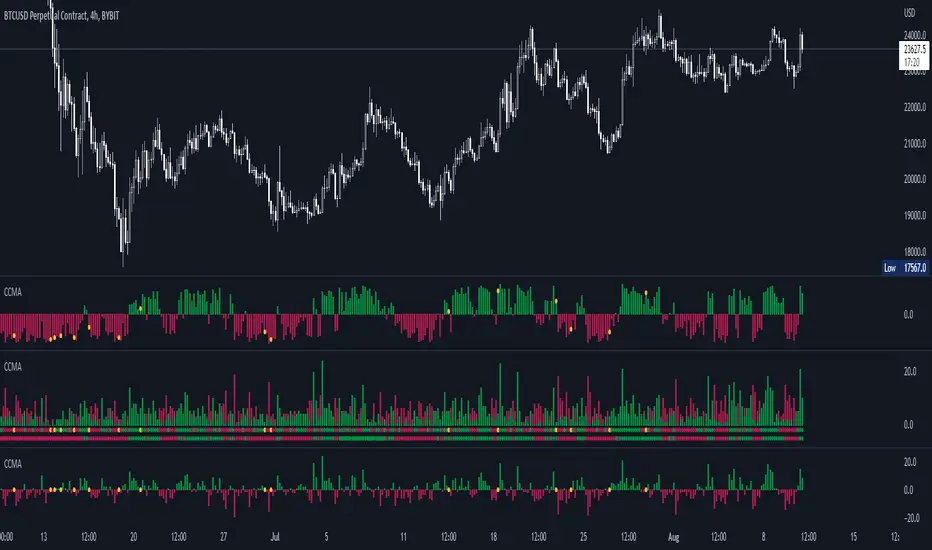
CCMA - Count Condition MA (560 Indicators In One) Do you like using moving averages?
Why do you think a pair of moving averages on a chart will help you?
What is the probability that once two moving averages have crossed, you will successfully enter the trade?
So why not use 100+ moving averages at once to increase the probability of a successful trade?
And all this can be seen in a single oscillator as a histogram!
I want to introduce you to a system that takes into account 560 moving averages movements. And that's just for a second, 560 potential indicators.
Specifically:
- 22 types of MA (EMA, SMA, RMA and others).
- 176 moving averages.
- 310 crossover checks.
- 252 checks of trend following.
The indicator makes the most of the opportunities provided by television. Therefore, it can take a long time to load it.
How does it work ?
In general, the indicator counts the number of fulfilled conditions.
It checks if MA #1 and MA #2 have crossed. If so, it adds +1 to the statistics. It also checks if price is above or below the moving average. There are a total of 560 such checks. (This is about the maximum the TV allowed me).
The default is 8 lengths of moving averages, I took the Fibonacci numbers thinking they were the optimal solution. You can take any of your favorites.
If the "Ratio MOD" feature is on. Then you can see how many MAs are showing signals to enter a long or short position.
You can also see the indication at the bottom as dots. They show which signals are longer/shorter. If the number of signals is the same, the dot will be yellow. The first line of dots counts the number of crossings. The second line counts the number of crossovers + checks whether the price is above or below the average slippage.
If the "Differ MOD" function is enabled. Then you can see the difference between long and short signals. With the same indication as in RATIO MOD.
If "Show all" is on, then the bar graph shows all 560 accounting options. If it is off, only the number of crossovers is displayed. (This does not apply to the display as points)
If the script shows an error, try to change the timeframe and go back. Or add it again.
You can also disable the histogram in the stats settings and leave only the points that help in determining the trend.
Price Action Signals V2Indicator that shows buy/sell signals based on price action and volume as it relates to a double EMA. If the candle is above the double EMA, we look for candles with long wicks on the top indicating selling pressure. If the candle is below the double EMA , we look for candles with a long bottom wick indicating buying pressure. The user defined parameters are the length of the double EMA and the length of the volume moving average. Lower timeframes such as 5 minutes and lower are better off using lower lengths while higher timeframes should user higher lengths. Your mileage will vary.
Note, while this indicator can signal the beginning of long term trends, it will also signal minor retracements. Do not blindly buy or sell based on a signal appearing, pay attention to where the candle is in the overall trend and wait for confirmation to avoid losses.
Fisher Transform w/ Dynamic Zones [Loxx]What is Fisher Transform?
The Fisher Transform is a technical indicator created by John F. Ehlers that converts prices into a Gaussian normal distribution.
The indicator highlights when prices have moved to an extreme, based on recent prices. This may help in spotting turning points in the price of an asset. It also helps show the trend and isolate the price waves within a trend.
What are Dynamic Zones?
As explained in "Stocks & Commodities V15:7 (306-310): Dynamic Zones by Leo Zamansky, Ph .D., and David Stendahl"
Most indicators use a fixed zone for buy and sell signals. Here’ s a concept based on zones that are responsive to past levels of the indicator.
One approach to active investing employs the use of oscillators to exploit tradable market trends. This investing style follows a very simple form of logic: Enter the market only when an oscillator has moved far above or below traditional trading lev- els. However, these oscillator- driven systems lack the ability to evolve with the market because they use fixed buy and sell zones. Traders typically use one set of buy and sell zones for a bull market and substantially different zones for a bear market. And therein lies the problem.
Once traders begin introducing their market opinions into trading equations, by changing the zones, they negate the system’s mechanical nature. The objective is to have a system automatically define its own buy and sell zones and thereby profitably trade in any market — bull or bear. Dynamic zones offer a solution to the problem of fixed buy and sell zones for any oscillator-driven system.
An indicator’s extreme levels can be quantified using statistical methods. These extreme levels are calculated for a certain period and serve as the buy and sell zones for a trading system. The repetition of this statistical process for every value of the indicator creates values that become the dynamic zones. The zones are calculated in such a way that the probability of the indicator value rising above, or falling below, the dynamic zones is equal to a given probability input set by the trader.
To better understand dynamic zones, let's first describe them mathematically and then explain their use. The dynamic zones definition:
Find V such that:
For dynamic zone buy: P{X <= V}=P1
For dynamic zone sell: P{X >= V}=P2
where P1 and P2 are the probabilities set by the trader, X is the value of the indicator for the selected period and V represents the value of the dynamic zone.
The probability input P1 and P2 can be adjusted by the trader to encompass as much or as little data as the trader would like. The smaller the probability, the fewer data values above and below the dynamic zones. This translates into a wider range between the buy and sell zones. If a 10% probability is used for P1 and P2, only those data values that make up the top 10% and bottom 10% for an indicator are used in the construction of the zones. Of the values, 80% will fall between the two extreme levels. Because dynamic zone levels are penetrated so infrequently, when this happens, traders know that the market has truly moved into overbought or oversold territory.
Calculating the Dynamic Zones
The algorithm for the dynamic zones is a series of steps. First, decide the value of the lookback period t. Next, decide the value of the probability Pbuy for buy zone and value of the probability Psell for the sell zone.
For i=1, to the last lookback period, build the distribution f(x) of the price during the lookback period i. Then find the value Vi1 such that the probability of the price less than or equal to Vi1 during the lookback period i is equal to Pbuy. Find the value Vi2 such that the probability of the price greater or equal to Vi2 during the lookback period i is equal to Psell. The sequence of Vi1 for all periods gives the buy zone. The sequence of Vi2 for all periods gives the sell zone.
In the algorithm description, we have: Build the distribution f(x) of the price during the lookback period i. The distribution here is empirical namely, how many times a given value of x appeared during the lookback period. The problem is to find such x that the probability of a price being greater or equal to x will be equal to a probability selected by the user. Probability is the area under the distribution curve. The task is to find such value of x that the area under the distribution curve to the right of x will be equal to the probability selected by the user. That x is the dynamic zone.
Included
3 signal types
Bar coloring
Alerts
Channels fill
Loxx's Expanded Source Types

Dynamic Zone Range on OMA [Loxx]Dynamic Zone Range on OMA is an One More Moving Average oscillator with Dynamic Zones.
What is the One More Moving Average (OMA)?
The usual story goes something like this : which is the best moving average? Everyone that ever started to do any kind of technical analysis was pulled into this "game". Comparing, testing, looking for new ones, testing ...
The idea of this one is simple: it should not be itself, but it should be a kind of a chameleon - it should "imitate" as much other moving averages as it can. So the need for zillion different moving averages would diminish. And it should have some extra, of course:
The extras:
it has to be smooth
it has to be able to "change speed" without length change
it has to be able to adapt or not (since it has to "imitate" the non-adaptive as well as the adaptive ones)
The steps:
Smoothing - compared are the simple moving average (that is the basis and the first step of this indicator - a smoothed simple moving average with as little lag added as it is possible and as close to the original as it is possible) Speed 1 and non-adaptive are the reference for this basic setup.
Speed changing - same chart only added one more average with "speeds" 2 and 3 (for comparison purposes only here)
Finally - adapting : same chart with SMA compared to one more average with speed 1 but adaptive (so this parameters would make it a "smoothed adaptive simple average") Adapting part is a modified Kaufman adapting way and this part (the adapting part) may be a subject for changes in the future (it is giving satisfactory results, but if or when I find a better way, it will be implemented here)
Some comparisons for different speed settings (all the comparisons are without adaptive turned on, and are approximate. Approximation comes from a fact that it is impossible to get exactly the same values from only one way of calculation, and frankly, I even did not try to get those same values).
speed 0.5 - T3 (0.618 Tilson)
speed 2.5 - T3 (0.618 Fulks/Matulich)
speed 1 - SMA , harmonic mean
speed 2 - LWMA
speed 7 - very similar to Hull and TEMA
speed 8 - very similar to LSMA and Linear regression value
Parameters:
Length - length (period) for averaging
Source - price to use for averaging
Speed - desired speed (i limited to -1.5 on the lower side but it even does not need that limit - some interesting results with speeds that are less than 0 can be achieved)
Adaptive - does it adapt or not
Variety Moving Averages w/ Dynamic Zones contains 33 source types and 35+ moving averages with double dynamic zones levels.
What are Dynamic Zones?
As explained in "Stocks & Commodities V15:7 (306-310): Dynamic Zones by Leo Zamansky, Ph .D., and David Stendahl"
Most indicators use a fixed zone for buy and sell signals. Here’ s a concept based on zones that are responsive to past levels of the indicator.
One approach to active investing employs the use of oscillators to exploit tradable market trends. This investing style follows a very simple form of logic: Enter the market only when an oscillator has moved far above or below traditional trading lev- els. However, these oscillator- driven systems lack the ability to evolve with the market because they use fixed buy and sell zones. Traders typically use one set of buy and sell zones for a bull market and substantially different zones for a bear market. And therein lies the problem.
Once traders begin introducing their market opinions into trading equations, by changing the zones, they negate the system’s mechanical nature. The objective is to have a system automatically define its own buy and sell zones and thereby profitably trade in any market — bull or bear. Dynamic zones offer a solution to the problem of fixed buy and sell zones for any oscillator-driven system.
An indicator’s extreme levels can be quantified using statistical methods. These extreme levels are calculated for a certain period and serve as the buy and sell zones for a trading system. The repetition of this statistical process for every value of the indicator creates values that become the dynamic zones. The zones are calculated in such a way that the probability of the indicator value rising above, or falling below, the dynamic zones is equal to a given probability input set by the trader.
To better understand dynamic zones, let's first describe them mathematically and then explain their use. The dynamic zones definition:
Find V such that:
For dynamic zone buy: P{X <= V}=P1
For dynamic zone sell: P{X >= V}=P2
where P1 and P2 are the probabilities set by the trader, X is the value of the indicator for the selected period and V represents the value of the dynamic zone.
The probability input P1 and P2 can be adjusted by the trader to encompass as much or as little data as the trader would like. The smaller the probability, the fewer data values above and below the dynamic zones. This translates into a wider range between the buy and sell zones. If a 10% probability is used for P1 and P2, only those data values that make up the top 10% and bottom 10% for an indicator are used in the construction of the zones. Of the values, 80% will fall between the two extreme levels. Because dynamic zone levels are penetrated so infrequently, when this happens, traders know that the market has truly moved into overbought or oversold territory.
Calculating the Dynamic Zones
The algorithm for the dynamic zones is a series of steps. First, decide the value of the lookback period t. Next, decide the value of the probability Pbuy for buy zone and value of the probability Psell for the sell zone.
For i=1, to the last lookback period, build the distribution f(x) of the price during the lookback period i. Then find the value Vi1 such that the probability of the price less than or equal to Vi1 during the lookback period i is equal to Pbuy. Find the value Vi2 such that the probability of the price greater or equal to Vi2 during the lookback period i is equal to Psell. The sequence of Vi1 for all periods gives the buy zone. The sequence of Vi2 for all periods gives the sell zone.
In the algorithm description, we have: Build the distribution f(x) of the price during the lookback period i. The distribution here is empirical namely, how many times a given value of x appeared during the lookback period. The problem is to find such x that the probability of a price being greater or equal to x will be equal to a probability selected by the user. Probability is the area under the distribution curve. The task is to find such value of x that the area under the distribution curve to the right of x will be equal to the probability selected by the user. That x is the dynamic zone.
Included
4 signal types
Bar coloring
Alerts
Channels fill

Gucci Sniper Trading Bot [Open]A simple Buy/Sell signal algo designed for a trading bot.
Uses ATR and EMA cross to get signals.

RSI/RSX QQE Histogram w/ Discontinued Signal Line [Loxx]QQE Histogram w/ Discontinued Signal Line is a run-of-the-mill Qualitative Quantitative Estimation (QQE) calculation but with a signal line to better filter and identify trends. The thicker white line is the QSL and appears as a simple EMA. The two thin white lines are the fast and slow trends. The histogram changes color based on the DSL levels. This version of QQE also includes two different versions of RSI: Wilders and Jurik's RSX.
What is Qualitative Quantitative Estimation (QQE)?
The Qualitative Quantitative Estimation (QQE) indicator works like a smoother version of the popular Relative Strength Index ( RSI ) indicator. QQE expands on RSI by adding two volatility based trailing stop lines. These trailing stop lines are composed of a fast and a slow moving Average True Range (ATR).
What is Wilders' RSI?
The Relative Strength Index (RSI) is a well versed momentum based oscillator which is used to measure the speed (velocity) as well as the change (magnitude) of directional price movements. Essentially RSI , when graphed, provides a visual mean to monitor both the current, as well as historical, strength and weakness of a particular market. The strength or weakness is based on closing prices over the duration of a specified trading period creating a reliable metric of price and momentum changes. Given the popularity of cash settled instruments (stock indexes) and leveraged financial products (the entire field of derivatives); RSI has proven to be a viable indicator of price movements.
What is RSX?
RSI is a very popular technical indicator, because it takes into consideration market speed, direction and trend uniformity. However, the its widely criticized drawback is its noisy (jittery) appearance. The Jurk RSX retains all the useful features of RSI , but with one important exception: the noise is gone with no added lag.
There are many indicators for many purposes. Some of them are complex and some are comparatively easy to handle. The QQE indicator is a really useful analytical tool and one of the most accurate indicators. It offers numerous strategies for using the buy and sell signals. Essentially, it can help detect trend reversal and enter the trade at the most optimal positions.
Included:
-Toggle on/off bar coloring

Adaptive ATR Keltner Channels [Loxx]Adaptive ATR Channels are adaptive Keltner channels. ATR is calculated using a rolling signal-to-noise ratio making this indicator flex more to changes in price volatility than the fixed Keltner Channels.
What is Average True Range (ATR)?
The average true range (ATR) is a technical analysis indicator, introduced by market technician J. Welles Wilder Jr. in his book New Concepts in Technical Trading Systems, that measures market volatility by decomposing the entire range of an asset price for that period.1
The true range is taken as the greatest of the following: current high less the current low; the absolute value of the current high less the previous close; and the absolute value of the current low less the previous close. The ATR is then a moving average, generally using 14 days, of the true ranges.
What are Keltner Channel (ATR)?
Keltner Channels are volatility-based bands that are placed on either side of an asset's price and can aid in determining the direction of a trend.
The Keltner channel uses the average-true range (ATR) or volatility, with breaks above or below the top and bottom barriers signaling a continuation.

Volume Spikes & Growing Volume Signals With Alerts & ScannerVOLUME SPIKES & GROWING VOLUME SIGNALS WITH ALERTS & SCANNER
This indicator shows arrows when there is a volume spike. It also paints the background when volume is growing. There is also a volume scanner for 8 tickers that will change color in real time when your other favorite tickers see volume growth and spikes.
You can customize the length of DMI, the number of bars to calculate the current volume average from, the number of bars back to get the overall volume average from, the multiple that needs to be hit to give a signal, the position of the scanner table and which tickers are used in the scanner. There are detailed directions as tooltips in the indicator settings you can read to understand exactly what each input does.
All features are customizable as well as which tickers the screener uses.
***HOW TO USE***
Watch for volume to pick up before placing trades as this will help you stay out of the markets when price is choppy. Volume usually brings volatility so watch for the volume signals to show up on the chart. Typically when price has made a big move one direction or is consolidating and you see the volume indicator start giving signals, the market is ready to reverse or continue its current trend but move faster in that direction.
Volume Spikes
When there is a volume spike that is larger than the average of volume over the last 100+ bars(depending on your settings) multiplied by the volume amount multiplier(in your settings) then an arrow will show up on the chart. This arrow will be green if DMI is bullish and red if DMI is bearish.
Volume Growth
A Background color will appear when the average volume over the last 5 bars(depending on your settings) is higher than the average volume over the last 100+ bars(depending on your settings) and is greater than your multiple. It will also paint the background when the volume moving average has increased over the last 3 bars consecutively. The background colors will be red or green depending on buy & sell pressure(DMI). If the background color appears, then you know volume is growing and volatility is near.
Volume Scanner
The scanner can be customized to have all of your favorite tickers by changing the tickers used in the indicator settings at the bottom. When no volume growth or spikes are detected, the ticker will show as light blue. When volume spikes or growth is detected, the ticker will turn orange to notify you.
Alerts
You can set up alerts as well when there is volume growth, bullish volume spikes and bearish volume spikes on any chart or timeframe.
Indicator Settings
Settings will need to be adjusted across different tickers as some have large swings in volume and some stay pretty even, so make sure to set up different chart layouts with settings that work for each ticker and save them individually so you don’t have to reset these values every time you switch charts.
***MARKETS***
This indicator can be used as a signal on all markets, including stocks, crypto, futures and forex as long as Tradingview has volume and DMI data for that ticker.
***TIMEFRAMES***
This volume spike indicator can be used on all timeframes as long as there is enough data for Tradingview to use for calculations.
***TIPS***
Try using numerous indicators of ours on your chart so you can instantly see the bullish or bearish trend of multiple indicators in real time without having to analyze the data. Some of our favorites are our Auto Fibonacci, Volume Profile, Momentum, Auto Support And Resistance and Money Flow Index in combination with this Volume Growth indicator. They all have real time Bullish and Bearish labels as well so you can immediately understand each indicator's trend.

DEBUG SIGNALTest version of the bot.
Egnore the sell signals.
Enter on buy signals and have stop loss of ( 2-3 %) and set your take profit to (+1%) and do trail stop for rest of the trade
VIX Volatility Trend Analysis With Signals - Stocks OnlyVIX VOLATILITY TREND ANALYSIS CLOUD WITH BULLISH & BEARISH SIGNALS - STOCKS ONLY
This indicator is a visual aid that shows you the bullish or bearish trend of VIX market volatility so you can see the VIX trend without switching charts. When volatility goes up, most stocks go down and vice versa. When the cloud turns green, it is a bullish sign. When the cloud turns red, it is a bearish sign.
This indicator is meant for stocks with a lot of price action and volatility, so for best results, use it on charts that move similar to the S&P 500 or other similar charts.
This indicator uses real time data from the stock market overall, so it should only be used on stocks and will only give a few signals during after hours. It does work ok for crypto, but will not give signals when the US stock market is closed.
**HOW TO USE**
When the VIX Volatility Index trend changes direction, it will give a green or red line on the chart depending on which way the VIX is now trending. The cloud will also change color depending on which way the VIX is trending. Use this to determine overall market volatility and place trades in the direction that the indicator is showing. Do not use this by itself as sometimes markets won’t react perfectly to the overall market volatility. It should only be used as a secondary confirmation in your trading/trend analysis.
For more signals with earlier entries, go into settings and reduce the number. 10-100 is best for scalping. For less signals with later entries, change the number to a higher value. Use 100-500 for swing trades. Can go higher for long swing trades. Our favorite settings are 20, 60, 100, 500 and 1000.
***MARKETS***
This indicator should only be used on the US stock markets as signals are given based on the VIX volatility index which measures volatility of the US Stock Markets.
***TIMEFRAMES***
This indicator works on all time frames, but after hours will not change much at all due to the markets being closed.
**INVERSE CHARTS**
If you are using this on an inverse ETF and the signals are showing backwards, please comment with what chart it is and I will configure the indicator to give the correct signals. I have included over 50 inverse ETFs into the code to show the correct signals on inverse charts, but I'm sure there are some that I have missed so feel free to let me know and I will update the script with the requested tickers.
***TIPS***
Try using numerous indicators of ours on your chart so you can instantly see the bullish or bearish trend of multiple indicators in real time without having to analyze the data. Some of our favorites are our Auto Fibonacci, Directional Movement Index, Volume Profile with buy & sell pressure, Auto Support And Resistance, Vix Scalper and Money Flow Index in combination with this Vix Trend Analysis. They all have real time Bullish and Bearish labels as well so you can immediately understand each indicator's trend.

SAR+RSI+EMAs SignalsNOTE:
Indicator based strategies may expire and begin to work again. There are various ways to check the expiration of these strategies but I suggest equity curve trading (EC trading) as the best one.
Please check every single indicator based strategy to see if it’s still profitable or it has been expired to avoid losses.
Principles:
I personally believe every profitable indicator-based setup need 3 factors. Actually I analyze indicator-based set up in this way!
1- Trend detector: a tool that detect the “trend”.
2- Oscillators (Discount finder): a tool that detects “discounts” in the direction of the trend.
3- Stimulus: A tool that indicates the Initiation of a movement.
There may be profitable strategies that do not use all three, because other factors are strong enough to lead us to profit, but they are rare and sometimes they hide the other forgotten factor in the main two ones.
Elements:
(Since most of traders here, are familiar with these famous indicators I will not take your time to write about their uses and formula)
SAR: As a Trend detector, regarding position of close and SAR
EMA 7 and EMA 21: As trend detectors, regarding position of EMA 7 as fast “moving average” and EMA 21 as slow one. Also we need another confirmation for trend regarding EMA 7 and closing price of the signal candle.
RSI: In this strategy RSI is used both as a discount finder and a stimulus.
For RSI being over/under 50, regarding the trend, a possible discount may have been occurred. Imagine these conditions: close>EMA7, EMA7>EMA21, close>SAR and simultaneously RSI being under 50 is really a sign of powerful uptrend which it’s RSI decreasing might be a sign of corrective move, which will be following a bullish impulsive move.
The other use of RSI is to stimulate a buy signal by “crossing” over 50 or 30 (50 as balanced point of momentum and 30 as a sign of ending an oversold) or stimulate a sell signal by “crossing” under 50 or 70 (50 as balanced point of momentum and 70 as a sign of ending an overbought).
Entry point: you can use one of the followings.
1- Open of the next candle
2- EMA 7
3- Open of the signal candle
(Totally optional but “open of the next candle” is suggested by me.)
SL: Use one of the followings.
1- SAR or some pips (regarding ATR Or your experience of this trading instrument’s fluctuations in this time frame) below the SAR
2- Fixed amount (regarding ATR Or your experience of this trading instrument’s fluctuations in this time frame)
3- Use EMA21 as dynamic SL (if a candle far enough from the initiative candle close over (for sell) below ( for buy)
Again number 1 is suggested by me.
TP: Use one of the followings.
1- Use static levels or zones of support and resistance as TP.
2- Use dynamic levels for instance band of BB or moving averages (Moving the SL is possible).
3- Use fixed R to R
And I believe static zones of support and resistance work better.
Examples:
I indicate a buy signal on the chart!
Using local level as TP worked just good.
Using EMA was better in this case.
And using a riskier level or a fixed R to R is obvious in the chart!
Since in the range markets, this strategy may not work well and at the same time, TP to SL might be too small to be worth the risk, I prefer to use levels to filter range market conditions!
I convert all those circumstances to a simple buy and sell signs on the chart!
EMA21 and SAR are still visible because it is possible that traders use them for their TP and SL.
This is how it look without EMA21 and SAR!
Another screenshot of this strategy!
I also add a check box to filter signals by another trend detector. MATD created by me to help traders detect trend!
As it’s visible, some profitable signals filtered too, but using a longer-term trend detector as an additional one, alongside the double EMAs is very useful for this strategy.
The other box “use high&low instead of close for fast EMA” makes the “EMA7 and close” trend detector an easygoing one!
Almost everything is editable here!
*** I did not invent this strategy, you can find it for free on net ***
I'll change it to a "strategy" instead of an indicator if reader like to!

NazhoThis is a simple scalping strategy that works for all time frames... I have only tested it on FOREX
It works by checking if the price is currently in an uptrend and if it crosses the 20 EMA .
If it crosses the 20 EMA and its in and uptrend it will post a BUY SIGNAL.
If it crosses the 20 EMA and its in and down it will post a SELL SIGNAL.
The red line is the highest close of the previous 8 bars --- This is resistance
The green line is the lowest close of the previous 8 bars -- This is support
+SuperTrend

[JL] How Many Signals last N barsGot this idea after I found Multiple Indicators Screener from QuantNomad.
This script learnt some codes from QuantNomad's great script. Thanks to him.
------------------------------------------------------------------------------------------------------------------------------------------------------------------------
This table show how many signals happened during the last N bars.
I only take care Forex, so this table only has 28 symbols. Feel free to change it.
Calculate the following signals:
RSI cross over/under 50
Short Moving average cross over/under long moving average
Stochastic k cross over/under d
MACD hist cross over/under 0
Williams Fractals: Up and Down fractals happened.
The concept is simple: Range period will always happen more cross signals than the trend period.
When the counter is less than median of all symbols, will be set green color. So more green mean more chance to be trend.

Sentiment Estimator [AstrideUnicorn]Sentiment Estimator is an indicator that estimates market sentiment using only its pricing data. It counts bullish and bearish candles in a rolling window and calculates their relative values as percentages of the total amount of candles in the window. Market sentiment shows the direction in which the market is biased to move or the current trend direction. Extreme values of the market sentiment are contrarian signals. When the market sentiment is too bullish, it is time to sell and vice versa.
HOW TO USE
Sentiment Estimator plots a pair of green and red circles for each candle. They represent bullish and bearish sentiments, respectively.
The vertical positions of the circles show corresponding sentiment values in percentage units. For example, if a green circle's height is 60, the market is 60% bullish. In this case, the red circle's height will be 40, as bullish and bearish parts of the market sentiment sum to 100%.
The blue line plotted at the 50% level shows the neutral sentiment level. If a green circle is above the blue line, the prevailing market sentiment at that time is bullish, and the market is biased to move up. If a red one is above, the market has predominantly bearish sentiment and is prone to move down.
The red level shows extreme sentiment level. If a green or red circle is above this line, it means that the market is extremely bullish or bearish, respectively. It is a contrarian signal, and one can expect a reversal soon. In this case, a blue label with the text "reversal expected" is shown.
SETTINGS
Timeframe - allows choosing a timeframe other than the chart's one for the indicator calculation.
Look-Back Window - sets the historical window length used to perform the calculations. You can adjust the window to get the best results for a particular market or timeframe.

P-Signal StrategyThis is an example of building a trading strategy based on a p-signal. The p-signal indicates the entropy of the state of the D frame system for the BTCUSD pair in the Kolmogorov probability space.
