RSI with Moving Averages[UO]This RSI indicator is one of my favorite indicators. This powerful indicator is implemented by Phi-Deltalytics. I modified the drawing so that it is easier (at least for me) to see the signals and trends (it would not matter if you're doing algorithmic trading).
Trends and signals. For detailed instructions and tutorial see Phi-Deltalytics page
Cari dalam skrip untuk "signal"

Stochastic RSI 3in1 & Volatility peaks + ADX by AGUDescription:
3 Lines are Stochastic RSI's, strongest move is when all crosses and moves to one direction (from top or bottom).
Orange is original Stochastic of the timeline. (Live movement of price).
Green is original Stoch x 6. (Short term movement).
Red is original Stoch x27 (Long term price movement).
Transparent columns are ADX signal.
Higher the mountain, stronger the signal. When the mountain tops, trend usually change.
And finally the volatility peaks. Green peak HIGHEST volatility , RED peak LOWEST volatility .
I use it on 1 min BTC chart. But it works on all.
TIPS >> 3HCQ41cRpxcq2MJdRUSYoq9N1RnEy98xD2

RSI with an Opinion (UO)This RSI has a very clear idea about when to buy and sell. It plots buy and sell signals. It is an expert system. Yes, of course, it can make some errors. You should have used stop-loss

NVT Dynamic Colored with Signals [aamonkey]NVT Dynamic
This is the dynamic version of my " Bitcoin Network Value to Transactions " indicator.
The dynamic NVT indicator is based on the Network Value to Transactions.
Definition:
NVT = Network Value / Daily Transaction Volume
Advantages:
Because BTC is a very young asset, it can be a good idea to have relatively high and low NVT values that change over time.
Signals:
When the NVT turns green = buy opportunity
NVT turns red = sell opportunity

Consensio With Signals ForecastedA new version of "Consensio With Signals" ( )
but with forecast of the SMAs and their signals.

Two MM Cross (Signal version)Hi everyone
This is a dummy two MM cross script to be used for the Trade Manager
I'll publish a video explaining how to use the Trade Manager as I received many questions.
This was my fault for not being clear enough. A video will do great wonders here
Dave

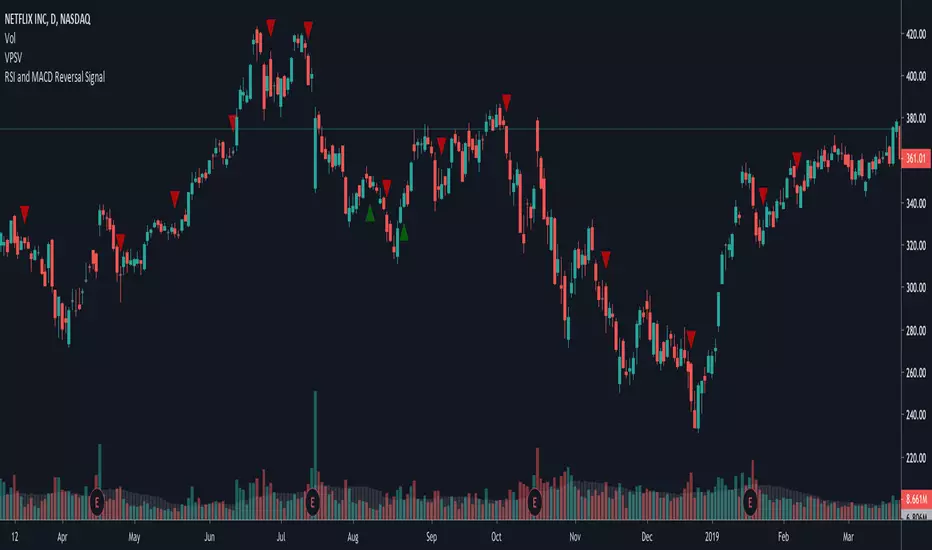
~RMCF~ RSI and MACD Reversal SignalFor AkibaDeep. Checks if RSI < 30 recently and if MACD diverges, placing a buy signal. Then, places a sell signal when MACD converges back.
P-Signal v1.2A new program inspires confidence if the code is open and the algorithm
is based on a model whose axioms are beyond doubt.
The pricing process is not deterministic, but it is clearly subject to some kind of law.
In search of an answer I have analyzed the probabilistic space in which the axiom of choice would be fair.
The answer turned out to be unexpectedly simple and quite often discussed - entropy.
P-Signal is based on its properties.
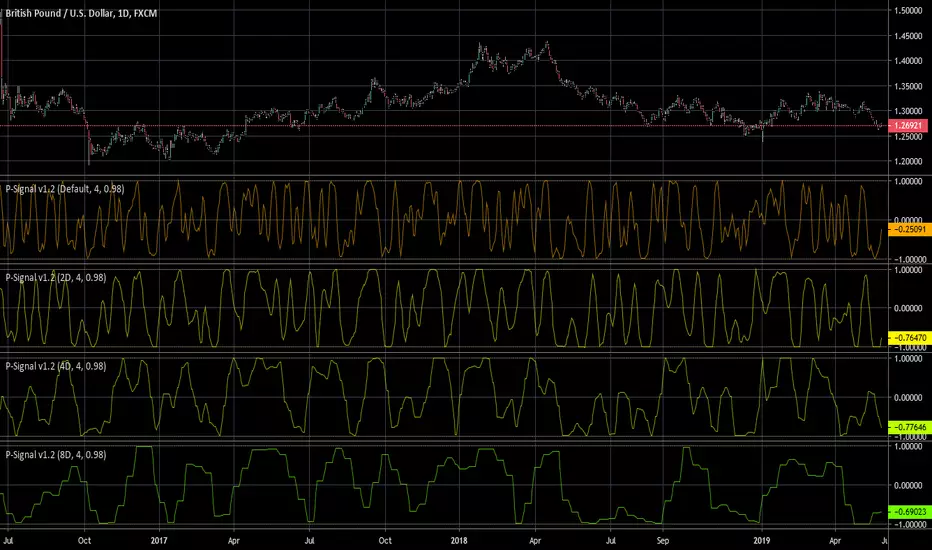
P-Signal v1.2 is an open PINE script unifying version all of previously published P-Signals.
It allows to simultaneously observe the state of entropy of any time-frames.
MTA-Traling StopIntroduction
Based on my previous indicator , this indicator plot a trailing stop using classic conditions.
Using The Indicator
Like any trailing stop when price is higher than the trailing stop this imply a buy signals, when price is lower than the trailing stop this imply a sell signal. It is possible to use decimals instead of integers for length as shown here :
length = 14.7
The indicator tend to react faster to price movements when a trend has been really long, this methodology is similar to the one used by the parabolic sar.
Downsides
Lack of robustness with the length parameter, the behaviour of the trailing stop can be hard to predict. There is a real need for control.
Conclusion
The indicator can be adaptive, even if it already is in a certain way, by changing the alpha variable at the start considering that 0 < alpha < 1. Its not recommended to use it right now except for testing/coding purpose.
It is clear that i'm not enthusiast when it come to this script, there is a real lack of accuracy, i still hope it can be of use.

ATR+VWAP Alert//These signals mostly consist of crossovers between a 13 VWMA and a 62 VWMA. I've found these two moving averages to be quite special in their ability to
//recognize a quick trend using volume data. The VWAP is used in the alert system as well, to give some perspective on which direction we are looking to take. We
//are also using ATR. We only take trades when the ATR is on the move, meaning we have a chance to catch a volatile move! Finally, we use RSI to help weed out bad
//trades. We only take 'longs' with bullish readings from RSI, and we only take 'shorts' with bearish readings from RSI. These alerts are fantastic for catching quick intraday
//trades in either direction. I recommend using a small 'take profit' target rather than using an exit indicator. These trades can move 20-30 pips and reverse just as quickly. Good luck!
//How To Use:
//When the alert system is added to the chart, you will notice up/down symbols appear at various locations. For bullish alerts, right click an 'Up' symbol and choose 'Add Alert on VWap & ATR..'
//There are two condition options. 'Long/short', and right below that 'Buy-Signal/Sell-Signal'. Choose 'long' and 'Buy-Signal'. At options, choose 'Once Per Bar Close'. Design your alert, and you're good to go.
//For bearish signals, find a 'down' signal on the chart. Right click and follow the same process, except choosing 'short/Sell-Signal' conditions.
Tips:
Use VWAP as a stop-loss. If a candle closes below/above the VWAP in the direction against you.. get out of the trade. The losses will be minimal and few compared to the wins. Use discretion and trade carefully. This works great with crypto. Invent your own exit. If you come up with a clever exit, please share!
You can contact me at my Discord!
discord.gg

Peak/Valley EstimationEarly Signal
Estimating the Peaks and Valleys or extrema of the price is one of the best way to catch up early movements of a trend. Of course there is no perfect way to do so, if we want a perfect estimation of peaks and valleys then we must use a non causal indicator ( repainting ), if we want a causal indicator ( non repainting ) then we will need to tradeoff accuracy for allowing our indicator to be causal, its always a matter of tradeoff at the end when trying to have a desired effect (smoothness/lag for filters) .Our indicator is causal, it wont repaint but the accuracy will depend on various parameters.
In order to detect peaks and valleys in a certain period we must detrend the price, this mean subtracting it by its moving average. We take the absolute value of this result and we filter it with a local linear regression ( LSMA ) in order to eliminate noise, then we make the assumption that the highest of our result is or a peak or a valley of the price, so we divide our detrended calculation by its highest and we get a scaled result. Lets call this final result the peak index .
Parameters
There are 3 parameters in this indicator, a length parameter who control the period of the highest mentioned above, a smooth parameter who smooth our detrended price, and finally a mod parameter who select the trigger method for estimating a peak/valley.
Here are how mods work :
mod = 1 : when the peak index is equal to 1 and the previous value is not equal to 1 then we have a peak/valley. Its the fastest of the 3 mods but the one with less accuracy.
mod = 2 : when the peak index crossunder 0.8 then we have a peak/valley. This method is more robust but slower than the previous one.
mod = 3 : when the peak index is not equal to 1 and the previous peak index is equal to 1 then we have a peak/valley. Its an average of the precedents mod in term of speed and accuracy.
Lower length values tend to estimate the peak/valley of short periods of time but can also lead to the reverse desired effect ( breakouts signals ). Smoothing is important since it reduce the number of noise in our calculation and therefore help to get better results, its a parameter that should be high, sometimes higher than length if this one is low.
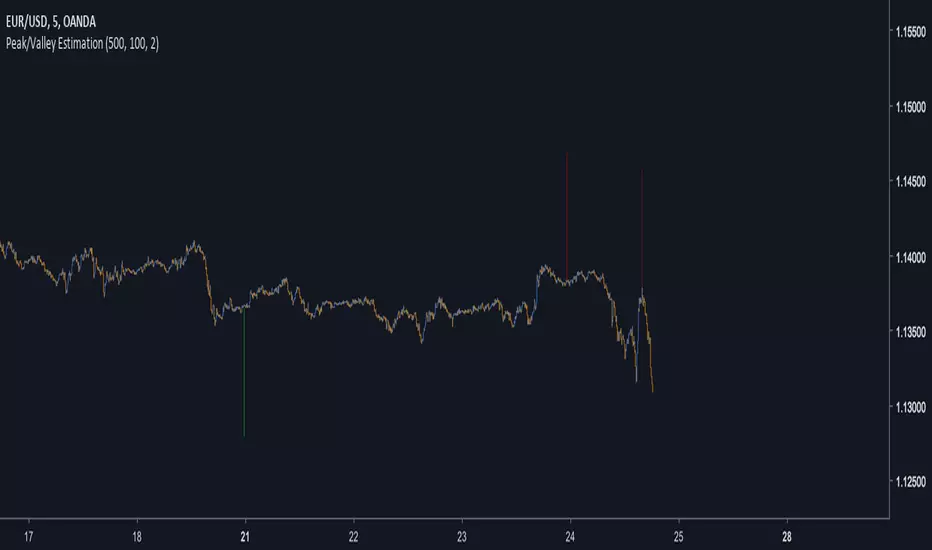
Estimation of medium terms peaks/valleys with length and smooth parameter both period 100 and mod = 3
Estimation peaks in palladium way to early, an example of bad accuracy. Such behaviour can be fixed with a change in the parameters.
Complementarity With Classics Indicators
As i said before its always a matter of tradeoff, here we get faster signals but we loose in accuracy, at the contrary classics indicators often have slower signals but with more accuracy. Mixing both of them can provide additional robustness in a strategy, lets take back our palladium case, using mod 3 could have been better, but its still not optimal, so lets use a classic indicator such as a moving average of period 200, our conditions are :
Long when our peak/valley estimator estimated a valley and the price crossover our moving average.
Short when our peak/valley estimator estimated a peak and the price crossunder our moving average.
here is an exemple of such signal :
We balanced our tradeoff in a way to fix both methods problems, of course its still not a perfect fix but it provide more robustness.
Other Uses
The indicator can also be used only as an order closing indicator, its safer than taking a position based on its estimation. The indicator can also give a use to the peak index used in the calculation as a trend strength indicator.
Values below 0.5 indicate a ranging market while values over 0.5 indicate a trending market.Since its a scaled measure you can use it a smoothing constant in a adaptive filter.
Conclusions
I showed how to estimate peaks and valleys and how to use such information in order to make better decision when using classical indicators, of course at the end nothing is perfect and considering the non stationarity of the markets the parameters efficiency could change drastically.
For any questions/demands feel free to pm me, i would be happy to help you
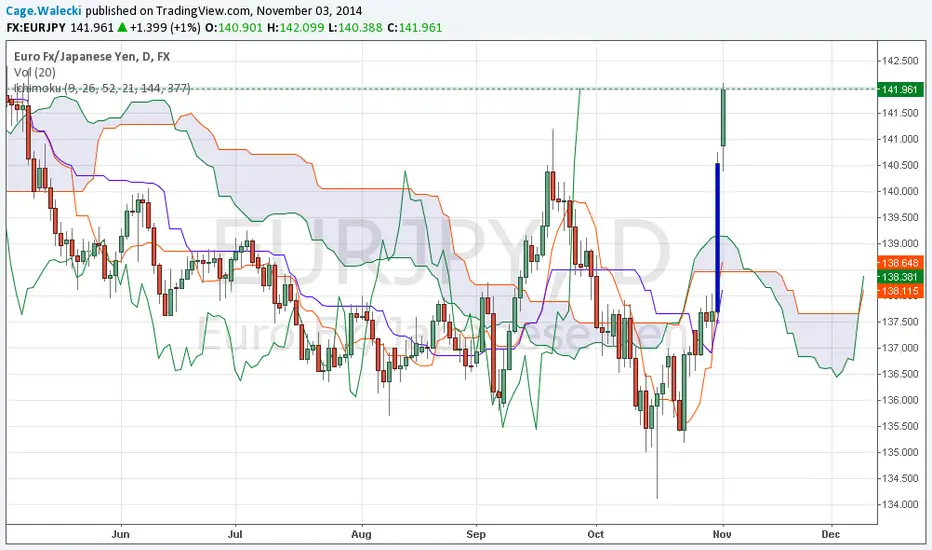
Cloud, MA & BB Signal ConvergenceA combination of 3 popular lagging indicators (Ichimoku Cloud, Moving Average and Bollinger Bands) that generates a signal when all 3 of those lagging indicators are bullish or bearish.
Bullish is represented with a green dot above price. Bearish is represented with a red dot below price.
PARAMETERS:
1) Ichimoku Cloud
-Bullish Kumo
-Price above Kumo
-Chikou span above price
-Tenkan-sen and Kijun-sen above Kumo
-Tenkan-sen above Kijun-sen
-Price above Tenkan-sen
*opposite for bearish
Note: cloud settings is the popular settings for cryptocurrency advocated by @CarpeNoctom.
2) Moving Average
-MA1 greater than MA2
-MA2 greater than MA3
-MA3 greater than MA4
-MA4 greater than MA5
*opposite for bearish
Note: Put your MA setting from lowest to highest on MA1-MA5 respectively to generate more accurate signals.
3) Bollinger Bands
-price closed above upper band at least once
*opposite for bearish
Note: Put your MA setting from lowest to highest on MA1-MA5 respectively to generate more accurate signals.
P.S. Still on early alpha stage.

Candlestick normalizer + MA's Crossing SignalingWell, after 25 tries I finally did it ._.
Here is the candlestick normalizer I was trying to achieve. In this way you can do a fast and not biased by price candlestick analysis, for example to catch engulfish and doji's on the go ;)
I also added a MAs crossing-over signal I optimized.
Btw, I will try to add volume signaling on this indicator. I had been thinking in 2 options:
1) Maybe as a colour/unfilled bar when volume exceed average
2) Represent the volume on the width of the candlestick.
What do you prefer? Let me know.
I hope you enjoy it!
Phi it.

SMMA Analyses - Buy / Sell signals and close position signals This script combines the usage of the SMMA indicator in order to provide signals for opening and closing trades, either buy or sell signals.
It uses two SMMA , a fast and a slow one, both configurable by the users.
The trigger of Buy and Sell Signals are calculated through the SMMA crosses:
Buy Signals : The fast SMMA crosses over the slow SMMA . They are highlighting by a green area and a "B" label.
Sell Signals : The fast SMMA crosses under the slow SMMA . They are highlighting by a red area and a "S" label
The trigger of Close Buy and Close Sell Signals are calculated through the close price crosses with the fast SMMA:
Close Buy Signals : The fast SMMA crosses under the close price and at the same time the trend is bullish , so the fast SMMA is greater than the slow SMMA . They are highlighted by a lighter green area
Close Sell Signals : The fast SMMA crosses over the close price and at the same time the trend is bearish , so the fast SMMA is lower than the slow SMMA . They are highlighted by a lighter red area
Few important points about the indicator and the produced signals :
This is not intended to be a strategy, but an indicator for analyzing the SMMA conditions. It gives you the triggers depending on the real time analysis of the SMMA and prices, but not being a proper strategy, pay attention about "fake signals" and add always a visual analysis to the provided signals
Following this indicator, the trade positions should be opened only when a cross happens. Either in this case, analyse the chart in order to see if the signals are a "weak" ones, due to "waves" around the SMMA . In these cases, you might wait for the next confirmation signals after the waves, when the trend will be better defined
The close trade signals are provided in order to help to understand when you should close the buy or sell trades. Even in this case, always add a visual analysis to the signals, and pay attention to the support/resistance areas. Sometimes, you can have the close signals in correspondence to support/resistance areas: in these cases wait for the definition of the trend and eventually for the next close trade signals if they will be better defined

MATZ BB SignalerBollinger Band with Buy/Sell Signals
Buy = IF 4H MACD Histogram is increasing AND Price is increasing
Sell = IF 4H MACD Histogram is deacreasing AND Price is decreasing

4X Global Trend SignalNOTE: This is an invite-only script for paying 4X Global Members.
When you request access, please provide your 4X Global username. I cannot provide access until I cross-check your 4X Global account to verify that you have one and that it is active.
If you are not a 4X Global member and want access; a 4X Global Membership is only $19 per month. You can read more: Click Here
I had 4X Global code this indicator based on several of their tools. This indicator is a combination of several 4X Global data sources. When all of the sources confirm a trend (based on my criteria), the indicator draws a 'buy' or 'sell' label on the chart. This is a very simple indicator to use and it's darn accurate. I may automate it at some point.
This indicator does NOT repaint, but it will flash on/off during the current bar until it closes. Do NOT enter a trade until the current bar closes with a signal. You enter at the open of the succeeding candle (i.e. the candle immediately after the signal candle).
There is only one variable to adjust; 'Risk'. When you increase the Risk variable, you are increasing your trading risk because the indicator will not respond as fast. However, I have found that higher settings filter out the noise better.
For me, the sweet spot seems to be on the 30 minute chart with a Risk value of '24'. If you find additional 'sweet spots' for this indicator, please share them with your fellow 4X Global members.
Please direct any/all support question to me. I will do my best to answer them.
This is not investment advice, just my opinion(s). Please trade accordingly.
Trade safe and keep an eye on news.

TonyUX EMA Scalper - Buy / SellThis is a simple scalping strategy that works for all time frames... I have only tested it on FOREX
It works by checking if the price is currently in an uptrend and if it crosses the 20 EMA.
If it crosses the 20 EMA and its in and uptrend it will post a BUY SIGNAL.
If it crosses the 20 EMA and its in and down it will post a SELL SIGNAL.
The red line is the highest close of the previous 8 bars --- This is resistance
The green line is the lowest close of the previous 8 bars -- This is support

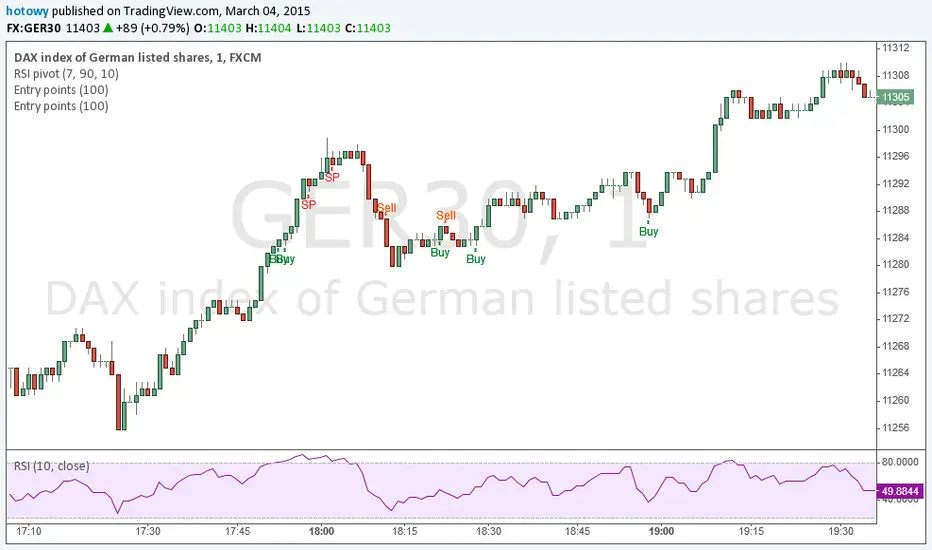
Entry pointsThis great and simple indicator based on EMA generates information about entry points at close of the candle. First signal is the best entry point but you can re-enter at the next. IMPORTANT: this script does not generate exit signals and those shoud be find using money management rules or else. Perfectly catches long runs in trends at all underlayings (forex, stocks, indexes, commodities) at all timeframes. Period=100 works best independently on timeframe but I encourage you to try other. Lower period gives more incorrect signals and shorter runs, higher period gives you late entry and less. Ofcourse it gives false signals from time to time but fortunately it makes a correction very fast. Try it! Good luck and good traiding!
SuperTrend Long/Short Signals“Provides trend-based long and short signals. With regular use while adhering to the entry, stop-loss, and take-profit levels, profits can be achieved.”

Swing Trading Indicator: RSI + EMA + MACD + BB Signals**Swing Trading Indicator: Multi-Indicator Confluence Signals**
This indicator identifies high-probability swing trading setups using RSI pullbacks, EMA trend filter, MACD momentum confirmation, and Bollinger Bands for volatility-based entries. Perfect for daily/4H charts on stocks like TSLA or SPY.
**Key Features:**
- **Long Signal (Green ↑ Arrow)**: Uptrend (above 200 EMA) + RSI crosses above oversold (default 30) + MACD bullish crossover + Price at/near BB lower band + Optional squeeze filter.
- **Short Signal (Red ↓ Arrow)**: Mirror for downtrends.
- **Real-Time Dashboard**: Top-right table shows condition status (✓/✗) and "LONG/SHORT READY" alerts.
- **Customizable**: Adjust RSI levels, BB multiplier, enable/disable shorts/squeeze/arrows.
- **Alerts**: Built-in for entry notifications.
**How to Use:**
1. Add to chart (daily timeframe recommended).
2. Watch for arrows + "READY" in dashboard.
3. Manual entry: Risk 1% per trade, target 1:2 reward (e.g., trail stops).
**Backtest Note**: Based on similar setups, ~55-65% win rate in trending markets (test yourself). Not financial advice—trading involves risk. Fork and improve!
#swingtrading #RSI #MACD #BollingerBands #PineScript

Ahmed Gold Signals - 5M LIVE (Frequent)📈 Gold (XAUUSD) Trading Signals – Precision-Based Strategy
Our Gold signals are built on pure price action, not random indicators or guesswork.
🔍 How our signals are generated
We focus on:
🧲 Liquidity Sweeps
Identifying when price grabs stop-losses above highs or below lows and then reverses
📊 Clear trend direction using EMA 50 & EMA 200
✅ Strong confirmation candles after the sweep
🎯 Entries only in the direction of the trend to increase accuracy
🔵 BUY Signals
Bullish market structure
Price sweeps liquidity below recent lows
Strong bullish confirmation candle closes
➡️ High-probability BUY setup
🔴 SELL Signals
Bearish market structure
Price sweeps liquidity above recent highs
Strong bearish confirmation candle closes
➡️ High-probability SELL setup
⏱️ Timeframe
5-minute chart (5M)
Fast, precise signals ideal for scalping Gold
🛡️ Risk Management
Stop loss placed beyond the liquidity sweep
Clear take-profit targets
Risk-to-reward typically 1:2 or better
⚠️ Important Notes
We do not trade every move
We wait for confirmation
Quality over quantity — always
