Gradient Range [BigBeluga]
This indicator highlights range-bound market conditions by dynamically plotting gradient-colored candlesticks within a defined price box. It detects whether the market is ranging or trending using ADX and can identify mean reversion points when price steps outside the established range.
🔵KEY FEATURES:
Range Detection Box:
➣ A transparent box is drawn based on the highest and lowest price close over a user-defined period.
➣ Helps visualize range boundaries and the midline for support/resistance reference.
Gradient Candlestick Coloring:
➣ Candles inside the range are colored with a gradient from top to bottom based on proximity to the midline.
➣ Top range candles are shaded with bearish tones, while bottom range candles use bullish tones.
Ranging/Trending State Detection:
➣ Uses ADX to determine if the market is currently in a ranging or trending state.
➣ A label in the bottom right corner shows a real-time status (🟢 Ranging / 🟡 Trending).
Mean Reversion Signal Circles:
➣ When the market is ranging, white circles are plotted at highs/lows that breach the box boundary, indicating potential mean reversion points.
➣ These levels can act as fade trade setups or exhaustion markers.
🔵USAGE:
Range Trading: Trade between the upper and lower boundaries during range-bound conditions with clearer visual feedback.
Mean Reversion Plays: Use circle signals as early alerts to identify when price extends beyond the range and may revert to the mean.
Visual Trend Strength: Instantly recognize where price is concentrated inside the range via the color gradient system.
Ranging Filter: Use the ADX label to avoid false setups during strong trending periods.
Gradient Range provides an elegant and data-driven approach to range-bound market analysis. With its gradient visualization and smart reversion detection, it empowers traders to better time entries and exits within consolidation zones.
Cari dalam skrip untuk "signal"

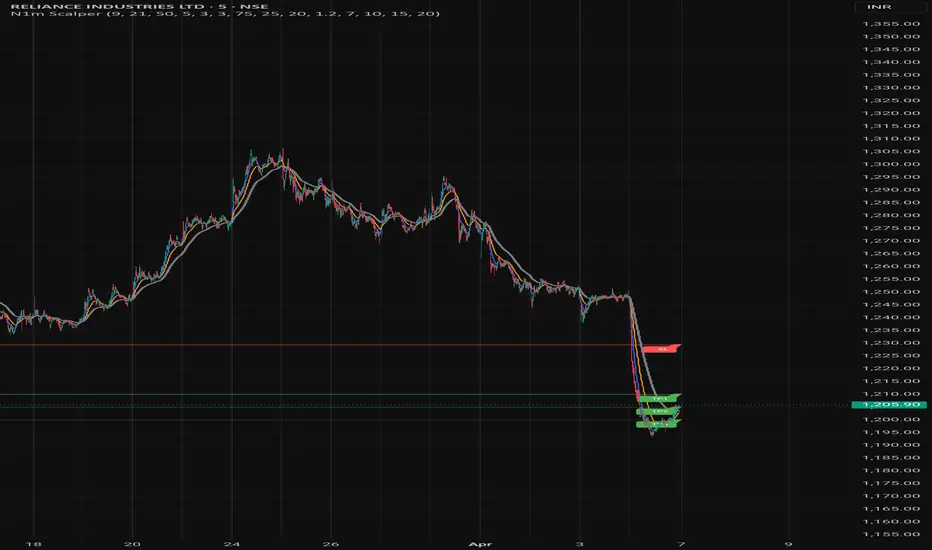
Nifty 1m EMA Pullback Scalper Signals
### **Master the Market with the Sniper Scalping Strategy for Nifty (1-Minute Timeframe)**
Unlock the power of precision trading with this expertly crafted **Sniper Scalping Strategy**, designed specifically for the Nifty index on a lightning-fast 1-minute timeframe. Perfect for traders who thrive on quick decisions and small, consistent profits, this strategy combines multiple indicators to deliver razor-sharp entries and exits—ideal for India’s dynamic market.
#### **Why This Strategy Stands Out**
- **Pinpoint Accuracy**: Harness the synergy of the **5 EMA and 10 EMA crossover** to lock onto the short-term trend, while the **Stochastic Oscillator (14,3,3)** times your entries and exits with surgical precision.
- **Fast and Effective**: Tailored for the 1-minute chart, this strategy capitalizes on Nifty’s volatility, targeting **10-point profits** with a tight **5-point stop-loss**—keeping your risk low and rewards high.
- **Trend + Momentum**: Blend trend-following (EMAs) with momentum signals (Stochastic) for a robust, multi-dimensional approach that cuts through market noise.
#### **How It Works**
- **Buy Signal**: Enter long when the 5 EMA crosses above the 10 EMA and the Stochastic rises above 20—catching the uptrend at its sweet spot.
- **Sell Signal**: Go short when the 5 EMA dips below the 10 EMA and the Stochastic falls below 80—riding the downtrend with confidence.
- **Exit Like a Pro**: Take profits at 10 points or when the Stochastic hits overbought/oversold extremes, ensuring you’re in and out before the market shifts.
#### **Perfect for Nifty Scalpers**
Built for the fast-paced world of Nifty trading, this strategy shines during high-volatility sessions like the market open or global overlaps. Whether you’re a beginner honing your skills or a seasoned trader seeking consistency, the Sniper Scalping Strategy offers a clear, actionable framework to scalp profits with discipline and precision.
#### **Get Started**
Test it in a demo account, refine it to your style, and watch your scalping game soar. Trade smart, stay focused, and let the Sniper Scalping Strategy turn Nifty’s 1-minute moves into your edge!
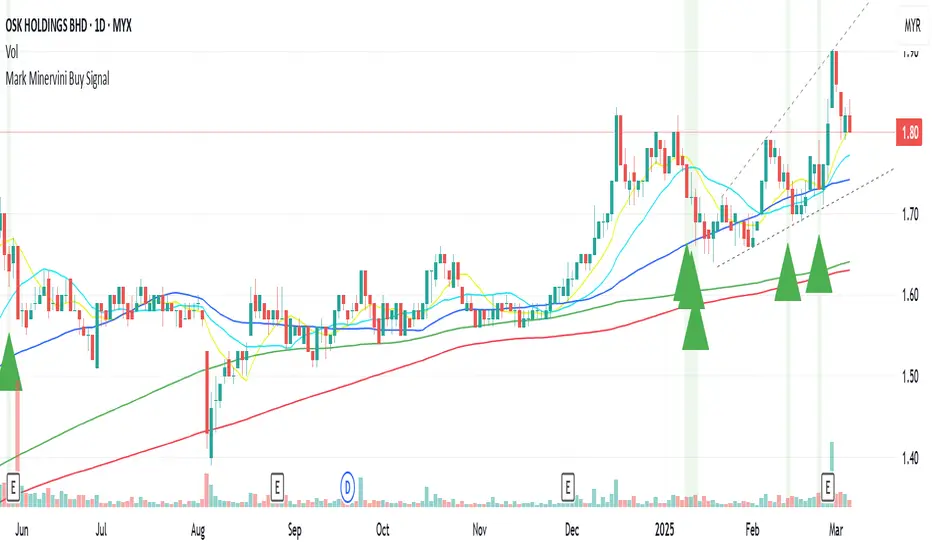
Mark Minervini Buy Signal# Mark Minervini Buy Signal Indicator
This indicator implements Mark Minervini's "Stage 2 Uptrend" buy criteria from his SEPA (Specific Entry Point Analysis) methodology as described in his books "Trade Like a Stock Market Wizard" and "Think & Trade Like a Champion". The script identifies potential buy setups based on Minervini's technical criteria for stocks showing strong momentum characteristics.
## How It Works
The indicator evaluates various technical conditions to identify stocks in a Stage 2 uptrend according to Minervini's methodology:
1. **Moving Average Alignment**
- 150-day MA above 200-day MA (confirming overall uptrend)
- 200-day MA trending up (compared to 20 days ago)
- 50-day MA above both 150-day and 200-day MAs (showing recent strength)
- Price above all major moving averages (50, 150, 200-day MAs)
2. **Price Relative to 52-Week Range**
- Price at least 25% above 52-week low (showing strong recovery)
- Price within 75-95% of 52-week high (room for further upside)
3. **Relative Strength**
- Stock ranks in the top 30% based on 100-day price performance
- This implements Minervini's emphasis on buying only strong performers
4. **Volume Criteria**
- Volume above its 50-day moving average (showing increasing interest)
## How to Use This Indicator
When all conditions are met, the indicator displays a green triangle below the price bar and colors the background green. These signals identify potential candidates for further analysis. According to Minervini's methodology, you should:
1. Use this as a screening tool to identify potential candidates
2. Perform additional chart analysis to identify specific entry points
3. Look for decreased volatility and proper bases or consolidation patterns
4. Consider broader market conditions and sector strength before entering
## Sources and Credit
This indicator is based on Mark Minervini's trading methodology as outlined in:
1. Minervini, Mark. "Trade Like a Stock Market Wizard: How to Achieve Super Performance in Stocks in Any Market" (2013)
2. Minervini, Mark. "Think & Trade Like a Champion: The Secrets, Rules & Blunt Truths of a Stock Market Wizard" (2016)
3. Minervini, Mark. "Mindset Secrets for Winning: How to Bring Personal Power to Everything You Do" (2019)
4. Interviews and workshops where Minervini has described his SEPA methodology
The specific criteria implemented are derived from Minervini's "Stage Analysis" framework, particularly focusing on Stage 2 uptrends which he considers optimal for buying opportunities.
## Disclaimer
This indicator is provided for informational purposes only. It attempts to reproduce Minervini's published criteria but should be used as part of a complete trading strategy with proper risk management. Minervini's complete methodology includes additional subjective elements that cannot be fully automated.
ATR Levels and Zones with Signals📌 ATR Levels and Zones with Signals – User Guide Description
🔹 Overview
The ATR Levels and Zones with Signals indicator is a volatility-based trading tool that helps traders identify:
✔ Key support & resistance levels based on ATR (Average True Range)
✔ Buy & Sell signals triggered when price enters key ATR zones
✔ Breakout confirmations to detect high-momentum moves
✔ Dynamic Stop-Loss & Take-Profit suggestions
Unlike traditional ATR bands, this indicator creates layered ATR zones based on multiple ATR multipliers, allowing traders to gauge volatility and risk-adjust their trading strategies.
🔹 How It Works
🔸 The script calculates a baseline SMA (Simple Moving Average) of the price.
🔸 ATR (Average True Range) is then used to create six dynamic price levels above & below the baseline.
🔸 These levels define different risk zones—higher levels indicate increased volatility and potential trend exhaustion.
📈 ATR Zones Explained
🔹 Lower ATR Levels (Buying Opportunities)
📉 Lower Level 1-2 → Mild Oversold Zone (Potential trend continuation)
📉 Lower Level 3-4 → High Volatility Buy Zone (Aggressive traders start scaling in)
📉 Lower Level 5-6 → Extreme Oversold Zone (High-Risk Reversal Area)
🔹 If price enters these lower zones, it may indicate a potential buying opportunity, especially if combined with trend reversal confirmation.
🔹 Upper ATR Levels (Selling / Take Profit Zones)
📈 Upper Level 1-2 → Mild Overbought Zone (Potential pullback area)
📈 Upper Level 3-4 → High Volatility Sell Zone (Aggressive traders start scaling out)
📈 Upper Level 5-6 → Extreme Overbought Zone (High-Risk for Reversal)
🔹 If price enters these upper zones, it may indicate a potential selling opportunity or trend exhaustion, especially if momentum slows.
🔹 Sensitivity Modes
🔹 Aggressive Mode (More Frequent Signals) → Triggers buy/sell signals at Lower/Upper Level 3 & 4
🔹 Conservative Mode (Stronger Confirmation) → Triggers buy/sell signals at Lower/Upper Level 5 & 6
📌 Choose the mode based on your trading style:
✔ Scalpers & short-term traders → Use Aggressive Mode
✔ Swing & trend traders → Use Conservative Mode for stronger confirmations
🚀 How to Use the Indicator
🔹 For Trend Trading:
✅ Buy when price enters the lower ATR zones (especially in uptrends).
✅ Sell when price enters the upper ATR zones (especially in downtrends).
🔹 For Breakout Trading:
✅ Breakout Buy: Price breaks above Upper ATR Level 3 → Momentum entry for trend continuation
✅ Breakout Sell: Price breaks below Lower ATR Level 3 → Momentum short opportunity
🔹 Stop-Loss & Take-Profit Suggestions
🚨 Stop-Loss: Suggested at Lower ATR Level 6 (for longs) or Upper ATR Level 6 (for shorts)
🎯 Take-Profit: Suggested at Upper ATR Level 3 (for longs) or Lower ATR Level 3 (for shorts)
🔹 Why This Indicator is Unique
✔ Multiple ATR layers for better risk-adjusted trading decisions
✔ Combines ATR-based zones with SMA trend confirmation
✔ Both aggressive & conservative trading modes available
✔ Includes automatic stop-loss & take-profit suggestions
✔ Breakout signals for momentum traders
📢 Final Notes
✅ Free & open-source for the TradingView community!
⚠ Risk Warning: Always confirm signals with other confluences (trend, volume, support/resistance) before trading.
📌 Developed by: Maddog Blewitt
📩 Feedback & improvements are welcome! 🚀

Time-based Alerts for Trading Windows🌟 Time-based Alerts for Trading Windows 🌐📈
This is a re-uploaded script as the previous one got hidden.
This Time-based Alerts for Trading Windows script is a highly customizable and reliable tool designed to assist traders in managing automated strategies or manually monitoring specific market conditions. Inspired by CrossTrade's Time-based Alert, this script is tailored for those who rely on precise time windows to trigger actions, such as sending webhook signals or managing Expert Advisors (EAs).
Whether you are a scalper, day trader, or algorithmic trader, this script empowers you to stay on top of your trades with fully customizable time-based alerts.
🛠️ Customizable Time Alerts
This indicator allows you to create up to 12 unique time windows by specifying the exact hour and minute for each alert. Each time window corresponds to an individual alert condition, making it perfect for managing trades during specific market sessions or key time periods.
For example:
Alert 1 can be set at 9:30 AM (market open).
Alert 2 can be set at 3:55 PM (just before market close).
Each alert can be toggled on or off in the indicator settings, allowing you to manage alerts without having to reconfigure your script.
You can adjust the colours to fit any colour scheme you like!
🕒 Odd and Even Time Alerts
The script comes with three built-in alert type categories:
Odd Alerts (marked with a green triangle on the chart): These correspond to odd-numbered inputs like Alert 1, Alert 3, Alert 5, and so on.
Even Alerts (marked with a red triangle on the chart): These correspond to even-numbered inputs like Alert 2, Alert 4, Alert 6, and so on.
You can also customize all 12 alerts individually to include a custom alert message
These alerts serve as a convenient way to differentiate between multiple trading strategies or market conditions. You can customize alert messages for odd and even alerts directly from TradingView’s alert panel.
🔗 Webhook Integration for Automation
This script is fully compatible with webhook-based automation. By configuring your alerts in TradingView, you can send signals to trading bots, EAs, or any third-party system. For example, you can:
Turn off an EA at a specific time (e.g., 3:55 PM EST).
Send buy/sell signals to your bot during predefined trading windows.
Simply use TradingView’s alert message editor to format webhook payloads for your automation system.
🌐 Timezone Flexibility
Trading happens across multiple time zones, and this script accounts for that. You can toggle between:
Eastern Time (New York): Ideal for most US-based markets.
Central Time (Exchange): Useful for futures and commodities traders.
This ensures your alerts are always in sync with your preferred time zone, eliminating confusion.
🎨 Visual Indicators
The script plots visual markers directly on your chart to indicate active alerts:
Up Facing Triangles: Represent odd-numbered alerts, providing a quick reference for these time windows.
Down Facing Triangles: Represent even-numbered alerts, helping you track different strategies or conditions.
These visual markers make it easy to see when alerts are triggered, even at a glance.
📈 Practical Use Case
Let’s say you’re trading the USTEC index on a 1-minute chart. You want to:
Turn off your trading bot at 16:55 EST to avoid after-market volatility.
Trigger a re-entry signal at 17:30 EST to capture moves during the Asian session.
Visually monitor these actions on your chart for easy reference.
This script makes it possible with precision alerts and webhook integration. Simply configure the time windows in the settings and set up your alerts in TradingView.
🚨 How to Set Up Alerts
Enable or Disable Alerts: Use the script’s settings to toggle specific alerts on or off as needed.
Set Custom Time Windows: Define the hour and minute for each alert in the settings panel.
Create Alerts in TradingView:
Go to the TradingView alert panel.
Select the condition (e.g., "Odd Time-based Alert (Green)" or "Even Time-based Alert (Red)").
Customize the alert message for webhook integration or personal notification.
Choose the trigger type: Once Per Bar or Once Per Bar Close to keep the alert active.
Integrate with Webhooks: Use the alert message field to format payloads for automation systems like MT4, MT5, or third-party bots.
📋 Key Notes
Alerts can trigger indefinitely if set to "Once Per Bar" or "Once Per Bar Close".
Always ensure the expiration date is set far in the future to avoid unexpected alert deactivation.
Test webhook messages and alert configurations thoroughly before using them in live trading.
This script is a powerful addition to your trading toolbox, offering precision, flexibility, and automation capabilities. Whether you’re turning off an EA, managing trades during market sessions, or automating strategies via webhooks, this script is here to support you.
Start using the Time-based Alerts for Trading Windows today and trade with confidence! 🚀✨

[SHORT ONLY] 10 Bar Low Pullback█ STRATEGY DESCRIPTION
The "10 Bar Low Pullback" strategy is a contrarian short trading system designed to capture pullbacks after a new 10‐bar low is made. it identifies a potential short opportunity when the current bar’s low breaks below the lowest low of the previous 10 bars, provided that the bar exhibits strong internal momentum as measured by its IBS value. An optional trend filter further refines entries by requiring that the close is below a 200-period EMA.
█ WHAT IS INTERNAL BAR STRENGTH (IBS)?
Internal Bar Strength (IBS) measures where the closing price falls within the high-low range of a bar. It is calculated as:
ibs = (close - low) / (high - low)
- Low IBS (≤ 0.2): Indicates the close is near the bar's low, suggesting oversold conditions.
- High IBS (≥ 0.8): Indicates the close is near the bar's high, suggesting overbought conditions.
█ SIGNAL GENERATION
1. SHORT ENTRY
A Short Signal is triggered when:
The current bar’s low is below the lowest low of the past X bars (default: 10).
The bar’s IBS is greater than the specified threshold (default: 0.85).
The signal occurs within the defined trading window (between Start Time and End Time).
If the EMA Filter is enabled, the close must be below the 200-period EMA.
2. EXIT CONDITION
An exit Signal is generated when the current close falls below the previous bar’s low (close < low ), indicating a potential bearish reversal and prompting the strategy to close its short position.
█ ADDITIONAL SETTINGS
Lookback Period: Defines the number of bars (default is 10) over which the lowest low is calculated.
IBS Threshold: Sets the minimum required IBS value (default is 0.85) to qualify as a pullback.
Trading Window: Trades are only executed between the user-defined Start Time and End Time.
EMA Filter (Optional): When enabled, short entries are only considered if the current close is below the 200-period EMA, with the EMA period being adjustable (default is 200).
█ PERFORMANCE OVERVIEW
Designed for shorting opportunities, this strategy aims to capture pullbacks following an aggressive 10-bar low break.
It leverages a combination of a lookback low and IBS measurement to identify overextended bullish moves that may revert.
The optional EMA filter helps confirm a bearish market environment by ensuring the price remains under the trend line.
Suitable for use on various assets, including stocks and ETFs, on daily or similar timeframes.
Backtesting and parameter optimization are recommended to tailor the strategy to specific market conditions.

[SHORT ONLY] Consecutive Bars Above MA Strategy█ STRATEGY DESCRIPTION
The "Consecutive Bars Above MA Strategy" is a contrarian trading system aimed at exploiting overextended bullish moves in stocks and ETFs. It monitors the number of consecutive bars that close above a chosen short-term moving average (which can be either a Simple Moving Average or an Exponential Moving Average). Once the count reaches a preset threshold and the current bar’s close exceeds the previous bar’s high within a designated trading window, a short entry is initiated. An optional EMA filter further refines entries by requiring that the current close is below the 200-period EMA, helping to ensure that trades are taken in a bearish environment.
█ HOW ARE THE CONSECUTIVE BULLISH COUNTS CALCULATED?
The strategy utilizes a counter variable, `bullCount`, to track consecutive bullish bars based on their relation to the short-term moving average. Here’s how the count is determined:
Initialize the Counter
The counter is initialized at the start:
var int bullCount = na
Bullish Bar Detection
For each bar, if the close is above the selected moving average (either SMA or EMA, based on user input), the counter is incremented:
bullCount := close > signalMa ? (na(bullCount) ? 1 : bullCount + 1) : 0
Reset on Non-Bullish Condition
If the close does not exceed the moving average, the counter resets to zero, indicating a break in the consecutive bullish streak.
█ SIGNAL GENERATION
1. SHORT ENTRY
A short signal is generated when:
The number of consecutive bullish bars (i.e., bars closing above the short-term MA) meets or exceeds the defined threshold (default: 3).
The current bar’s close is higher than the previous bar’s high.
The signal occurs within the specified trading window (between Start Time and End Time).
Additionally, if the EMA filter is enabled, the entry is only executed when the current close is below the 200-period EMA.
2. EXIT CONDITION
An exit signal is triggered when the current close falls below the previous bar’s low, prompting the strategy to close the short position.
█ ADDITIONAL SETTINGS
Threshold: The number of consecutive bullish bars required to trigger a short entry (default is 3).
Trading Window: The Start Time and End Time inputs define when the strategy is active.
Moving Average Settings: Choose between SMA and EMA, and set the MA length (default is 5), which is used to assess each bar’s bullish condition.
EMA Filter (Optional): When enabled, this filter requires that the current close is below the 200-period EMA, supporting entries in a downtrend.
█ PERFORMANCE OVERVIEW
This strategy is designed for stocks and ETFs and can be applied across various timeframes.
It seeks to capture mean reversion by shorting after a series of bullish bars suggests an overextended move.
The approach employs a contrarian short entry by waiting for a breakout (close > previous high) following consecutive bullish bars.
The adjustable moving average settings and optional EMA filter allow for further optimization based on market conditions.
Comprehensive backtesting is recommended to fine-tune the threshold, moving average parameters, and filter settings for optimal performance.

[SHORT ONLY] Consecutive Close>High[1] Mean Reversion Strategy█ STRATEGY DESCRIPTION
The "Consecutive Close > High " Mean Reversion Strategy is a contrarian daily trading system for stocks and ETFs. It identifies potential shorting opportunities by counting consecutive days where the closing price exceeds the previous day's high. When this consecutive day count reaches a predetermined threshold, and if the close is below a 200-period EMA (if enabled), a short entry is triggered, anticipating a corrective pullback.
█ HOW ARE THE CONSECUTIVE BULLISH COUNTS CALCULATED?
The strategy uses a counter variable called `bullCount` to track how many consecutive bars meet a bullish condition. Here’s a breakdown of the process:
Initialize the Counter
var int bullCount = 0
Bullish Bar Detection
Every time the close exceeds the previous bar's high, increment the counter:
if close > high
bullCount += 1
Reset on Bearish Bar
When there is a clear bearish reversal, the counter is reset to zero:
if close < low
bullCount := 0
█ SIGNAL GENERATION
1. SHORT ENTRY
A Short Signal is triggered when:
The count of consecutive bullish closes (where close > high ) reaches or exceeds the defined threshold (default: 3).
The signal occurs within the specified trading window (between Start Time and End Time).
2. EXIT CONDITION
An exit Signal is generated when the current close falls below the previous bar’s low (close < low ), prompting the strategy to exit the position.
█ ADDITIONAL SETTINGS
Threshold: The number of consecutive bullish closes required to trigger a short entry (default is 3).
Start Time and End Time: The time window during which the strategy is allowed to execute trades.
EMA Filter (Optional): When enabled, short entries are only triggered if the current close is below the 200-period EMA.
█ PERFORMANCE OVERVIEW
This strategy is designed for Stocks and ETFs on the Daily timeframe and targets overextended bullish moves.
It aims to capture mean reversion by entering short after a series of consecutive bullish closes.
Further optimization is possible with additional filters (e.g., EMA, volume, or volatility).
Backtesting should be used to fine-tune the threshold and filter settings for specific market conditions.

[SHORT ONLY] Internal Bar Strength (IBS) Mean Reversion Strategy█ STRATEGY DESCRIPTION
The "Internal Bar Strength (IBS) Strategy" is a mean-reversion strategy designed to identify trading opportunities based on the closing price's position within the daily price range. It enters a short position when the IBS indicates overbought conditions and exits when the IBS reaches oversold levels. This strategy is Short-Only and was designed to be used on the Daily timeframe for Stocks and ETFs.
█ WHAT IS INTERNAL BAR STRENGTH (IBS)?
Internal Bar Strength (IBS) measures where the closing price falls within the high-low range of a bar. It is calculated as:
IBS = (Close - Low) / (High - Low)
- Low IBS (≤ 0.2) : Indicates the close is near the bar's low, suggesting oversold conditions.
- High IBS (≥ 0.8) : Indicates the close is near the bar's high, suggesting overbought conditions.
█ SIGNAL GENERATION
1. SHORT ENTRY
A Short Signal is triggered when:
The IBS value rises to or above the Upper Threshold (default: 0.9).
The Closing price is greater than the previous bars High (close>high ).
The signal occurs within the specified time window (between `Start Time` and `End Time`).
2. EXIT CONDITION
An exit Signal is generated when the IBS value drops to or below the Lower Threshold (default: 0.3). This prompts the strategy to exit the position.
█ ADDITIONAL SETTINGS
Upper Threshold: The IBS level at which the strategy enters trades. Default is 0.9.
Lower Threshold: The IBS level at which the strategy exits short positions. Default is 0.3.
Start Time and End Time: The time window during which the strategy is allowed to execute trades.
█ PERFORMANCE OVERVIEW
This strategy is designed for Stocks and ETFs markets and performs best when prices frequently revert to the mean.
The strategy can be optimized further using additional conditions such as using volume or volatility filters.
It is sensitive to extreme IBS values, which help identify potential reversals.
Backtesting results should be analyzed to optimize the Upper/Lower Thresholds for specific instruments and market conditions.

Volatility Momentum Breakout StrategyDescription:
Overview:
The Volatility Momentum Breakout Strategy is designed to capture significant price moves by combining a volatility breakout approach with trend and momentum filters. This strategy dynamically calculates breakout levels based on market volatility and uses these levels along with trend and momentum conditions to identify trade opportunities.
How It Works:
1. Volatility Breakout:
• Methodology:
The strategy computes the highest high and lowest low over a defined lookback period (excluding the current bar to avoid look-ahead bias). A multiple of the Average True Range (ATR) is then added to (or subtracted from) these levels to form dynamic breakout thresholds.
• Purpose:
This method helps capture significant price movements (breakouts) while ensuring that only past data is used, thereby maintaining realistic signal generation.
2. Trend Filtering:
• Methodology:
A short-term Exponential Moving Average (EMA) is applied to determine the prevailing trend.
• Purpose:
Long trades are considered only when the current price is above the EMA, indicating an uptrend, while short trades are taken only when the price is below the EMA, indicating a downtrend.
3. Momentum Confirmation:
• Methodology:
The Relative Strength Index (RSI) is used to gauge market momentum.
• Purpose:
For long entries, the RSI must be above a mid-level (e.g., above 50) to confirm upward momentum, and for short entries, it must be below a similar threshold. This helps filter out signals during overextended conditions.
Entry Conditions:
• Long Entry:
A long position is triggered when the current closing price exceeds the calculated long breakout level, the price is above the short-term EMA, and the RSI confirms momentum (e.g., above 50).
• Short Entry:
A short position is triggered when the closing price falls below the calculated short breakout level, the price is below the EMA, and the RSI confirms momentum (e.g., below 50).
Risk Management:
• Position Sizing:
Trades are sized to risk a fixed percentage of account equity (set here to 5% per trade in the code, with each trade’s stop loss defined so that risk is limited to approximately 2% of the entry price).
• Stop Loss & Take Profit:
A stop loss is placed a fixed ATR multiple away from the entry price, and a take profit target is set to achieve a 1:2 risk-reward ratio.
• Realistic Backtesting:
The strategy is backtested using an initial capital of $10,000, with a commission of 0.1% per trade and slippage of 1 tick per bar—parameters chosen to reflect conditions faced by the average trader.
Important Disclaimers:
• No Look-Ahead Bias:
All breakout levels are calculated using only past data (excluding the current bar) to ensure that the strategy does not “peek” into future data.
• Educational Purpose:
This strategy is experimental and provided solely for educational purposes. Past performance is not indicative of future results.
• User Responsibility:
Traders should thoroughly backtest and paper trade the strategy under various market conditions and adjust parameters to fit their own risk tolerance and trading style before live deployment.
Conclusion:
By integrating volatility-based breakout signals with trend and momentum filters, the Volatility Momentum Breakout Strategy offers a unique method to capture significant price moves in a disciplined manner. This publication provides a transparent explanation of the strategy’s components and realistic backtesting parameters, making it a useful tool for educational purposes and further customization by the TradingView community.

[COG] Advanced School Run StrategyAdvanced School Run Strategy (ASRS) – Explanation
Overview: The Advanced School Run Strategy (ASRS) is an intraday trading approach designed to identify breakout opportunities based on specific time and price patterns. This script applies the concepts of the Advanced School Run Strategy as outlined in Tom Hougaard's research, adapted to work seamlessly on TradingView charts. It leverages 5-minute candlestick data to set actionable breakout levels and provides traders with visual cues and alerts to make informed decisions.
Features:
Dynamic Breakout Levels: Automatically calculates high and low levels based on the market's behavior during the initial trading minutes.
Custom Visualization: Highlights breakout zones with customizable colors and transparency, providing clear visual feedback for bullish and bearish breakouts.
Configurable Alerts: Includes alert conditions for both bullish and bearish breakouts, ensuring traders never miss a trading opportunity.
Reset Logic: Resets breakout levels daily at the market open to ensure accurate signal generation for each session.
How It Works:
The script identifies key levels (high and low) after a configurable number of minutes from the market open (default: 25 minutes).
If the price breaks above the high level or below the low level, a corresponding breakout is detected.
The script draws breakout zones on the chart and triggers alerts based on the breakout direction.
All levels and signals reset at the start of each new trading session, maintaining relevance to current market conditions.
Customization Options:
Line and box colors for bullish and bearish breakouts.
Transparency levels for breakout visualizations.
Alert settings to receive notifications for detected breakouts.
Acknowledgment: This script is inspired by Tom Hougaard's Advanced School Run Strategy. The methodology has been translated into Pine Script for TradingView users, adhering to TradingView’s policies and community guidelines. This script does not redistribute proprietary content from the original research but implements the principles for educational and analytical purposes.

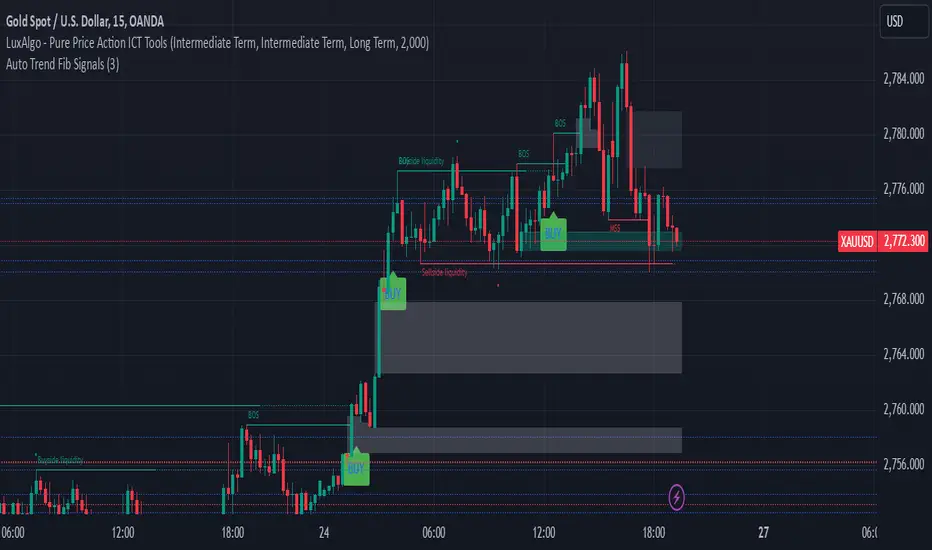
Auto Trend Fib Signals BY studio DivinKey Features
Dynamic SL using ATR volatility measure
Two-Tier Profit Taking for partial/full exits
Automatic Level Calculation based on Fibonacci extensions
Clear Visual Labels with exact price levels
Consistent Risk Management (1.5-2% per trade)
Optimization Table
Parameter Scalping Day Trading Swing Trading
ATR Multiplier 1.0 1.5 2.0
TP1 (1.272) 70% Position 50% Position 30% Position
TP2 (1.618) 30% Position 50% Position 70% Position
Time Frame 15-min 1-hour 4-hour
Pro Tips
Confirm with Volume: Increase volume at Fib levels improves signal reliability
Adjust in Ranging Markets: Use tighter SL (1.0x ATR) during consolidation
Trailing Stop: Move SL to breakeven at TP1 hit
Session Timing: Trade during London/NY overlap for best volatility
Advanced Options Trading Indicator: Buy & Sell Signal Generator This powerful custom indicator combines the Relative Strength Index (RSI) and Moving Average (MA) to help traders identify optimal entry and exit points in the options market. The indicator generates real-time buy and sell signals based on RSI crossovers and price positioning relative to the moving average, providing actionable insights for traders seeking to make informed decisions. Additionally, it calculates potential call and put option strike prices with a buffer for added flexibility and precision, ensuring a well-rounded approach to options trading.

Prime Bands [ChartPrime]The Prime Standard Deviation Bands indicator uses custom-calculated bands based on highest and lowest price values over specific period to analyze price volatility and trend direction. Traders can set the bands to 1, 2, or 3 standard deviations from a central base, providing a dynamic view of price behavior in relation to volatility. The indicator also includes color-coded trend signals, standard deviation labels, and mean reversion signals, offering insights into trend strength and potential reversal points.
⯁ KEY FEATURES AND HOW TO USE
⯌ Standard Deviation Bands :
The indicator plots upper and lower bands based on standard deviation settings (1, 2, or 3 SDs) from a central base, allowing traders to visualize volatility and price extremes. These bands can be used to identify overbought and oversold conditions, as well as potential trend reversals.
Example of 3-standard-deviation bands around price:
⯌ Dynamic Trend Indicator :
The midline of the bands changes color based on trend direction. If the midline is rising, it turns green, indicating an uptrend. When the midline is falling, it turns orange, suggesting a downtrend. This color coding provides a quick visual reference to the current trend.
Trend color examples for rising and falling midlines:
⯌ Standard Deviation Labels :
At the end of the bands, the indicator displays labels with price levels for each standard deviation level (+3, 0, -3, etc.), helping traders quickly reference where price is relative to its statistical boundaries.
Price labels at each standard deviation level on the chart:
⯌ Mean Reversion Signals :
When price moves beyond the upper or lower bands and then reverts back inside, the indicator plots mean reversion signals with diamond icons. These signals indicate potential reversal points where the price may return to the mean after extreme moves.
Example of mean reversion signals near bands:
⯌ Standard Deviation Scale on Chart :
A visual scale on the right side of the chart shows the current price position in relation to the bands, expressed in standard deviations. This scale provides an at-a-glance view of how far price has deviated from the mean, helping traders assess risk and volatility.
⯁ USER INPUTS
Length : Sets the number of bars used in the calculation of the bands.
Standard Deviation Level : Allows selection of 1, 2, or 3 standard deviations for upper and lower bands.
Colors : Customize colors for the uptrend and downtrend midline indicators.
⯁ CONCLUSION
The Prime Standard Deviation Bands indicator provides a comprehensive view of price volatility and trend direction. Its customizable bands, trend coloring, and mean reversion signals allow traders to effectively gauge price behavior, identify extreme conditions, and make informed trading decisions based on statistical boundaries.

Volatility Signaling 50SMAOverview of the Script:
The script implements a volatility signaling indicator using a 50-period Simple Moving Average (SMA). It incorporates Bollinger Bands and the Average True Range (ATR) to dynamically adjust the SMA's color based on volatility conditions. Here's a detailed breakdown:
Components of the Script:
1. Inputs:
The script allows the user to customize key parameters for flexibility:
Bollinger Bands Length (length): Determines the period for calculating the Bollinger Bands.
Source (src): The price data to use, defaulting to the closing price.
Standard Deviation Multiplier (mult): Scales the Bollinger Bands' width.
ATR Length (atrLength): Sets the period for calculating the ATR.
The 50-period SMA length (smaLength) is fixed at 50.
2. Bollinger Bands Calculation:
Basis: Calculated as the SMA of the selected price source over the specified length.
Upper and Lower Bands: Determined by adding/subtracting a scaled standard deviation (dev) from the basis.
3. ATR Calculation:
Computes the Average True Range over the user-defined atrLength.
4. Volatility-Based Conditions:
The script establishes thresholds for Bollinger Band width relative to ATR:
Yellow Condition: When the band width (upper - lower) is less than 1.25 times the ATR.
Orange Condition: When the band width is less than 1.5 times the ATR.
Red Condition: When the band width is less than 1.75 times the ATR.
5. Dynamic SMA Coloring:
The 50-period SMA is colored based on the above conditions:
Yellow: Indicates relatively low volatility.
Orange: Indicates moderate volatility.
Red: Indicates higher volatility.
White: Default color when no conditions are met.
6. Plotting the 50-Period SMA:
The script plots the SMA (sma50) with a dynamically assigned color, enabling visual analysis of market conditions.
Use Case:
This script is ideal for traders seeking to assess market volatility and identify changes using Bollinger Bands and ATR. The colored SMA provides an intuitive way to gauge market dynamics directly on the chart.
Example Visualization:
Yellow SMA: The market is in a low-volatility phase.
Orange SMA: Volatility is picking up but remains moderate.
Red SMA: Higher volatility, potentially signaling significant market activity.
White SMA: Neutral/default state.

Sell Signal - William O'Neil's Rule VisualizationThis indicator might be helpful for traders looking to visualize William O’Neil’s sell condition, a well-known concept in his trading strategies. A sell signal is triggered when:
1. Volume increases compared to the previous day.
2. The price drops by a user-defined percentage (default: 0.2% or more).
The indicator highlights the background for bars meeting these conditions and adds a subtle circle above them. You can adjust the drop rate in the settings to match your preferences.
It could serve as a useful tool for identifying potential distribution days or profit-taking signals, helping traders manage risk during market pullbacks.
このインジケーターは、ウィリアム・オニールの売り抜け条件を可視化したもので、トレーダーの皆さんに役立つかもしれません。シグナルは次の条件を満たすと発生します:
1. 出来高が前日より増加している。
2. 価格がユーザー指定の割合(デフォルトは0.2%以上)で下落している。
条件を満たしたバーには背景色が付き、控えめな丸印が表示されます。設定で下落率を自由に調整することもできます。
このツールは、分配日や利益確定のシグナルを特定するのに役立つかもしれません。市場の調整局面でのリスク管理にご活用ください。

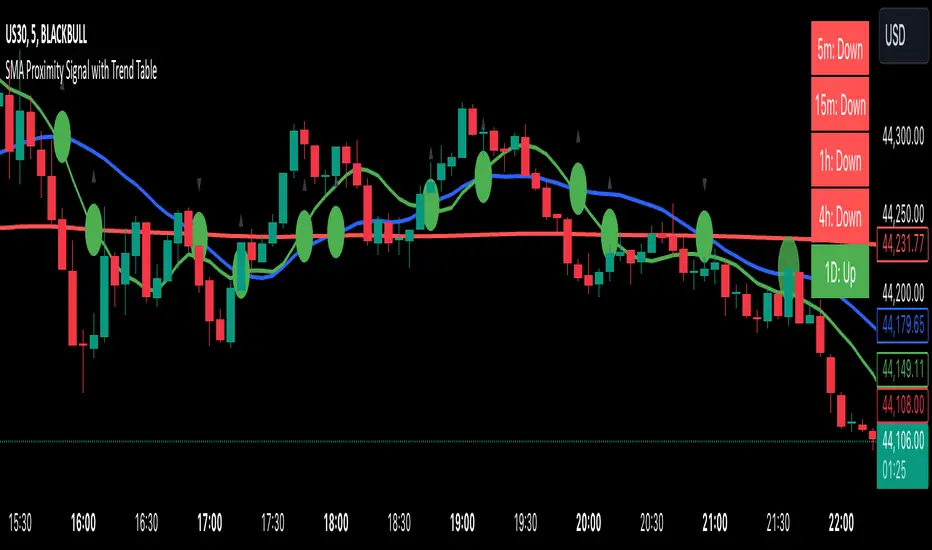
SMA Proximity Signal with Trend TableSummary of the Script:
This Pine Script is designed to provide a variety of technical analysis signals based on Simple Moving Averages (SMAs) and market trends across different timeframes. The script combines multiple indicators, such as the SMA crossover, proximity conditions, and trend analysis, along with visual markers and support/resistance lines. Below is a detailed breakdown of the key features:
The script detects crossovers between SMA1 and SMA2 and SMA1 and SMA3, marking them with green circles exactly at the crossover price level (not on the candles).
The crossover events are identified using ta.crossover and ta.crossunder functions.
Additional circles are drawn when other SMAs are in proximity (narrow stage)
Elephant Candle Pattern:
The script identifies "Elephant Candles" based on a large candle body relative to the overall size of the candle, using the condition where the candle body is at least 80% of the total candle size and at least 1.5 times the average candle size.
These candles are marked with an elephant emoji 🐘 at the top of the candle.
Trend Analysis Across Multiple Timeframes:
The script calculates the trend for different timeframes using the SMA20 of each timeframe:
5m, 15m, 1h, 4h, and 1D
It compares the current SMA20 to its previous value to determine whether the trend is Up, Down, or Flat.
Multi-Timeframe MACD, Signal & Histogram TableThis Pine Script is designed for the TradingView platform to create a multi-timeframe MACD (Moving Average Convergence Divergence), Signal, and Histogram table that displays values for different timeframes. The script uses the MACD indicator to assess market trends across various timeframes and display the results in a table format on the chart. Here's a breakdown of its components and functionality:
1. User Inputs for Timeframes:
The script allows the user to input five different timeframes for the analysis. These are configured using input.string, which enables the user to select from a list of timeframes (from seconds to months).
tf1 to tf5 represent the different timeframes (for example, 5 minutes, 15 minutes, 60 minutes, 240 minutes, and daily).
2. MACD Settings:
The script provides adjustable settings for the MACD calculation:
macdShortLength (default 12): The length of the short-term moving average for the MACD.
macdLongLength (default 26): The length of the long-term moving average for the MACD.
macdSignalLength (default 9): The length of the signal line, which is an EMA (Exponential Moving Average) of the MACD line.
3. MACD Calculation Function (calc_macd):
This function calculates the MACD, Signal, and Histogram values:
MACD Line: Difference between the fast and slow exponential moving averages.
Signal Line: EMA of the MACD line.
Histogram: Difference between the MACD line and Signal line.
4. Requesting Multi-Timeframe Data:
The script calculates the MACD, Signal, and Histogram for the selected timeframes (tf1 to tf5) using request.security, which retrieves data for those timeframes:
macd_tf1, signal_tf1, hist_tf1 for Timeframe 1 (and similar variables for the other timeframes).
5. Rounding Values:
A helper function roundDecimal is used to round MACD, Signal, and Histogram values to two decimal places for readability.
6. Color Assignment Based on Value:
The colors of the values in the table cells are dynamically set based on whether the value is positive or negative:
MACD, Signal, and Histogram: The script uses conditional color assignments (green for positive values, red for negative values).
For example, if the MACD value is greater than or equal to 0, it is colored green, otherwise red. The same logic applies to the Signal and Histogram values.
7. Populating the Table:
For each timeframe (tf1 to tf5), the script populates the table with the following data:
Timeframe (e.g., "5 min")
Rounded MACD value
Rounded Signal value
Rounded Histogram value
The respective color is applied to each value based on whether it is positive or negative.
8. Table Update:
The table is updated dynamically with new data on each new bar. Each timeframe’s values are populated into the table starting from row 1 through row 5.

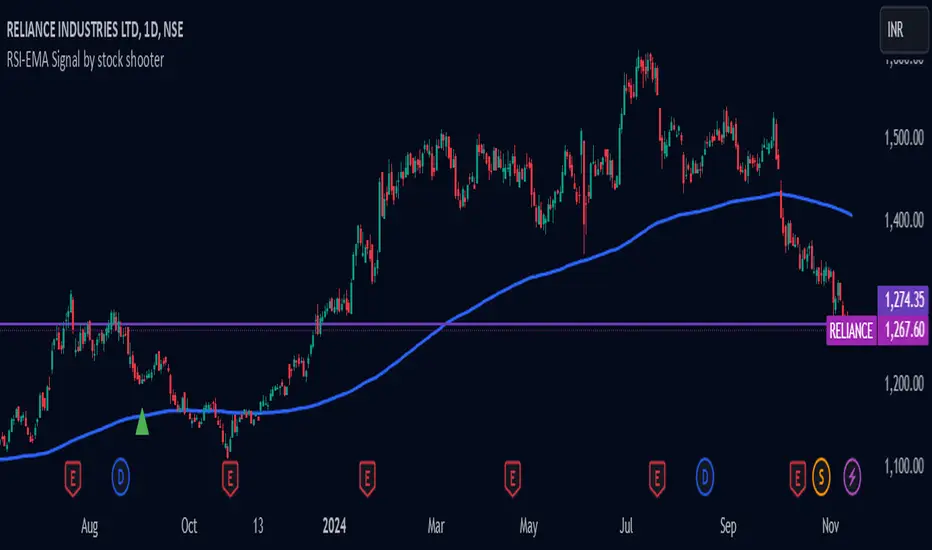
RSI-EMA Signal by stock shooter## Strategy Description: 200 EMA Crossover with RSI, Green/Red Candles, Volume, and Exit Conditions
This strategy combines several technical indicators to identify potential long and short entry opportunities in a trading instrument. Here's a breakdown of its components:
1. 200-period Exponential Moving Average (EMA):
* The 200-period EMA acts as a long-term trend indicator.
* The strategy looks for entries when the price is above (long) or below (short) the 200 EMA.
2. Relative Strength Index (RSI):
* The RSI measures the momentum of price movements and helps identify overbought and oversold conditions.
* The strategy looks for entries when the RSI is below 40 (oversold) for long positions and above 60 (overbought) for short positions.
3. Green/Red Candles:
* This indicator filters out potential entries based on the current candle's closing price relative to its opening price.
* The strategy only considers long entries on green candles (closing price higher than opening) and short entries on red candles (closing price lower than opening).
4. Volume:
* This indicator adds a volume filter to the entry conditions.
* The strategy only considers entries when the current candle's volume is higher than the average volume of the previous 20 candles, aiming for stronger signals.
Overall:
This strategy aims to capture long opportunities during potential uptrends and short opportunities during downtrends, based on a combination of price action, momentum, and volume confirmation.
Important Notes:
Backtesting is crucial to evaluate the historical performance of this strategy before deploying it with real capital.
Consider incorporating additional risk management techniques like stop-loss orders.
This strategy is just a starting point and can be further customized based on your trading goals and risk tolerance.
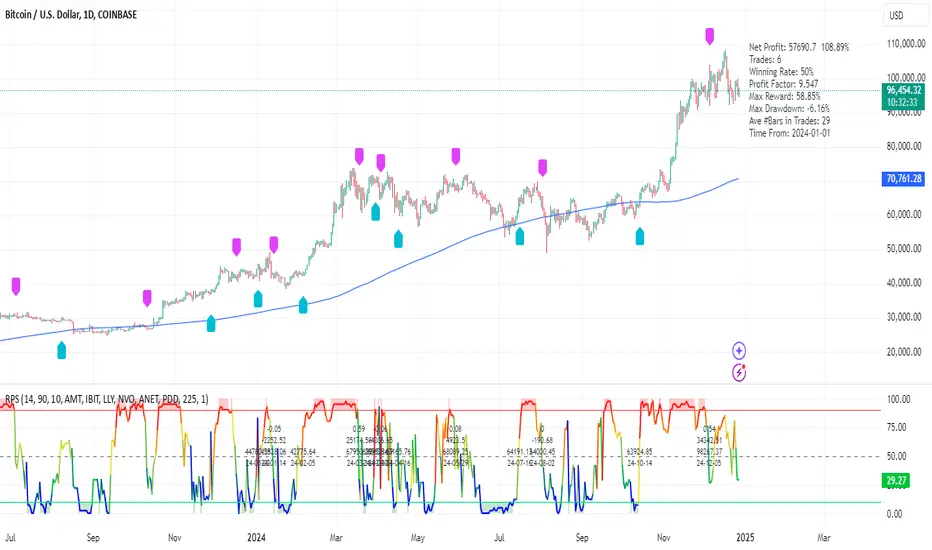
RPS Trading Signals & Backtesting
Overview:
The Enhanced Relative Price Strength (RPS) Indicator is designed for trend traders looking to identify the relative strength of stocks within a select universe. By comparing the price movements of chosen stocks over a specified period, this indicator helps traders make informed decisions about potential buying and selling opportunities.
Key Features:
Relative Strength Ranking: Our RPS indicator ranks the price performance of individual stocks against a curated selection, enabling users to pinpoint which stocks are exhibiting relative strength or weakness.
Customizable Stock Universe: The script evaluates 40 stocks, which include 30 high-weight NDX100 stocks, 4 major index ETFs (SPY, QQQ, DIA, IWM), and allows for the addition of 6 user-defined custom stocks.
Dynamic Color Gradients: The visual representation of the RPS score utilizes a gradient color scheme ranging from purple at low scores to red at high scores, leveraging the color for clear, immediate insight into stock performance.
Threshold Visualization: Users can set specific high (default 85) and low (default 15) thresholds for RPS, highlighted with solid line indicators and area fills. This visual aspect aids traders in quickly spotting entry and exit points.
Trading Signal Generation: The script includes logic for generating buy and sell signals according to defined RPS behaviors relative to the set thresholds, factoring in market conditions based on a long-term moving average.
Backtesting Capabilities: Users can backtest trading signals by inputting desired start and end dates, allowing traders to evaluate the effectiveness of the RPS strategy on historical data for various assets including stocks and cryptocurrencies (e.g., NVDA, LLY, GOOG, BTC, ETH, SOL).
User-Friendly Options: The script allows for adjustments such as moving average lengths, visibility of trading signals, and fills for ease of use and customization according to trading preferences.
How It Works:
The RPS Indicator functions by calculating the performance of stocks relative to each other. Based on the RPS trends, the indicator identifies when to enter or exit trades, providing a framework to capitalize on market movements.
Conclusion:
The Enhanced RPS Indicator aims to empower traders with a powerful analytical tool in their arsenal, tailored to simplify decision-making and bolster trading strategies. As this script evolves, we encourage feedback and collaboration from users to refine and enhance its capabilities further.
Trade Less, Earn More!
*2.2 Aggregate Signal Indicator (trial)How to Use the Indicator:
Trend Detection:
The aggregate trend score will plot above 0 for bullish conditions and below 0 for bearish conditions.
When the trend score is green, it indicates a positive (bullish) trend, while red indicates a negative (bearish) trend.
Visual Representation:
The blue line represents the aggregate trend score, while the grey line at 0 shows the neutral point.
The area between the trend score and the 0-line is filled with green (bullish) or red (bearish) based on the score's direction.
Confirming Trends:
Look for consistency in the trend score remaining above or below 0 to confirm a lasting trend.
Use this indicator alongside other trading strategies to filter out false signals and gain confirmation of market direction.
Customizable Inputs:
The indicator allows you to customize the settings for each individual indicator (e.g., lengths for EMA, ADX, RSI, MACD, etc.) to fine-tune the system to your preference or specific market conditions.

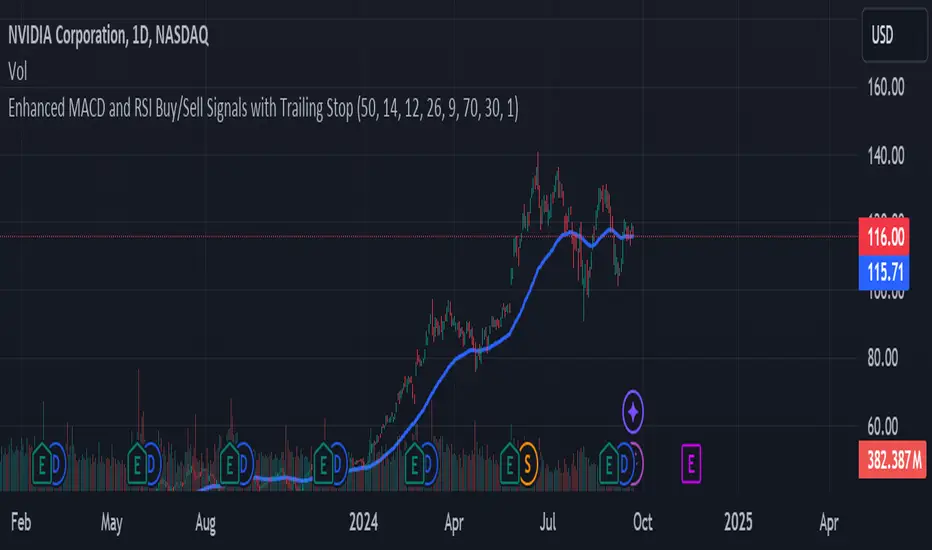
Enhanced MACD and RSI Buy/Sell Signals - Created by Marco NucupKey Features:
EMA Filter: Adds an Exponential Moving Average (EMA) to filter signals based on the trend. Buys are only considered when the price is above the EMA, and sells when below it.
Customizable Inputs: Users can adjust parameters for EMA, MACD, and RSI directly from the TradingView interface, allowing for more personalized strategies.
Alerts: The script includes alert conditions for both buy and sell signals, enabling users to receive notifications.
Signal Plotting: Visual indicators for buy and sell signals on the chart, along with the EMA line for trend reference.
Advanced Volume-Driven Breakout SignalsThe "Advanced Volume-Driven Breakout Signals" indicator is a cutting-edge tool designed to help traders identify high-potential trading opportunities through sophisticated volume analysis techniques. This indicator integrates volume flow analysis, moving averages, and Relative Volume (RVOL) to provide a comprehensive view of market conditions, going beyond traditional Volume Spread Analysis (VSA) methods.
Key Features:
Volume Flow Analysis: Distinguishes bullish and bearish volume flows with distinct colors, making it easier to visualize market sentiment and potential breakout points.
Volume Flow Moving Averages: Calculates moving averages for volume using various methods (SMA, EMA, WMA, HMA, VWMA), accommodating different trading strategies. This includes settings for adjusting the type of moving average and its period, as well as thresholds for high, medium, and low volume levels.
Volume Spikes Detection: Identifies significant volume spikes based on user-defined multipliers and moving averages, highlighting unusual trading activity.
Volume MA Cloud Settings: Computes general moving averages of volume to track trends and detect deviations. This feature includes options to select different moving average types and adjust thresholds for detecting high volume activity.
Relative Volume (RVOL): Measures current volume relative to historical averages, triggering signals when RVOL exceeds predefined thresholds, indicating notable changes in trading activity.
Entry Conditions: Provides clear long and short entry signals based on combined volume flow conditions and RVOL, offering actionable trading opportunities.
Volume Visualization:
— Bullish Volume Flow: Light and dark green bars indicate bullish volume flow.
— Bearish Volume Flow: Light and dark red bars denote bearish volume flow.
— High Volume Bars: Highlighted in yellow, and extreme volume bars in orange for additional context. These bars are plotted for visual aid and do not directly influence trade signals, focusing instead on the quality and strength of the volume flow.
Alerts: Allows users to create alert notifications for long and short entry signals when the criteria are met, enabling traders to respond promptly to trading opportunities.
Usage:
Overlay: Apply the indicator directly to your price chart to visualise real-time signals and volume conditions.
Customisable: Adjust settings for moving averages, RVOL, and other parameters to match your trading strategy and preferences.
Comparison to VSA Scripts: The "Advanced Volume-Driven Breakout Signals" indicator extends beyond traditional VSA scripts by incorporating a wider range of analytical features. While VSA primarily focuses on volume spread patterns and price action, this indicator offers enhanced functionality with advanced RVOL metrics, customizable moving averages, and detailed volume spike detection, making it a more versatile tool for identifying breakout opportunities and managing trades. It is particularly effective when used alongside key levels and order blocks.
Acknowledgements: Special thanks to @oh92 and @goofoffgoose for their invaluable scripts, which served as inspiration in the development of this advanced trading indicator.
Notes: The script is continually evolving, with ongoing refinements aimed at enhancing accuracy and performance.
