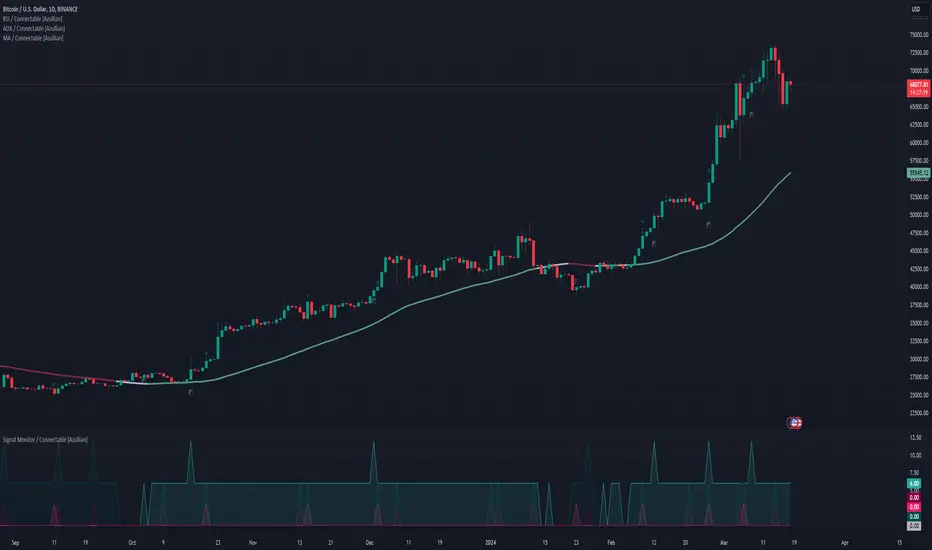
Signal Monitor / Connectable [Azullian]The connectable signal monitor is a connectable tool to help test, visualize signal weights. Like all connectable indicators , it interacts through the TradingView input source, which serves as a signal connector to link indicators to each other. All connectable indicators send signal weight to the next node in the system until it reaches either a connectable signal monitor, signal filter and/or strategy.
Let's review the separate parts of this indicator.
█ INPUTS
We've provided 3 inputs for connecting indicators or chains (1→, 2→, 3→) which are all set to 'Close' by default.
An input has several controls:
• Enable disable: Toggle the entire input on or off
• Input: Connect indicators here, choose indicators with a compatible : Signal connector.
■ VISUALS
• ☼: Brightness % : Set the opacity for the signal curves
• 🡓: ES Color : Set the color for the ES: Entry Short signal
• ⭳: XS Color : Set the color for the XS: Exit Short signal
• ⌥: Plot mode : Set the plotting mode
○ Signals IN: Show all signals
○ Signals OUT: Show only scoring signals
• 🡑: EL Color : Set the color for the EL: Enter Long signal
• ⭱: XL Color : Set the color for the XL: Exit Long signal
█ USAGE OF CONNECTABLE INDICATORS
■ Connectable chaining mechanism
Connectable indicators can be connected directly to the signal monitor, signal filter or strategy , or they can be daisy chained to each other while the last indicator in the chain connects to the connectable signal monitor, signal filter or strategy . When using a signal filter or signal monitor you can chain the filter to the strategy input to make your chain complete.
• Direct chaining: Connect an indicator directly to the signal monitor, signal filter or strategy through the provided inputs (→).
• Daisy chaining: Connect indicators using the indicator input (→). The first in a daisy chain should have a flow (⌥) set to 'Indicator only'. Subsequent indicators use 'Both' to pass the previous weight. The final indicator connects to the signal monitor, signal filter, or strategy.
■ Set up the signal monitor with a connectable indicator and strategy
Let's connect the MACD to a connectable signal monitor :
1. Load all relevant indicators
• Load MACD / Connectable
• Load Signal monitor / Connectable
2. Signal Monitor: Connect the MACD to the Signal Monitor
• Open the signal monitor settings
• Choose one of the three input dropdowns (1→, 2→, 3→) and choose : MACD / Connectable: Signal Connector
• Toggle the enable box before the connected input to enable the incoming signal
Now that everything is connected, you'll notice green spikes in the signal monitor representing long signals, and red spikes indicating short signals.
█ BENEFITS
• Adaptable Modular Design: Arrange indicators in diverse structures via direct or daisy chaining, allowing tailored configurations to align with your analysis approach.
• Streamlined Backtesting: Simplify the iterative process of testing and adjusting combinations, facilitating a smoother exploration of potential setups.
• Intuitive Interface: Navigate TradingView with added ease. Integrate desired indicators, adjust settings, and establish alerts without delving into complex code.
• Signal Weight Precision: Leverage granular weight allocation among signals, offering a deeper layer of customization in strategy formulation.
• Advanced Signal Filtering: Define entry and exit conditions with more clarity, granting an added layer of strategy precision.
• Clear Visual Feedback: Distinct visual signals and cues enhance the readability of charts, promoting informed decision-making.
• Standardized Defaults: Indicators are equipped with universally recognized preset settings, ensuring consistency in initial setups across different types like momentum or volatility.
• Reliability: Our indicators are meticulously developed to prevent repainting. We strictly adhere to TradingView's coding conventions, ensuring our code is both performant and clean.
█ COMPATIBLE INDICATORS
Each indicator that incorporates our open-source 'azLibConnector' library and adheres to our conventions can be effortlessly integrated and used as detailed above.
For clarity and recognition within the TradingView platform, we append the suffix ' / Connectable' to every compatible indicator.
█ COMMON MISTAKES, CLARIFICATIONS AND TIPS
• Removing an indicator from a chain: Deleting a linked indicator and confirming the "remove study tree" alert will also remove all underlying indicators in the object tree. Before removing one, disconnect the adjacent indicators and move it to the object stack's bottom.
• Point systems: The azLibConnector provides 500 points for each direction (EL: Enter long, XL: Exit long, ES: Enter short, XS: Exit short) Remember this cap when devising a point structure.
• Flow misconfiguration: In daisy chains the first indicator should always have a flow (⌥) setting of 'indicator only' while other indicator should have a flow (⌥) setting of 'both'.
• Hide attributes: As connectable indicators send through quite some information you'll notice all the arguments are taking up some screenwidth and cause some visual clutter. You can disable arguments in Chart Settings / Status line.
• Layout and abbreviations: To maintain a consistent structure, we use abbreviations for each input. While this may initially seem complex, you'll quickly become familiar with them. Each abbreviation is also explained in the inline tooltips.
• Inputs: Connecting a connectable indicator directly to the strategy delivers the raw signal without a weight threshold, meaning every signal will trigger a trade.
█ A NOTE OF GRATITUDE
Through years of exploring TradingView and Pine Script, we've drawn immense inspiration from the community's knowledge and innovation. Thank you for being a constant source of motivation and insight.
█ RISK DISCLAIMER
Azullian's content, tools, scripts, articles, and educational offerings are presented purely for educational and informational uses. Please be aware that past performance should not be considered a predictor of future results.
Cari dalam skrip untuk "signal"
Signal generatorThis simple script generates signals for testing the connection from TradingView to a REST API client via the webhook and demonstrates very basic concepts of gerenating alerts within the script.
This script also demonstrates how to visualize when a buy or a sell should take place and how to use diagnostics text for bug fixes/informational purposes.
This is for testing and learning only. Do not use with real money as losses WILL occur. This script is for educational purposes only and should only be used with demo accounts, never with real money .
Buy signals are generated when closing price is less then opening price.
Sell Signals are generated when closing price is greater then opening price.
Can also be used to test signal counting and very rudimentary dollar cost averaging.

Signal to Noise Ratio [SNR]Intro
This script measures the Signal to Noise ratio of a security and plots it in deciBels scale!
Usage
Ideally, you would want the ratio to be above 10 dB, meaning the Signal strength is 10x the noise strength.
As a baseline, you should not rely on indicators that use any kind of moving average if the SNR is below 6 dB - meaning Signal strength is only 4x noise strength.
I've written the SNR as a functional block so you may simply copy and paste, then call getSNR() to get the ratio in dB.
Principle
I consider a bar's High and Low to be the range of that period and (High + Low)/2 to be the "real" value of the signal.
This script compares a bars range (noise) to the perceived signal using a Hilbert Transform.
Cheers,
DasanC

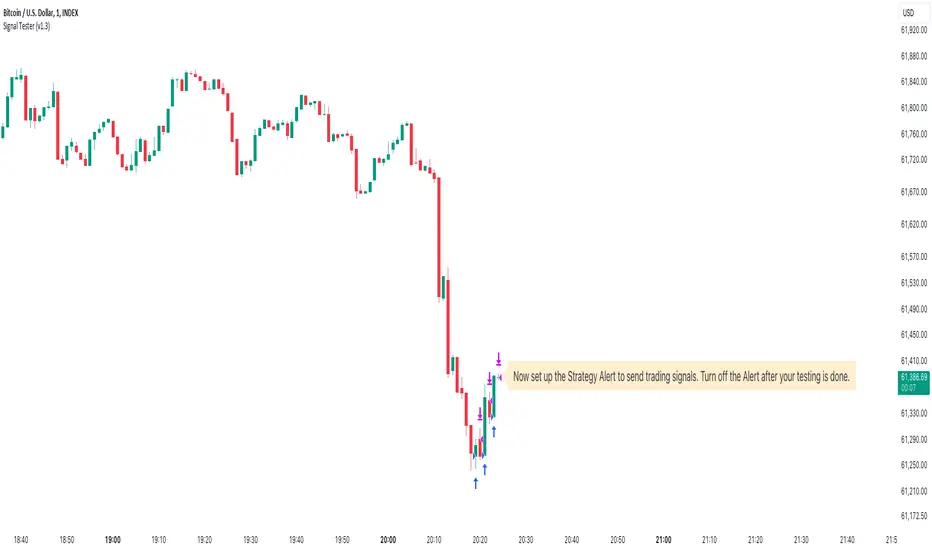
Signal Tester (v1.2)This is an automation test Strategy, which helps you to get Strategy Alerts quickly on the 1m chart.
This is useful when you want to start automating Strategies but first you want to see if the connection between TradingView and your automation tool works properly.
This Strategy sends LONG Buy/Sell signals every 1 minute so you don't have to wait for a long time to see if your integration with an automation tool works.
How it works:
It works on the 1m chart
Every 1 minute it will send a BUY or a SELL signal (alternating between them forever)
Klinger Oscillator with signal 18 period EMA by MKMUNIR3Signal line in this modified oscillator is based on higher period EMA so that it does not give signals of buying and selling very frequently. It is able to cut off the very short period movements so that the trader has the confidence of a trend for considerable time to remain in a trade.


Band of Filtered RS by Mustafa ÖZVERBand of Filtered RS by Mustafa ÖZVER
This code shows a range (max-min values) price may get if we get strong movements. These values is based on RSI (Relative Strange Index). And also these are calculated using RSI, if we get trades to make rsi is equal to 25 (or rsi down limit) or 75 (rsi up limit) or any value you set, how much will price value get? This code calculate these and shows these to you on graph.
This price are between these band limits because we expect cross reaction to hard movements on price.
For scalping, we can use these values as
long signal when price under down limit,
short signal when price over up limit,
But only these values can not guarantee good results for trading. BE CAREFUL

Signal To Noise This source code is subject to the terms of the Mozilla Public License 2.0 at mozilla.org
© HPotter 05/01/2021
The signal-to-noise (S/N) ratio.
Thank you for idea BlockchainYahoo

Signal/Noise Adaptive Moving Average [Jwammo12]This is an adaptive moving average based on a signal noise ratio. It's inspiration is frm Eugene Durenard's book Professional Automated Trading Theory and Practice. Shout out to CryptoStatistical for his implemenation of Durenard's concepts that became the basis for this script.
Check out my breakout strategy based on this concept here .


Signal To Noise RatioDetermines a S:N ratio and plots a level as a threshold for noise. From ProRealCode www.prorealcode.com
This technical indicator is an attempt to find the good momentum of trend : is it actually trending or in a range market?
Interestingly, it follows that pi is not only the ratio between the length of a circle to its diameter, it is also a constant rather appears in statistics and, oddly enough, in the relationship between the distance between a price oscillation and a straight line.
If the signal / noise ratio is less than or equal to 1/2 pi, we will be in a trading range or range.
If the signal / noise ratio is greater than 1/2 pi, we are in a trending market.

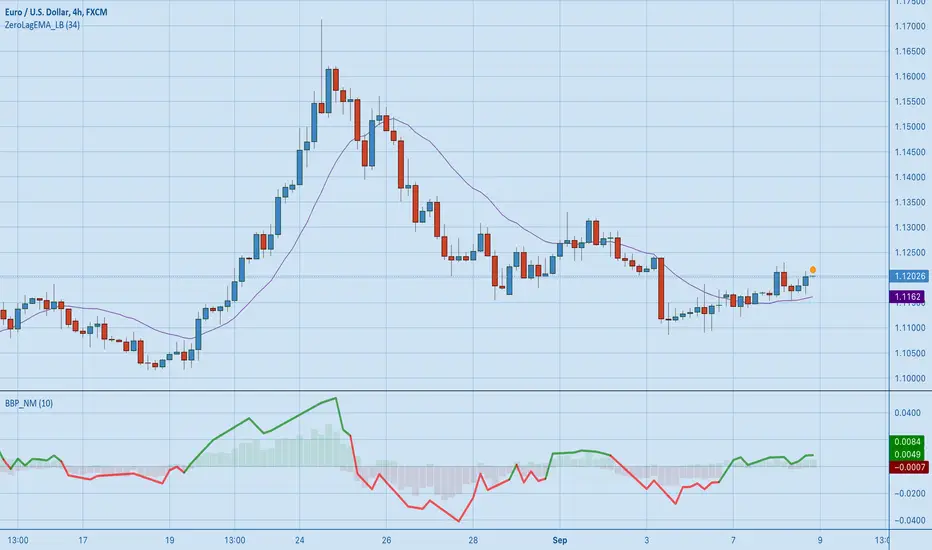
[RS][NM]Improved Linear Regression Bull and Bear Power v01The base code for this indicator was created by RicardoSantos
What I added is a signal line that indicates when to buy and when to sell.
Advised use :
Combine with a zero-lag indicator like ZeroLagEMA_LB by LazyBear (suggested period = 34)
Then use the following Rules of engagement :
Current price > ZLEMA & Signal line of BBP_NM is green : BUY
Current price < ZLEMA & Signal line of BBP_NM is red : SELL Please click the like button if you dig this indicator !
Uptrick: DPO Signal & Zone Indicator
## **Uptrick: DPO Signal & Zone Indicator**
### **Introduction:**
The **Uptrick: DPO Signal & Zone Indicator** is a sophisticated technical analysis tool tailored to provide insights into market momentum, identify potential trading signals, and recognize extreme market conditions. It leverages the Detrended Price Oscillator (DPO) to strip out long-term trends from price movements, allowing traders to focus on short-term fluctuations and cyclical behavior. The indicator integrates multiple components, including a Detrended Price Oscillator, a Signal Line, a Histogram, and customizable alert levels, to deliver a robust framework for market analysis and trading decision-making.
### **Detailed Breakdown:**
#### **1. Detrended Price Oscillator (DPO):**
- **Purpose and Functionality:**
- The DPO is designed to filter out long-term trends from the price data, isolating short-term price movements. This helps in understanding the cyclical patterns and momentum of an asset, allowing traders to detect periods of acceleration or deceleration that might be overlooked when focusing solely on long-term trends.
- **Calculation:**
- **Formula:** `dpo = close - ta.sma(close, smaLength)`
- **`close`:** The asset’s closing price for each period in the dataset.
- **`ta.sma(close, smaLength)`:** The Simple Moving Average (SMA) of the closing prices over a period defined by `smaLength`.
- The DPO is derived by subtracting the SMA value from the current closing price. This calculation reveals how much the current price deviates from the moving average, effectively detrending the price data.
- **Interpretation:**
- **Positive DPO Values:** Indicate that the current price is higher than the moving average, suggesting bullish market conditions and a potential upward trend.
- **Negative DPO Values:** Indicate that the current price is lower than the moving average, suggesting bearish market conditions and a potential downward trend.
- **Magnitude of DPO:** Reflects the strength of momentum. Larger positive or negative values suggest stronger momentum in the respective direction.
#### **2. Signal Line:**
- **Purpose and Functionality:**
- The Signal Line is a smoothed average of the DPO, intended to act as a reference point for generating trading signals. It helps to filter out short-term fluctuations and provides a clearer perspective on the prevailing trend.
- **Calculation:**
- **Formula:** `signalLine = ta.sma(dpo, signalLength)`
- **`ta.sma(dpo, signalLength)`:** The SMA of the DPO values over a period defined by `signalLength`.
- The Signal Line is calculated by applying a moving average to the DPO values. This smoothing process reduces noise and highlights the underlying trend direction.
- **Interpretation:**
- **DPO Crossing Above Signal Line:** Generates a buy signal, suggesting that short-term momentum is turning bullish relative to the longer-term trend.
- **DPO Crossing Below Signal Line:** Generates a sell signal, suggesting that short-term momentum is turning bearish relative to the longer-term trend.
- **Signal Line’s Role:** Provides a benchmark for assessing the strength of the DPO. The interaction between the DPO and the Signal Line offers actionable insights into potential entry or exit points.
#### **3. Histogram:**
- **Purpose and Functionality:**
- The Histogram visualizes the difference between the DPO and the Signal Line. It provides a graphical representation of momentum strength and direction, allowing traders to quickly gauge market conditions.
- **Calculation:**
- **Formula:** `histogram = dpo - signalLine`
- The Histogram is computed by subtracting the Signal Line value from the DPO value. Positive values indicate that the DPO is above the Signal Line, while negative values indicate that the DPO is below the Signal Line.
- **Interpretation:**
- **Color Coding:**
- **Green Bars:** Represent positive values, indicating bullish momentum.
- **Red Bars:** Represent negative values, indicating bearish momentum.
- **Width of Bars:** Indicates the strength of momentum. Wider bars signify stronger momentum, while narrower bars suggest weaker momentum.
- **Zero Line:** A horizontal gray line that separates positive and negative histogram values. Crosses of the histogram through this zero line can signal shifts in momentum direction.
#### **4. Alert Levels:**
- **Purpose and Functionality:**
- Alert levels define specific thresholds to identify extreme market conditions, such as overbought and oversold states. These levels help traders recognize potential reversal points and extreme market conditions.
- **Inputs:**
- **`alertLevel1`:** Defines the upper threshold for identifying overbought conditions.
- **Default Value:** 0.5
- **`alertLevel2`:** Defines the lower threshold for identifying oversold conditions.
- **Default Value:** -0.5
- **Interpretation:**
- **Overbought Condition:** When the DPO exceeds `alertLevel1`, indicating that the market may be overbought. This condition suggests that the asset could be due for a correction or reversal.
- **Oversold Condition:** When the DPO falls below `alertLevel2`, indicating that the market may be oversold. This condition suggests that the asset could be poised for a rebound or reversal.
#### **5. Visual Elements:**
- **DPO and Signal Line Plots:**
- **DPO Plot:**
- **Color:** Blue
- **Width:** 2 pixels
- **Purpose:** To visually represent the deviation of the current price from the moving average.
- **Signal Line Plot:**
- **Color:** Red
- **Width:** 1 pixel
- **Purpose:** To provide a smoothed reference for the DPO and generate trading signals.
- **Histogram Plot:**
- **Color Coding:**
- **Green:** For positive values, signaling bullish momentum.
- **Red:** For negative values, signaling bearish momentum.
- **Style:** Histogram bars are displayed with varying width to represent the strength of momentum.
- **Zero Line:** A gray horizontal line separating positive and negative histogram values.
- **Overbought/Oversold Zones:**
- **Background Colors:**
- **Green Shading:** Applied when the DPO exceeds `alertLevel1`, indicating an overbought condition.
- **Red Shading:** Applied when the DPO falls below `alertLevel2`, indicating an oversold condition.
- **Horizontal Lines:**
- **Dotted Green Line:** At `alertLevel1`, marking the upper alert threshold.
- **Dotted Red Line:** At `alertLevel2`, marking the lower alert threshold.
- **Purpose:** To provide clear visual cues for extreme market conditions, aiding in the identification of potential reversal points.
#### **6. Trading Signals and Alerts:**
- **Buy Signal:**
- **Trigger:** When the DPO crosses above the Signal Line.
- **Visual Representation:** A "BUY" label appears below the price bar in the specified buy color.
- **Purpose:** Indicates a potential buying opportunity as short-term momentum turns bullish.
- **Sell Signal:**
- **Trigger:** When the DPO crosses below the Signal Line.
- **Visual Representation:** A "SELL" label appears above the price bar in the specified sell color.
- **Purpose:** Indicates a potential selling opportunity as short-term momentum turns bearish.
- **Overbought/Oversold Alerts:**
- **Overbought Alert:** Triggered when the DPO crosses below `alertLevel1`.
- **Oversold Alert:** Triggered when the DPO crosses above `alertLevel2`.
- **Visual Representation:** Labels "OVERBOUGHT" and "OVERSOLD" appear with distinctive colors and sizes to highlight extreme conditions.
- **Purpose:** To signal potential reversal points and extreme market conditions that may lead to price corrections or trend reversals.
- **Alert Conditions:**
- **DPO Cross Above Signal Line:** Alerts traders when the DPO crosses above the Signal Line, generating a buy signal.
- **DPO Cross Below Signal Line:** Alerts traders when the DPO crosses below the Signal Line, generating a sell signal.
- **DPO Above Upper Alert Level:** Alerts when the DPO is above `alertLevel1`, indicating an overbought condition.
- **DPO Below Lower Alert Level:** Alerts when the DPO is below `alertLevel2`, indicating an oversold condition.
- **Purpose:** To provide real-time notifications of significant market events, enabling traders to make informed decisions promptly.
### **Practical Applications:**
#### **1. Trend Following Strategies:**
- **Objective:**
- To capture and ride the prevailing market trends by entering trades that align with the direction of the momentum.
- **How to Use:**
- Monitor buy and sell signals generated by the DPO crossing the Signal Line. A buy signal suggests a bullish trend and a potential long trade, while a sell signal suggests a bearish trend and a potential short trade.
- Use the Histogram to confirm the strength of the trend. Expanding green bars indicate strong bullish momentum, while expanding red bars indicate strong bearish momentum.
- **Advantages:**
- Helps traders stay aligned with the market trend, increasing the likelihood of capturing substantial price moves.
#### **2. Reversal Trading:**
- **Objective:**
- To identify potential market reversals
by detecting overbought and oversold conditions.
- **How to Use:**
- Look for overbought and oversold signals based on the DPO crossing `alertLevel1` and `alertLevel2`. These conditions suggest that the market may be due for a reversal.
- Confirm reversal signals with the Histogram. A decrease in histogram bars (from green to red or vice versa) may support the reversal hypothesis.
- **Advantages:**
- Provides early warnings of potential market reversals, allowing traders to position themselves before significant price changes occur.
#### **3. Momentum Analysis:**
- **Objective:**
- To gauge the strength and direction of market momentum for making informed trading decisions.
- **How to Use:**
- Analyze the Histogram to assess momentum strength. Positive and expanding histogram bars indicate increasing bullish momentum, while negative and expanding bars suggest increasing bearish momentum.
- Use momentum insights to validate or question existing trading positions and strategies.
- **Advantages:**
- Offers valuable information about the market's momentum, helping traders confirm the validity of trends and trading signals.
### **Customization and Flexibility:**
The **Uptrick: DPO Signal & Zone Indicator** offers extensive customization options to accommodate diverse trading preferences and market conditions:
- **SMA Length and Signal Line Length:**
- Adjust the `smaLength` and `signalLength` parameters to control the sensitivity and responsiveness of the DPO and Signal Line. Shorter lengths make the indicator more responsive to price changes, while longer lengths provide smoother, less volatile signals.
- **Alert Levels:**
- Modify `alertLevel1` and `alertLevel2` to fit varying market conditions and volatility. Setting these levels appropriately helps tailor the indicator to different asset classes and trading strategies.
- **Color and Shape Customization:**
- Customize the colors and sizes of buy/sell signals, histogram bars, and alert levels to enhance visual clarity and align with personal preferences. This customization helps ensure that the indicator integrates seamlessly with a trader's charting setup.
### **Conclusion:**
The **Uptrick: DPO Signal & Zone Indicator** is a multifaceted analytical tool that combines the power of the Detrended Price Oscillator with customizable visual elements and alert levels to deliver a comprehensive approach to market analysis. By offering insights into momentum strength, trend direction, and potential reversal points, this indicator equips traders with valuable information to make informed decisions and enhance their trading strategies. Its flexibility and customization options ensure that it can be adapted to various trading styles and market conditions, making it a versatile addition to any trader's toolkit.

Multiple (12) Strong Buy/Sell Signals + Momentum
Indicator Manual: "Multiple (12) Strong Buy/Sell Signals + Momentum"
This indicator is designed to identify strong buy and sell signals based on 12 configurable conditions, which include a variety of technical analysis methods such as trend-following indicators, pattern recognition, volume analysis, and momentum oscillators. It allows for customizable alerts and visual cues on the chart. The indicator helps traders spot potential entry and exit points by displaying buy and sell signals based on the selected conditions.
Key Observations:
• The script integrates multiple indicators and pattern recognition methods to provide comprehensive buy/sell signals.
• Trend-based indicators like EMAs and MACD are combined with pattern recognition (flags, triangles) and momentum-based signals (RSI, ADX, and volume analysis).
• User customization is a core feature, allowing adjustments to the conditions and thresholds for more tailored signals.
• The script is designed to be responsive to market conditions, with multiple conditions filtering out noise to generate reliable signals.
________________________________________
Key Features:
1. 12 Combined Buy/Sell Signal Conditions: This indicator incorporates a diverse set of conditions based on trend analysis, momentum, and price patterns.
2. Minimum Conditions Input: You can adjust the threshold of conditions that need to be met for the buy/sell signals to appear.
3. Alert Customization: Set alert thresholds for both buy and sell signals.
4. Dynamic Visualization: Buy and sell signals are shown as triangles on the chart, with momentum signals highlighted as circles.
________________________________________
Detailed Description of the 12 Conditions:
1. Exponential Moving Averages (EMA):
o Conditions: The indicator uses EMAs with periods 3, 8, and 13 for quick trend-following signals.
o Bullish Signal: EMA3 > EMA8 > EMA13 (Bullish stack).
o Bearish Signal: EMA3 < EMA8 < EMA13 (Bearish stack).
o Reversal Signal: The crossing over or under of these EMAs can signify trend reversals.
2. MACD (Moving Average Convergence Divergence):
o Fast MACD (2, 7, 3) is used to confirm trends quickly.
o Bullish Signal: When the MACD line crosses above the signal line.
o Bearish Signal: When the MACD line crosses below the signal line.
3. Donchian Channel:
o Tracks the highest high and lowest low over a given period (default 20).
o Breakout Signal: Price breaking above the upper band is bullish; breaking below the lower band is bearish.
4. VWAP (Volume-Weighted Average Price):
o Above VWAP: Bullish condition (price above VWAP).
o Below VWAP: Bearish condition (price below VWAP).
5. EMA Stacking & Reversal:
o Tracks the order of EMAs (3, 8, 13) to confirm strong trends and reversals.
o Bullish Reversal: EMA3 < EMA8 < EMA13 followed by a crossing to bullish.
o Bearish Reversal: EMA3 > EMA8 > EMA13 followed by a crossing to bearish.
6. Bull/Bear Flags:
o Bull Flag: Characterized by a strong price movement (flagpole) followed by a pullback and breakout.
o Bear Flag: Similar to Bull Flag but in the opposite direction.
7. Triangle Patterns (Ascending and Descending):
o Detects ascending and descending triangles using pivot highs and lows.
o Ascending Triangle: Higher lows and flat resistance.
o Descending Triangle: Lower highs and flat support.
8. Volume Sensitivity:
o Identifies price moves with significant volume increases.
o High Volume: When current volume is significantly above the moving average volume (set to 1.2x of the average).
9. Momentum Indicators:
o RSI (Relative Strength Index): Confirms overbought and oversold levels with thresholds set at 65 (overbought) and 35 (oversold).
o ADX (Average Directional Index): Confirms strong trends when ADX > 28.
o Momentum Up: Momentum is upward with strong volume and bullish RSI/ADX conditions.
o Momentum Down: Momentum is downward with strong volume and bearish RSI/ADX conditions.
10. Bollinger & Keltner Squeeze:
o Squeeze Condition: A contraction in both Bollinger Bands and Keltner Channels indicates low volatility, signaling a potential breakout.
o Squeeze Breakout: Price breaking above or below the squeeze bands.
11. 3 Consecutive Candles Condition:
o Bullish: Price rises for three consecutive candles with higher highs and lows.
o Bearish: Price falls for three consecutive candles with lower highs and lows.
12. Williams %R and Stochastic RSI:
o Williams %R: A momentum oscillator with signals when the line crosses certain levels.
o Stochastic RSI: Provides overbought/oversold levels with smoother signals.
o Combined Signals: You can choose whether to require both WPR and StochRSI to signal a buy/sell.
________________________________________
User Inputs (Inputs Tab):
1. Minimum Conditions for Buy/Sell:
o min_conditions: Number of conditions required to trigger a buy/sell signal on the chart (1 to 12).
o Alert_min_conditions: User-defined alert threshold (how many conditions must be met before an alert is triggered).
2. Donchian Channel Settings:
o Show Donchian: Toggle visibility of the Donchian channel.
o Donchian Length: The length of the Donchian Channel (default 20).
3. Bull/Bear Flag Settings:
o Bull Flag Flagpole Strength: ATR multiplier to define the strength of the flagpole.
o Bull Flag Pullback Length: Length of pullback for the bull flag pattern.
o Bull Flag EMA Length: EMA length used to confirm trend during bull flag pattern.
Similar settings exist for Bear Flag patterns.
4. Momentum Indicators:
o RSI Length: Period for calculating the RSI (default 9).
o RSI Overbought: Overbought threshold for the RSI (default 65).
o RSI Oversold: Oversold threshold for the RSI (default 35).
5. Bollinger/Keltner Squeeze Settings:
o Squeeze Width Threshold: The maximum width of the Bollinger and Keltner Bands for squeeze conditions.
6. Stochastic RSI Settings:
o Stochastic RSI Length: The period for calculating the Stochastic RSI.
7. WPR Settings:
o WPR Length: Period for calculating Williams %R (default 14).
________________________________________
User Inputs (Style Tab):
1. Signal Plotting:
o Control the display and colors of the buy/sell signals, momentum indicators, and pattern signals on the chart.
o Buy/Sell Signals: Can be customized with different colors and shapes (triangle up for buys, triangle down for sells).
o Momentum Signals: Custom circle placement for momentum-up or momentum-down signals.
2. Donchian Channel:
o Show Donchian: Toggle visibility of the Donchian upper, lower, and middle bands.
o Band Colors: Choose the color for each band (upper, lower, middle).
________________________________________
How to Use the Indicator:
1. Adjust Minimum Conditions: Set the minimum number of conditions that must be met for a signal to appear. For example, set it to 5 if you want only stronger signals.
2. Set Alert Threshold: Define the number of conditions needed to trigger an alert. This can be different from the minimum conditions for visual signals.
3. Customize Appearance: Modify the colors and styles of the signals to match your preferences.
________________________________________
Conclusion:
This comprehensive trading indicator uses a combination of trend-following, pattern recognition, and momentum-based conditions to help you spot potential buy and sell opportunities. By adjusting the input settings, you can fine-tune it to match your specific trading strategy, making it a versatile tool for different market conditions.
Signal Reliability Based on Condition Count
The reliability of the buy/sell signals increases as more conditions are met. Here's a breakdown of the probabilities:
1. 1-3 Conditions Met: Lower Probability
o Signals that meet only 1-3 conditions tend to have lower reliability and are considered less probable. These signals may represent false positives or weaker market movements, and traders should approach them with caution.
2. 4 Conditions Met: More Reliable Signal
o When 4 conditions are met, the signal becomes more reliable. This indicates that multiple indicators or market patterns are aligning, increasing the likelihood of a valid buy/sell opportunity. While not foolproof, it's a stronger indication that the market may be moving in a particular direction.
3. 5-6 Conditions Met: Strong Signal
o A signal meeting 5-6 conditions is considered a strong signal. This indicates a well-confirmed move, with several technical indicators and market factors aligning to suggest a higher probability of success. These are the signals that traders often prioritize.
4. 7+ Conditions Met: Rare and High-Confidence Signal
o Signals that meet 7 or more conditions are rare and should be considered high-confidence signals. These represent a significant alignment of multiple factors, and while they are less frequent, they are highly reliable when they do occur. Traders can be more confident in acting on these signals, but they should still monitor market conditions for confirmation.
________________________________________
You can adjust the number of conditions as needed, but this breakdown should give a clear structure on how the signal strength correlates with the number of conditions met!

Stoch RSI and RSI Buy/Sell Signals with MACD Trend FilterDescription of the Indicator
This Pine Script is designed to provide traders with buy and sell signals based on the combination of Stochastic RSI, RSI, and MACD indicators, enhanced by the confirmation of candle colors. The primary goal is to facilitate informed trading decisions in various market conditions by utilizing different indicators and their interactions. The script allows customization of various parameters, providing flexibility for traders to adapt it to their specific trading styles.
Usefulness
This indicator is not just a mashup of existing indicators; it integrates the functionality of multiple momentum and trend-detection methods into a cohesive trading tool. The combination of Stochastic RSI, RSI, and MACD offers a well-rounded approach to analyzing market conditions, allowing traders to identify entry and exit points effectively. The inclusion of color-coded signals (strong vs. weak) further enhances its utility by providing visual cues about the strength of the signals.
How to Use This Indicator
Input Settings: Adjust the parameters for the Stochastic RSI, RSI, and MACD to fit your trading style. Set the overbought/oversold levels according to your risk tolerance.
Signal Colors:
Strong Buy Signal: Indicated by a green label and confirmed by a green candle (close > open).
Weak Buy Signal: Indicated by a blue label and confirmed by a green candle (close > open).
Strong Sell Signal: Indicated by a red label and confirmed by a red candle (close < open).
Weak Sell Signal: Indicated by an orange label and confirmed by a red candle (close < open).
Example Trading Strategy Using This Indicator
To effectively use this indicator as part of your trading strategy, follow these detailed steps:
Setup:
Timeframe : Select a timeframe that aligns with your trading style (e.g., 15-minute for intraday, 1-hour for swing trading, or daily for longer-term positions).
Indicator Settings : Customize the Stochastic RSI, RSI, and MACD parameters to suit your trading approach. Adjust overbought/oversold levels to match your risk tolerance.
Strategy:
1. Strong Buy Entry Criteria :
Wait for a strong buy signal (green label) when the RSI is at or below the oversold level (e.g., ≤ 35), indicating a deeply oversold market. Confirm that the MACD shows a decreasing trend (bearish momentum weakening) to validate a potential reversal. Ensure the current candle is green (close > open) if candle color confirmation is enabled.
Example Use : On a 1-hour chart, if the RSI drops below 35, MACD shows three consecutive bars of decreasing negative momentum, and a green candle forms, enter a buy position. This setup signals a robust entry with strong momentum backing it.
2. Weak Buy Entry Criteria :
Monitor for weak buy signals (blue label) when RSI is above the oversold level but still below the neutral (e.g., between 36 and 50). This indicates a market recovering from an oversold state but not fully reversing yet. These signals can be used for early entries with additional confirmations, such as support levels or higher timeframe trends.
Example Use : On the same 1-hour chart, if RSI is at 45, the MACD shows momentum stabilizing (not necessarily negative), and a green candle appears, consider a partial or cautious entry. Use this as an early warning for a potential bullish move, especially when higher timeframe indicators align.
3. Strong Sell Entry Criteria :
Look for a strong sell signal (red label) when RSI is at or above the overbought level (e.g., ≥ 65), signaling a strong overbought condition. The MACD should show three consecutive bars of increasing positive momentum to indicate that the bullish trend is weakening. Ensure the current candle is red (close < open) if candle color confirmation is enabled.
Example Use : If RSI reaches 70, MACD shows increasing momentum that starts to level off, and a red candle forms on a 1-hour chart, initiate a short position with a stop loss set above recent resistance. This is a high-confidence signal for potential price reversal or pullback.
4. Weak Sell Entry Criteria :
Use weak sell signals (orange label) when RSI is between the neutral and overbought levels (e.g., between 50 and 64). These can indicate potential short opportunities that might not yet be fully mature but are worth monitoring. Look for other confirmations like resistance levels or trendline touches to strengthen the signal.
Example Use : If RSI reads 60 on a 1-hour chart, and the MACD shows slight positive momentum with signs of slowing down, place a cautious sell position or scale out of existing long positions. This setup allows you to prepare for a possible downtrend.
Trade Management:
Stop Loss : For buy trades, place stop losses below recent swing lows. For sell trades, set stops above recent swing highs to manage risk effectively.
Take Profit : Target nearby resistance or support levels, apply risk-to-reward ratios (e.g., 1:2), or use trailing stops to lock in profits as price moves in your favor.
Confirmation : Align these signals with broader trends on higher timeframes. For example, if you receive a weak buy signal on a 15-minute chart, check the 1-hour or daily chart to ensure the overall trend is not bearish.
Real-World Example: Imagine trading on a 15-minute chart :
For a buy:
A strong buy signal (green) appears when the RSI dips to 32, MACD shows declining bearish momentum, and a green candle forms. Enter a buy position with a stop loss below the most recent support level.
Alternatively, a weak buy signal (blue) appears when RSI is at 47. Use this as a signal to start monitoring the market closely or enter a smaller position if other indicators (like support and volume analysis) align.
For a sell:
A strong sell signal (red) with RSI at 72 and a red candle signals to short with conviction. Place your stop loss just above the last peak.
A weak sell signal (orange) with RSI at 62 might prompt caution but can still be acted on if confirmed by declining volume or touching a resistance level.
These strategies show how to blend both strong and weak signals into your trading for more nuanced decision-making.
Technical Analysis of the Code
1. Stochastic RSI Calculation:
The script calculates the Stochastic RSI (stochRsiK) using the RSI as input and smooths it with a moving average (stochRsiD).
Code Explanation : ta.stoch(rsi, rsi, rsi, stochLength) computes the Stochastic RSI, and ta.sma(stochRsiK, stochSmoothing) applies smoothing.
2. RSI Calculation :
The RSI is computed over a user-defined period and checks for overbought or oversold conditions.
Code Explanation : rsi = ta.rsi(close, rsiLength) calculates RSI values.
3. MACD Trend Filter :
MACD is calculated with fast, slow, and signal lengths, identifying trends via three consecutive bars moving in the same direction.
Code Explanation : = ta.macd(close, macdLengthFast, macdLengthSlow, macdSignalLength) sets MACD values. Conditions like macdLine < macdLine confirm trends.
4. Buy and Sell Conditions :
The script checks Stochastic RSI, RSI, and MACD values to set buy/sell flags. Candle color filters further confirm valid entries.
Code Explanation : buyConditionMet and sellConditionMet logically check all conditions and toggles (enableStochCondition, enableRSICondition, etc.).
5. Signal Flags and Confirmation :
Flags track when conditions are met and ensure signals only appear on appropriate candle colors.
Code Explanation : Conditional blocks (if statements) update buyFlag and sellFlag.
6. Labels and Alerts :
The indicator plots "BUY" or "SELL" labels with the RSI value when signals trigger and sets alerts through alertcondition().
Code Explanation : label.new() displays the signal, color-coded for strength based on RSI.
NOTE : All strategies can be enabled or disabled in the settings, allowing traders to customize the indicator to their preferences and trading styles.

[r380]Bear & Bull Pivot Signal Indicator_(Lite))Bear & Bull Pivot Signal Indicator
Overview:
The Bear & Bull Multi Pivot Signal Indicator is a comprehensive trading tool designed to identify potential market reversal points and trend changes. This indicator combines multiple technical analysis strategies such as RSI, MACD, and pivot points to generate reliable signals. By overlapping these signals, the indicator increases the possibility of accurate trend predictions, providing traders with valuable insights for informed decision-making.
"This indicator is primarily optimized for Bitcoin on a 15-minute timeframe and is recommended for short-term trading. Reliability on other timeframes is not guaranteed."
Key Features:
Bear and Bull Signals: Clearly indicate potential market reversal points using bear and bull emojis.
Support and Resistance Signals: Indicated with sun and snowflake emojis to show critical price levels.
Overheat Cooldown Pivot: Detects market exhaustion points to signal potential reversals.
Settings:
RSI Settings: Adjust the RSI period and thresholds to match your trading strategy. Default values are optimized for short-term trading.
MACD Settings: The MACD settings are pre-configured but can be customized if needed.
Visual Settings: If excessive signals cause visual discomfort, you can selectively enable or disable features in the visual settings.
Signal Descriptions:
🐻 Bear Signal: Indicates a potential high point where the market may reverse downwards. Combines RSI and MACD conditions to provide a reliable overbought signal. When accompanied by high volume, it can indicate a strong resistance level.
🐮 Bull Signal: Indicates a potential low point where the market may reverse upwards. Uses both RSI and MACD conditions to highlight oversold situations. When accompanied by high volume, it can indicate a strong support level.
❄️ Resistance Signal: Shows a resistance level where the price has difficulty moving higher. When the price crosses below this level, it signals a potential downward movement. Combined with high volume, it can signify robust resistance.
☀️ Support Signal: Shows a support level where the price has difficulty moving lower. When the price crosses above this level, it signals a potential upward movement. Combined with high volume, it can signify strong support.
Detailed Explanation:
This indicator is not simply a combination of multiple indicators but is designed to increase the probability of detecting potential trend reversal signals by using multiple signals. If signals only appear when multiple conditions are met, how many trades can we make in a year? Because there is no 100% certainty in any situation, we need to use various signals to construct our strategy and proceed with trading. For example, if only one signal appears, the reliability of the trend reversal signal is somewhat weak, so we can strategize by betting only a portion of the capital. If multiple signals appear simultaneously, we can consider it a highly reliable trend reversal signal and increase the betting amount and stop loss accordingly. The essence of this indicator, in my view, is not to blindly trade based on signals but to use it as an auxiliary tool for strategic decision-making.
RSI (Relative Strength Index), MACD, and Stochastic RSI: By using various indicators to confirm trend reversal signals, bear and bull emojis are included. If the RSI reaches an oversold zone and then drops by a certain amount, while the MACD turns negative and the Stochastic RSI makes a gold or dead cross, the bear and bull signals are activated.
Pivot Points: Calculated based on the high, low, and close prices over a specific lookback period. These points are used to determine support and resistance levels. Pivot points provide a framework for assessing market sentiment and potential reversal zones. The values calculated this way activate the sun and snowflake signals.
The Overheat Cooldown Pivot: captures moments when the market shows signs of exhaustion, particularly when overbought or oversold conditions are accompanied by a drop in volume. This helps traders anticipate market turning points more effectively. These signals appear as red or green triangles indicating potential reversals. Although similar to the bear and bull signals in detecting market cool-off points, these signals rely on volume and may have slightly lower reliability.
Practical Application:
By using this indicator, traders can strategically adjust their bet sizes based on the reliability of the signals. When multiple signals coincide, it indicates a higher probability of a trend reversal, allowing for larger position sizes. Conversely, when signals occur independently, it suggests a lower probability, warranting smaller position sizes. This approach enables traders to manage their risk effectively and capitalize on high-probability trading opportunities without excessively reducing trading frequency.
Trading Method:
The basic setup is for Bitcoin on a 15-minute timeframe, and short-term trading is recommended by the creator. Upon signal activation, if only one signal appears, verify the volume and support/resistance lines, calculate the risk-reward ratio, and enter a position with a low betting ratio. If three signals activate simultaneously, enter a position with a higher betting ratio.
Reliability Order:
🐻🐮 > ❄️☀️ > 🔻🔺 (replacing green triangle emojis)
This indicator provides a powerful method for detecting multiple potential market reversals and trend continuations.
Note: Have realistic expectations and understand the limitations of technical analysis tools. This indicator is a tool to assist in your trading decisions and not a guaranteed prediction of market movements.
Warning! Do not trade solely based on this indicator.
Additionally, if you find the settings lacking, feel free to adjust them yourself! Thank you!
Korean Version
곰돌이와 송아지 멀티 피봇 시그널 인디케이터
개요:
곰돌이와 송아지 멀티 피봇 시그널 인디케이터는 잠재적 시장 반전 지점과 추세 변화를 식별하기 위해 설계된 종합 거래 도구입니다. 이 인디케이터는 RSI, MACD, 피봇 포인트 등의 여러 기술 분석 전략을 결합하여 신뢰할 수 있는 신호를 생성합니다. 이러한 신호들을 중첩함으로써 정확한 추세 예측의 가능성을 높여, 트레이더가 정보를 기반으로 결정을 내리는 데 유용한 통찰력을 제공합니다.
기본적으로 비트코인 15분봉을 기준으로 하며 매매 방법은 단타를 권장합니다. 다른 타임프레임에서의 신뢰는 보장 하지 않습니다.
주요 기능:
곰돌이와 송아지 신호: 시장의 잠재적 반전 지점을 곰돌이와 송아지 이모지로 명확하게 표시합니다.
지지 및 저항 신호: 중요한 가격 수준을 나타내기 위해 태양과 눈송이 이모지로 표시합니다.
오버히트 쿨다운 피봇: 시장 피로 지점을 감지하여 잠재적 반전 신호를 제공합니다.
세팅방법:
RSI 설정: RSI 기간과 임계값을 조정하여 자신의 거래 전략에 맞춥니다. 기본값은 단기 거래에 최적화되어 있습니다.
MACD 설정: MACD 설정은 미리 구성되어 있으며, 필요에 따라 사용자 정의가 가능합니다.
비쥬얼 세팅: 과도한 시그널 때문에 눈이 아프시다면 비쥬얼세팅에서 선택적으로 기능들을 켜거나 끌 수 있으니 참고하세요.
신호 설명:
🐻 곰돌이 신호: 시장이 하락할 가능성이 있는 고점을 나타냅니다. RSI와 MACD 조건을 결합하여 신뢰할 수 있는 과매수 신호를 제공합니다. 높은 거래량과 함께 나타나면 강한 저항 수준을 나타낼 수 있습니다.
🐮 송아지 신호: 시장이 상승할 가능성이 있는 저점을 나타냅니다. RSI와 MACD 조건을 사용하여 과매도 상황을 강조합니다. 높은 거래량과 함께 나타나면 강한 지지 수준을 나타낼 수 있습니다.
❄️ 저항 신호: 가격이 더 이상 상승하기 어려운 저항 수준을 나타냅니다. 가격이 이 수준 아래로 하락하면 잠재적 하락 움직임을 신호합니다. 높은 거래량과 함께 나타나면 강력한 저항을 의미할 수 있습니다.
☀️ 지지 신호: 가격이 더 이상 하락하기 어려운 지지 수준을 나타냅니다. 가격이 이 수준 위로 상승하면 잠재적 상승 움직임을 신호합니다. 높은 거래량과 함께 나타나면 강한 지지를 의미할 수 있습니다.
상세 설명:
이 인디케이터는 여러 인디케이터를 단순히 결합한 것이 아니라, 여러가지 시그널들을 사용해서 잠재적 추세전환 신호 감지 확률을 높이는 것에 목적이 있습니다. 단순히 여러가지 조건들이 중첩되었을때만 신호가 뜬다면 우리는 1년에 몇번이나 매매를 할 수 있을까요. 모든경우에 100% 라는 경우가 없기때문에 우리는 다양한 신호들을 활용하여 전략을 구성하고 매매를 진행 해야합니다. 예를들어 1개의 시그널만 뜬다면 추세전환 신호의 신뢰도가 다소 약하기 때문에 시드의 일부 금액만 배팅 하는 식으로 전략을 구성 할 수도 있고, 만약 여러가지 시그널들이 충접적으로 뜬다면 신뢰도 높은 추세전환의 신호로 인식하여 배팅금액을 높이고 스탑로스를 높게 잡는 방향으로 전략을 구성 할 수 있습니다. 단순히 맹목적으로 시그널이 떳다고 매매하는것이 아닌 보조 신호로써의 기능, 이것이 내가 생각하는 인디케이터의 역할이자 본질 이라고 생각합니다.
RSI (상대 강도 지수)와 MACD, 스토캐스틱 RSI: 여러가지 지표들을 기반으로 추세 반전의 신호를 확인 할 수 있는 곰돌이와 송아지를 넣었습니다. RSI 가 과매도 구간에 도달한 이후일정 수치 이상 하락하는 동시에 MACD가 음수로 변하고 스토캐스틱 RSI가 골드, 데드 크로스가 된다면 곰돌이와 송아지 신호가 활성화 됩니다.
피봇 포인트: 특정 되돌아보기 기간 동안의 최고, 최저, 종가를 기반으로 계산됩니다. 이 포인트는 지지 및 저항 수준을 결정하는 데 사용됩니다. 피봇 포인트는 시장 심리와 잠재적 반전 영역을 평가하는 프레임워크를 제공합니다. 이렇게 계산된 값을 기반으로 눈송이와 해 신호가 활성화 됩니다.
오버히트 쿨다운 피봇: 는 과매수 또는 과매도 상태에서 거래량이 감소할 때 시장 피로 지점을 포착하여 잠재적 반전 지점을 신호합니다. 이러한 피로 지점을 식별함으로써 인디케이터는 트레이더가 시장의 전환점을 보다 효과적으로 예측할 수 있도록 돕습니다. 그렇게 추세 반전의 신호로 녹색 또는 붉은색 삼각형 시그널이 뜹니다. 과열된 시장이 냉각되는 포인트를 찾는점에서는 곰돌이 송아지 신호와 비슷하지만 거래량을 기반으로 하고 있기 때문에 명백히 다른 시그널이며 신뢰도는 약간 낮을 수도 있습니다
실용적 적용:
이 인디케이터를 사용함으로써, 트레이더는 신호의 신뢰도에 따라 베팅 크기를 전략적으로 조정할 수 있습니다. 여러 신호가 동시에 나타날 때, 이는 추세 반전의 가능성이 높음을 나타내며, 더 큰 포지션 크기를 허용합니다. 반대로, 신호가 독립적으로 발생할 때는 낮은 가능성을 나타내므로 작은 포지션 크기가 적합합니다. 이 접근 방식은 트레이더가 효과적으로 리스크를 관리하고 높은 확률의 거래 기회를 활용하면서 거래 빈도를 과도하게 줄이는 것을 방지할 수 있게 합니다.
매매방법:
기본적인 세팅은 비트코인 15분 타임프레임이며 제작자는 단타를 추천합니다. 포지션 진입시 시그널이 1개가 뜬다면 거래량과 지지와 저항라인을 확인하고 손익비를 계산후 낮은 배팅 비율로 포지션에 진입합니다. 만약에 3개의 시그널이 동시에 활성화 된다면 보다 높은 비율로 포지션에 진입합니다.
신뢰도 순서:
]🐻🐮 > ❄️☀️ > 🔻🔺(초록 삼각이모지가 없기때문에 이것으로 대체)
이 지표는 여러 잠재적인 시장 반전 및 추세 지속성을 감지하는 강력한 방법을 제공합니다.
참고: 현실적인 기대를 가지고 기술 분석 도구의 한계를 이해하십시오. 이 지표는 시장 움직임을 보장하는 예측이 아니라 거래 결정을 돕기 위한 도구입니다.
경고! 절대 이 지표만을 가지고 매매하지 마십쇼.
추가적으로 제작자는 지표 세팅에 허접이라 꼬우면 당신이 세팅하십쇼! 감사합니다!

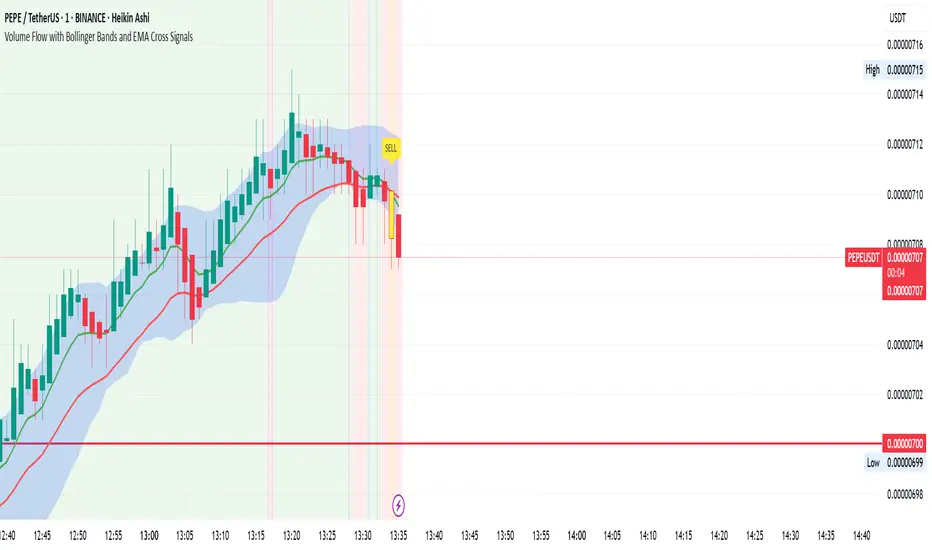
Volume Flow with Bollinger Bands and EMA Cross SignalsThe Volume Flow with Bollinger Bands and EMA Cross Signals indicator is a custom technical analysis tool designed to identify potential buy and sell signals based on several key components:
Volume Flow: This component combines price movement and trading volume to create a signal that indicates the strength or weakness of price movements. When the price is rising with increasing volume, it suggests strong buying activity, whereas falling prices with increasing volume indicate strong selling pressure.
Bollinger Bands: Bollinger Bands consist of three lines:
The Basis (middle line), which is a Simple Moving Average (SMA) of the price over a set period.
The Upper Band, which is the Basis plus a multiple of the standard deviation (typically 2).
The Lower Band, which is the Basis minus a multiple of the standard deviation. Bollinger Bands help identify periods of high volatility and potential overbought/oversold conditions. When the price touches the upper band, it might indicate that the market is overbought, while touching the lower band might indicate oversold conditions.
EMA Crossovers: The script includes two Exponential Moving Averages (EMAs):
Fast EMA: A shorter-term EMA, typically more sensitive to price changes.
Slow EMA: A longer-term EMA, responding slower to price changes. The crossover of the Fast EMA crossing above the Slow EMA (bullish crossover) signals a potential buy opportunity, while the Fast EMA crossing below the Slow EMA (bearish crossover) signals a potential sell opportunity.
Background Color and Candle Color: The indicator highlights the chart's background with specific colors based on the signals:
Green background for buy signals.
Yellow background for sell signals. Additionally, the candles are colored green for buy signals and yellow for sell signals to visually reinforce the trade opportunities.
Buy/Sell Labels: Small labels are placed on the chart:
"BUY" label in green is placed below the bar when a buy signal is generated.
"SELL" label in yellow is placed above the bar when a sell signal is generated.
Working of the Indicator:
Volume Flow Calculation: The Volume Flow is calculated by multiplying the price change (current close minus the previous close) with the volume. This product is then smoothed with a Simple Moving Average (SMA) over a user-defined period (length). The result is then multiplied by a multiplier to adjust its sensitivity.
Price Change = close - close
Volume Flow = Price Change * Volume
Smoothed Volume Flow = SMA(Volume Flow, length)
The Volume Flow Signal is then: Smooth Volume Flow * Multiplier
This calculation represents the buying or selling pressure in the market.
Bollinger Bands: Bollinger Bands are calculated using the Simple Moving Average (SMA) of the closing price (basis) and the Standard Deviation (stdev) of the price over a period defined by the user (bb_length).
Basis (Middle Band) = SMA(close, bb_length)
Upper Band = Basis + (bb_std_dev * Stdev)
Lower Band = Basis - (bb_std_dev * Stdev)
The upper and lower bands are plotted alongside the price to identify the price's volatility. When the price is near the upper band, it could be overbought, and near the lower band, it could be oversold.
EMA Crossovers: The Fast EMA and Slow EMA are calculated using the Exponential Moving Average (EMA) function. The crossovers are detected by checking:
Buy Signal (Bullish Crossover): When the Fast EMA crosses above the Slow EMA.
Sell Signal (Bearish Crossover): When the Fast EMA crosses below the Slow EMA.
The long_condition variable checks if the Fast EMA crosses above the Slow EMA, and the short_condition checks if it crosses below.
Visual Signals:
Background Color: The background is colored green for a buy signal and yellow for a sell signal. This gives an immediate visual cue to the trader.
Bar Color: The candles are colored green for buy signals and yellow for sell signals.
Labels:
A "BUY" label in green appears below the bar when the Fast EMA crosses above the Slow EMA.
A "SELL" label in yellow appears above the bar when the Fast EMA crosses below the Slow EMA.
Summary of Buy/Sell Logic:
Buy Signal:
The Fast EMA crosses above the Slow EMA (bullish crossover).
Volume flow is positive, indicating buying pressure.
Background turns green and candles are colored green.
A "BUY" label appears below the bar.
Sell Signal:
The Fast EMA crosses below the Slow EMA (bearish crossover).
Volume flow is negative, indicating selling pressure.
Background turns yellow and candles are colored yellow.
A "SELL" label appears above the bar.
Usage of the Indicator:
This indicator is designed to help traders identify potential entry (buy) and exit (sell) points based on:
The interaction of Exponential Moving Averages (EMAs).
The strength and direction of Volume Flow.
Price volatility using Bollinger Bands.
By combining these components, the indicator provides a comprehensive view of market conditions, helping traders make informed decisions on when to enter and exit trades.
MA RSI MACD Signal SuiteThis Pine Script™ is designed for use in Trading View and generates trading signals based on moving average (MA) crossovers, RSI (Relative Strength Index) signals, and MACD (Moving Average Convergence Divergence) indicators. It provides visual markers on the chart and can be configured to suit various trading strategies.
1. Indicator Overview
The indicator includes signals for:
Moving Averages (MA): It tracks crossovers between different types of moving averages.
RSI: Signals based on RSI crossing certain levels or its signal line.
MACD: Buy and sell signals generated by MACD crossovers.
2. Inputs and Customization
Moving Averages (MAs):
You can customize up to 6 moving averages with different types, lengths, and colors.
MA Type: Choose from different types of moving averages:
SMA (Simple Moving Average)
EMA (Exponential Moving Average)
HMA (Hull Moving Average)
SMMA (RMA) (Smoothed Moving Average)
WMA (Weighted Moving Average)
VWMA (Volume Weighted Moving Average)
T3, DEMA, TEMA
Source: Select the price to base the MA on (e.g., close, open, high, low).
Length: Define the number of periods for each moving average.
Examples:
MA1: Exponential Moving Average (EMA) with a period of 9
MA2: Exponential Moving Average (EMA) with a period of 21
RSI Settings:
RSI is calculated based on a user-defined period and is used to identify potential overbought or oversold conditions.
RSI Length: Lookback period for RSI (default 14).
Overbought Level: Defines the overbought threshold for RSI (default 70).
Oversold Level: Defines the oversold threshold for RSI (default 30).
You can also adjust the smoothing for the RSI signal line and customize when to trigger buy and sell signals based on the RSI crossing these levels.
MACD Settings:
MACD is used for identifying changes in momentum and trends.
Fast Length: The period for the fast moving average (default 12).
Slow Length: The period for the slow moving average (default 26).
Signal Length: The period for the signal line (default 9).
Smoothing Method: Choose between SMA or EMA for both the MACD and the signal line.
3. Signal Logic
Moving Average (MA) Crossover Signals:
Crossover: A bullish signal is generated when a fast MA crosses above a slow MA.
Crossunder: A bearish signal is generated when a fast MA crosses below a slow MA.
The crossovers are plotted with distinct colors, and the chart will display markers for these crossover events.
RSI Signals:
Oversold Crossover: A bullish signal when RSI crosses over its signal line below the oversold level (30).
Overbought Crossunder: A bearish signal when RSI crosses under its signal line above the overbought level (70).
RSI signals are divided into:
Aggressive (Early) Entries: Signals when RSI is crossing the oversold/overbought levels.
Conservative Entries: Signals when RSI confirms a reversal after crossing these levels.
MACD Signals:
Buy Signal: Generated when the MACD line crosses above the signal line (bullish crossover).
Sell Signal: Generated when the MACD line crosses below the signal line (bearish crossunder).
Additionally, the MACD histogram is used to identify momentum shifts:
Rising to Falling Histogram: Alerts when the MACD histogram switches from rising to falling.
Falling to Rising Histogram: Alerts when the MACD histogram switches from falling to rising.
4. Visuals and Alerts
Plotting:
The script plots the following on the price chart:
Moving Averages (MA): The selected MAs are plotted as lines.
Buy/Sell Shapes: Triangular markers are displayed for buy and sell signals generated by RSI and MACD.
Crossover and Crossunder Markers: Crosses are shown when two MAs crossover or crossunder.
Alerts:
Alerts can be configured based on the following conditions:
RSI Signals: Alerts for oversold or overbought crossover and crossunder events.
MACD Signals: Alerts for MACD line crossovers or momentum shifts in the MACD histogram.
Alerts are triggered when specific conditions are met, such as:
RSI crosses over or under the oversold/overbought levels.
MACD crosses the signal line.
Changes in the MACD histogram.
5. Example Usage
1. Trend Reversal Setup:
Buy Signal: Use the RSI oversold crossover and MACD bullish crossover to identify potential entry points in a downtrend.
Sell Signal: Use the RSI overbought crossunder and MACD bearish crossunder to identify potential exit points or short entries in an uptrend.
2. Momentum Strategy:
Combine MACD and RSI signals to identify the strength of a trend. Use MACD histogram analysis and RSI levels for confirmation.
3. Moving Average Crossover Strategy:
Focus on specific MA crossovers, such as the 9-period EMA crossing above the 21-period EMA, for buy signals. When a longer-term MA (e.g., 50-period) crosses a shorter-term MA, it may indicate a strong trend change.
6. Alerts Conditions
The script includes several alert conditions, which can be triggered and customized based on the user’s preferences:
RSI Oversold Crossover: Alerts when RSI crosses over the signal line below the oversold level (30).
RSI Overbought Crossunder: Alerts when RSI crosses under the signal line above the overbought level (70).
MACD Buy/Sell Crossover: Alerts when the MACD line crosses the signal line for a buy or sell signal.
7. Conclusion
This script is highly customizable and can be adjusted to suit different trading strategies. By combining MAs, RSI, and MACD, traders can gain multiple perspectives on the market, enhancing their ability to identify potential buy and sell opportunities.

LiquidFusion SignalPro [CHE] LiquidFusion SignalPro – Indicator Overview
The LiquidFusion SignalPro is a powerful and sophisticated TradingView indicator designed to identify high-quality trade entries and exits. By combining seven unique sub-indicators, it provides comprehensive market analysis, ensuring traders can make informed decisions. This tool is suitable for all market conditions and supports customization to fit individual trading strategies.
Key Components (Sub-Indicators):
1. RPM (Relative Price Momentum):
- Measures cumulative price momentum over a specified period.
- Provides insights into price strength and directional bias.
- Input Customization:
- Source: Data for momentum calculation.
- Period: Length for momentum measurement.
- Resolution: Timeframe for data fetching.
2. BBO (Bull-Bear Oscillator):
- Calculates the strength of bullish or bearish momentum based on price movement and RSI conditions.
- Uses a super-smoothing technique for reliable signals.
- Customizable parameters include the oscillator's period and repainting options.
3. MACD (Moving Average Convergence Divergence):
- A classic momentum indicator for trend direction and strength.
- Provides buy/sell signals based on the crossover of the MACD line and signal line.
- Input Customization:
- Fast/Slow EMA Periods.
- Signal Line Period.
- Resolution and Source Data.
4. RSI (Relative Strength Index):
- Tracks overbought and oversold conditions.
- A key tool to validate trend continuation or reversals.
- Customizable period, resolution, and source.
5. CCI (Commodity Channel Index):
- Measures the deviation of price from its average.
- Useful for identifying cyclical trends.
- Input Customization includes period, resolution, and source.
6. Stochastic Oscillator:
- Indicates momentum by comparing closing prices to a range of highs and lows.
- Includes smoothing factors for %K and %D lines.
- Customizable parameters:
- %K Length and Smoothing.
- Resolution and Repainting Options.
7. Supertrend:
- A trailing stop-and-reverse system for trend-following strategies.
- Excellent for identifying strong trends and potential reversals.
- Inputs include the multiplier factor and period for ATR-like calculations.
Inputs Overview:
The indicator supports extensive customization for each sub-indicator, grouped under intuitive categories:
- Color Settings: Define bullish and bearish plot colors.
- RPM, BBO, MACD, RSI, CCI, Stochastic, and Supertrend Settings: Tailor each sub-indicator's behavior with adjustable parameters.
- UI Options: Toggle features such as bar coloring, indicator names, and plotted candles.
Trade Signals:
- Long Signal:
- All indicators align in a bullish state:
- RPM > 0, MACD > 0, RSI > 50, Stochastic > 50, CCI > 0, BBO > 0, Supertrend below price.
- Plot: Green triangle below the candle.
- Alert: Notifies the trader of a potential long entry.
- Short Signal:
- All indicators align in a bearish state:
- RPM < 0, MACD < 0, RSI < 50, Stochastic < 50, CCI < 0, BBO < 0, Supertrend above price.
- Plot: Red triangle above the candle.
- Alert: Notifies the trader of a potential short entry.
Features:
- Enhanced Visuals: Plots sub-indicator statuses using labels and color-coded shapes for clarity.
- Alerts: Integrated alert conditions for both long and short trades.
- Bar Coloring: Provides overall trend bias with green (bullish), red (bearish), or gray (neutral) bars.
- Customizable Table: Displays the indicator's status in the chart’s top-right corner.
Trading Benefits:
The LiquidFusion SignalPro excels in generating high-quality entries and exits by:
- Reducing noise through multiple indicator alignment.
- Supporting multiple timeframes and resolutions for flexibility.
- Offering customizable inputs for personalized trading strategies.
Use this tool to enhance your market analysis and improve your trading performance.
Disclaimer:
The content provided, including all code and materials, is strictly for educational and informational purposes only. It is not intended as, and should not be interpreted as, financial advice, a recommendation to buy or sell any financial instrument, or an offer of any financial product or service. All strategies, tools, and examples discussed are provided for illustrative purposes to demonstrate coding techniques and the functionality of Pine Script within a trading context.
Any results from strategies or tools provided are hypothetical, and past performance is not indicative of future results. Trading and investing involve high risk, including the potential loss of principal, and may not be suitable for all individuals. Before making any trading decisions, please consult with a qualified financial professional to understand the risks involved.
By using this script, you acknowledge and agree that any trading decisions are made solely at your discretion and risk.
This indicator is inspired by the Super 6x Indicators: RSI, MACD, Stochastic, Loxxer, CCI, and Velocity . A special thanks to Loxx for their relentless effort, creativity, and contributions to the TradingView community, which served as a foundation for this work.
Happy trading and best regards
Chervolino

LRS-Strategy: 200-EMA Buffer & Long/Short Signals LRS-Strategy: 200-EMA Buffer & Long/Short Signals
This indicator is designed to help traders implement the Leveraged Return Strategy (LRS) using the 200-day Exponential Moving Average (EMA) as a key trend-following signal. The indicator offers clear long and short signals by analyzing the price movements relative to the 200-day EMA, enhanced by customizable buffer zones for increased precision.
Key Features:
200-Day EMA: The main trend indicator. When the price is above the 200-day EMA, the market is considered in an uptrend, and when it is below, it indicates a downtrend.
Customizable Buffer Zones: Users can define a percentage buffer around the 200-day EMA (default is 3%). The upper and lower buffer zones help filter out noise and prevent premature signals.
Precise Long/Short Signals:
Long Signal: Triggered when the price moves from below the lower buffer zone, crosses the 200-day EMA, and then breaks above the upper buffer zone.
Short Signal: Triggered when the price moves from above the upper buffer zone, crosses the 200-day EMA, and then breaks below the lower buffer zone.
Alternating Signals: Ensures that a new signal (long or short) is only generated after the opposite signal has been triggered, preventing multiple signals of the same type without a reversal.
Clear Visual Aids: The indicator displays the 200-day EMA and buffer zones on the chart, along with buy (long) and sell (short) signals. This makes it easy to track trends and time entries/exits.
How to Use:
Long Entry: Look for the price to move below the lower buffer, cross the 200-day EMA from below, and then break out of the upper buffer to confirm a long signal.
Short Entry: Look for the price to move above the upper buffer, cross below the 200-day EMA, and then break below the lower buffer to confirm a short signal.
This indicator is perfect for traders who prefer a structured, trend-following approach, using clear rules to minimize noise and identify meaningful long or short opportunities.

Multiple MAs Signals with RSI MA Filter & Signal About the Script
The "Multiple Moving Averages Signals with RSI MA Filter and Golden Signals" script is a comprehensive trading tool designed to provide traders with detailed insights and actionable signals based on multiple moving averages and RSI (Relative Strength Index). This script combines traditional moving average crossovers with RSI filtering to enhance the accuracy of trading signals and includes "golden" signals to highlight significant long-term trend changes.
This script integrates several technical indicators and concepts to create a robust and versatile trading tool. Here's why this combination is both original and useful:
1. Multiple Moving Averages:
- Why Use Multiple MAs: Different types of moving averages (SMA, EMA, SMMA, WMA, VWMA, Hull) offer unique perspectives on price trends and volatility. Combining them allows traders to capture a more comprehensive view of the market.
- Purpose: Using multiple moving averages helps identify trend direction, support/resistance levels, and potential reversal points.
2. RSI MA Filter:
- Why Use RSI: RSI is a momentum oscillator that measures the speed and change of price movements. It is used to identify overbought or oversold conditions in a market.
- Purpose: Filtering signals with RSI moving averages ensures that trades are taken in line with the prevailing momentum, reducing the likelihood of false signals.
3. Golden Signals:
- Why Use Golden Crosses: A golden cross (50-period MA crossing above the 200-period MA) is a well-known bullish signal, while a death cross (50-period MA crossing below the 200-period MA) is bearish. These signals are widely followed by traders and institutions.
- Purpose: Highlighting these significant long-term signals helps traders identify major buy or sell opportunities and align with broader market trends.
How the Script Works
1. Moving Average Calculations:
- The script calculates multiple moving averages (MA1 to MA5) based on user-selected types (SMA, EMA, SMMA, WMA, VWMA, Hull) and periods (9, 21, 50, 100, 200).
- Golden Moving Averages: Separately calculates 50-period and 200-period moving averages for generating golden signals.
2. RSI and RSI MA Filter:
- RSI Calculation: Computes the RSI for the given period.
- RSI MA: Calculates a moving average of the RSI to smooth out the RSI values and reduce noise.
- RSI MA Filter: Traders can enable/disable RSI filtering and set custom thresholds to refine long and short signals based on RSI momentum.
3. Long & Short Signal Generation:
- Long Signal: Generated when the short-term moving average crosses above both the mid-term and long-term moving averages, and the RSI MA is below the specified threshold (if enabled).
- Short Signal: Generated when the short-term moving average crosses below both the mid-term and long-term moving averages, and the RSI MA is above the specified threshold (if enabled).
4. Golden Signals:
- Golden Long Signal: Triggered when the 50-period golden moving average crosses above the 200-period golden moving average.
- Golden Short Signal: Triggered when the 50-period golden moving average crosses below the 200-period golden moving average.
How to Use the Script
1. Customize Inputs:
- Moving Averages: Choose the type of moving averages and set the periods for up to five different moving averages.
- RSI Settings: Adjust the RSI period and its moving average period. Enable or disable RSI filtering and set custom thresholds for long and short signals.
- Signal Colors: Customize the colors for long, short, and golden signals.
- Enable/Disable Signals: Toggle the visibility of long, short, and golden signals.
2. Observe Plots and Signals:
- The script plots the selected moving averages on the chart.
- Long and short signals are marked with labels on the chart, with customizable colors for easy identification.
- Golden signals are highlighted with specific labels to indicate significant long-term trend changes.
3. Analyze and Trade:
- Use the generated signals as part of your trading strategy. The script provides visual cues to help you make informed decisions about entering or exiting trades based on multiple technical indicators.
Unique Features
1. Integration of Multiple Moving Averages: Combines various moving average types to provide a holistic view of market trends.
2. RSI MA Filtering: Enhances signal accuracy by incorporating RSI momentum, reducing the likelihood of false signals.
3. Golden Signals: Highlights significant long-term trend changes, aligning with broader market movements.
4. Customizability: Offers extensive customization options, allowing traders to tailor the script to their specific trading strategies and preferences.
feel free to comments.

Impulse Reactor RSI-SMA Trend Indicator [ApexLegion]Impulse Reactor RSI-SMA Trend Indicator
Introduction and Theoretical Background
Design Rationale
Standard indicators frequently generate binary 'BUY' or 'SELL' signals without accounting for the broader market context. This often results in erratic "Flip-Flop" behavior, where signals are triggered indiscriminately regardless of the prevailing volatility regime.
Impulse Reactor was engineered to address this limitation by unifying two critical requirements: Quantitative Rigor and Execution Flexibility.
The Solution
Composite Analytical Framework This script is not a simple visual overlay of existing indicators. It is an algorithmic synthesis designed to function as a unified decision-making engine. The primary objective was to implement rigorous quantitative analysis (Volatility Normalization, Structural Filtering) directly within an alert-enabled framework. This architecture is designed to process signals through strict, multi-factor validation protocols before generating real-time notifications, allowing users to focus on structurally validated setups without manual monitoring.
How It Works
This is not a simple visual mashup. It utilizes a cross-validation algorithm where the Trend Structure acts as a gatekeeper for Momentum signals:
Logic over Lag: Unlike simple moving average crossovers, this script uses a 15-layer Gradient Ribbon to detect "Laminar Flow." If the ribbon is knotted (Compression), the system mathematically suppresses all signals.
Volatility Normalization: The core calculation adapts to ATR (Average True Range). This means the indicator automatically expands in volatile markets and contracts in quiet ones, maintaining accuracy without constant manual tweaking.
Adaptive Signal Thresholding: It incorporates an 'Anti-Greed' algorithm (Dynamic Thresholding) that automatically adjusts entry criteria based on trend duration. This logic aims to mitigate the risk of entering positions during periods of statistical trend exhaustion.
Why Use It?
Market State Decoding: The gradient Ribbon visualizes the underlying trend phase in real-time.
◦ Cyan/Blue Flow: Strong Bullish Trend (Laminar Flow).
◦ Magenta/Pink Flow: Strong Bearish Trend.
◦ Compressed/Knotted: When the ribbon lines are tightly squeezed or overlapping, it signals Consolidation. The system filters signals here to avoid chop.
Noise Reduction: The goal is not to catch every pivot, but to isolate high-confidence setups. The logic explicitly filters out minor fluctuations to help maintain position alignment with the broader trend.
⚖️ Chapter 1: System Architecture
Introduction: Composite Analytical Framework
System Overview
Impulse Reactor serves as a comprehensive technical analysis engine designed to synthesize three distinct market dimensions—Momentum, Volatility, and Trend Structure—into a unified decision-making framework. Unlike traditional methods that analyze these metrics in isolation, this system functions as a central processing unit that integrates disparate data streams to construct a coherent model of market behavior.
Operational Objective
The primary objective is to transition from single-dimensional signal generation to a multi-factor assessment model. By fusing data from the Impulse Core (Volatility), Gradient Oscillator (Momentum), and Structural Baseline (Trend), the system aims to filter out stochastic noise and identify high-probability trade setups grounded in quantitative confluence.
Market Microstructure Analysis: Limitations of Conventional Models
Extensive backtesting and quantitative analysis have identified three critical inefficiencies in standard oscillator-based strategies:
• Bounded Oscillator Limitations (The "Oscillation Trap"): Traditional indicators such as RSI or Stochastics are mathematically constrained between fixed values (0 to 100). In strong trending environments, these metrics often saturate in "overbought" or "oversold" zones. Consequently, traders relying on static thresholds frequently exit structurally valid positions prematurely or initiate counter-trend trades against prevailing momentum, resulting in suboptimal performance.
• Quantitative Blindness to Quality: Standard moving averages and trend indicators often fail to distinguish the qualitative nature of price movement. They treat low-volume drift and high-velocity expansion identically. This inability to account for "Volatility Quality" leads to delayed responsiveness during critical market events.
• Fractal Dissonance (Timeframe Disconnect): Financial markets exhibit fractal characteristics where trends on lower timeframes may contradict higher timeframe structures. Manual integration of multi-timeframe analysis increases cognitive load and susceptibility to human error, often resulting in conflicting biases at the point of execution.
Core Design Principles
To mitigate the aforementioned systemic inefficiencies, Impulse Reactor employs a modular architecture governed by three foundational principles:
Principle A:
Volatility Precursor Analysis Market mechanics demonstrate that volatility expansion often functions as a leading indicator for directional price movement. The system is engineered to detect "Volatility Deviation" — specifically, the divergence between short-term and long-term volatility baselines—prior to its manifestation in price action. This allows for entry timing aligned with the expansion phase of market volatility.
Principle B:
Momentum Density Visualization The system replaces singular momentum lines with a "Momentum Density" model utilizing a 15-layer Simple Moving Average (SMA) Ribbon.
• Concept: This visualization represents the aggregate strength and consistency of the trend.
• Application: A fully aligned and expanded ribbon indicates a robust trend structure ("Laminar Flow") capable of withstanding minor counter-trend noise, whereas a compressed ribbon signals consolidation or structural weakness.
Principle C:
Adaptive Confluence Protocols Signal validity is strictly governed by a multi-dimensional confluence logic. The system suppresses signal generation unless there is synchronized confirmation across all three analytical vectors:
1. Volatility: Confirmed expansion via the Impulse Core.
2. Momentum: Directional alignment via the Hybrid Oscillator.
3. Structure: Trend validation via the Baseline. This strict filtering mechanism significantly reduces false positives in non-trending (choppy) environments while maintaining sensitivity to genuine breakouts.
🔍 Chapter 2: Core Modules & Algorithmic Logic
Module A: Impulse Core (Normalized Volatility Deviation)
Operational Logic The Impulse Core functions as a volatility-normalized momentum gauge rather than a standard oscillator. It is designed to identify "Volatility Contraction" (Squeeze) and "Volatility Expansion" phases by quantifying the divergence between short-term and long-term volatility states.
Volatility Z-Score Normalization
The formula implements a custom normalization algorithm. Unlike standard oscillators that rely on absolute price changes, this logic calculates the Z-Score of the Volatility Spread.
◦ Numerator: (atr_f - atr_s) captures the raw momentum of volatility expansion.
◦ Denominator: (std_f + 1e-6) standardizes this value against historical variance.
◦ Result: This allows the indicator scales consistently across assets (e.g., Bitcoin vs. Euro) without manual recalibration.
f_impulse() =>
atr_f = ta.atr(fastLen) // Fast Volatility Baseline
atr_s = ta.atr(slowLen) // Slow Volatility Baseline
std_f = ta.stdev(atr_f, devLen) // Volatility Standard Deviation
(atr_f - atr_s) / (std_f + 1e-6) // Normalized Differential Calculation
Algorithmic Framework
• Differential Calculation: The system computes the spread between a Fast Volatility Baseline (ATR-10) and a Slow Volatility Baseline (ATR-30).
• Normalization Protocol: To standardize consistency across diverse asset classes (e.g., Forex vs. Crypto), the raw differential is divided by the standard deviation of the volatility itself over a 30-period lookback.
• Signal Generation:
◦ Contraction (Squeeze): When the Fast ATR compresses below the Slow ATR, it registers a potential volatility buildup phase.
◦ Expansion (Release): A rapid divergence of the Fast ATR above the Slow ATR signals a confirmed volatility expansion, validating the strength of the move.
Module B: Gradient Oscillator (RSI-SMA Hybrid)
Design Rationale To mitigate the "noise" and "false reversal" signals common in single-line oscillators (like standard RSI), this module utilizes a 15-Layer Gradient Ribbon to visualize momentum density and persistence.
Technical Architecture
• Ribbon Array: The system generates 15 sequential Simple Moving Averages (SMA) applied to a volatility-adjusted RSI source. The length of each layer increases incrementally.
• State Analysis:
Momentum Alignment (Laminar Flow): When all 15 layers are expanded and parallel, it indicates a robust trend where buying/selling pressure is distributed evenly across multiple timeframes. This state helps filter out premature "overbought/oversold" signals.
• Consolidation (Compression): When the distance between the fastest layer (Layer 1) and the slowest layer (Layer 15) approaches zero or the layers intersect, the system identifies a "Non-Tradable Zone," preventing entries during choppy market conditions.
// Laminar Flow Validation
f_validate_trend() =>
// Calculate spread between Ribbon layers
ribbon_spread = ta.stdev(ribbon_array, 15)
// Only allow signals if Ribbon is expanded (Laminar Flow)
is_flowing = ribbon_spread > min_expansion_threshold
// If compressed (Knotted), force signal to false
is_flowing ? signal : na
Module C: Adaptive Signal Filtering (Behavioral Bias Mitigation)
This subsystem, operating as an algorithmic "Anti-Greed" Mechanism, addresses the statistical tendency for signal degradation following prolonged trends.
Dynamic Threshold Adjustment
• Win Streak Detection: The algorithm internally tracks the outcome of closed trade cycles.
• Sensitivity Multiplier: Upon detecting consecutive successful signals in the same direction, a Penalty_Factor is applied to the entry logic.
• Operational Impact: This effectively raises the Required_Slope threshold for subsequent signals. For example, after three consecutive bullish signals, the system requires a 30% steeper trend angle to validate a fourth entry. This enforces stricter discipline during extended trends to reduce the probability of entering at the point of trend exhaustion.
Anti-Greed Logic: Dynamic Threshold Calculation
f_adjust_threshold(base_slope, win_streak) =>
// Adds a 10% penalty to the difficulty for every consecutive win
penalty_factor = 0.10
risk_scaler = 1 + (win_streak * penalty_factor)
// Returns the new, harder-to-reach threshold
base_slope * risk_scaler
Module D: Trend Baseline (Triple-Smoothed Structure)
The Trend Baseline serves as the structural filter for all signals. It employs a Triple-Smoothed Hybrid Algorithm designed to balance lag reduction with noise filtration.
Smoothing Stages
1. Volatility Banding: Utilizes a SuperTrend-based calculation to establish the upper and lower boundaries of price action.
2. Weighted Filter: Applies a Weighted Moving Average (WMA) to prioritize recent price data.
3. Exponential Smoothing: A final Exponential Moving Average (EMA) pass is applied to create a seamless baseline curve.
Functionality
This "Heavy" baseline resists minor intraday volatility spikes while remaining responsive to sustained structural shifts. A signal is only considered valid if the price action maintains structural integrity relative to this baseline
🚦 Chapter 3: Risk Management & Exit Protocols
Quantitative Risk Management (TP/SL & Trailing)
Foundational Architecture: Volatility-Adjusted Geometry Unlike strategies relying on static nominal values, Impulse Reactor establishes dynamic risk boundaries derived from quantitative volatility metrics. This design aligns trade invalidation levels mathematically with the current market regime.
• ATR-Based Dynamic Bracketing:
The protocol calculates Stop-Loss and Take-Profit levels by applying Fibonacci coefficients (Default: 0.786 for SL / 1.618 for TP) to the Average True Range (ATR).
◦ High Volatility Environments: The risk bands automatically expand to accommodate wider variance, preventing premature exits caused by standard market noise.
◦ Low Volatility Environments: The bands contract to tighten risk parameters, thereby dynamically adjusting the Risk-to-Reward (R:R) geometry.
• Close-Validation Protocol ("Soft Stop"):
Institutional algorithms frequently execute liquidity sweeps—driving prices briefly below key support levels to accumulate inventory.
◦ Mechanism: When the "Soft Stop" feature is enabled, the system filters out intraday volatility spikes. The stop-loss is conditional; execution is triggered only if the candle closes beyond the invalidation threshold.
◦ Strategic Advantage: This logic distinguishes between momentary price wicks and genuine structural breakdowns, preserving positions during transient volatility.
• Step-Function Trailing Mechanism:
To protect unrealized PnL while allowing for normal price breathing, a two-phase trailing methodology is employed:
◦ Phase 1 (Activation): The trailing function remains dormant until the price advances by a pre-defined percentage threshold.
◦ Phase 2 (Dynamic Floor): Once armed, the stop level creates a moving floor, adjusting relative to price action while maintaining a volatility-based (ATR) buffer to systematically protect unrealized PnL.
• Algorithmic Exit Protocols (Dynamic Liquidity Analysis)
◦ Rationale: Inefficiencies of Static Targets Static "Take Profit" levels often result in suboptimal exits. They compel traders to close positions based on arbitrary figures rather than evolving market structure, potentially capping upside during significant trends or retaining positions while the underlying trend structure deteriorates.
◦ Solution: Structural Integrity Assessment The system utilizes a Dynamic Liquidity Engine to continuously audit the validity of the position. Instead of targeting a specific price point, the algorithm evaluates whether the trend remains statistically robust.
Multi-Factor Exit Logic (The Tri-Vector System)
The Smart Exit protocol executes only when specific algorithmic invalidation criteria are met:
• 1. Momentum Exhaustion (Confluence Decay): The system monitors a 168-hour rolling average of the Confluence Score. A significant deviation below this historical baseline indicates momentum exhaustion, signaling that the driving force behind the trend has dissipated prior to a price reversal. This enables preemptive exits before a potential drawdown.
• 2. Statistical Over-Extension (Mean Reversion): Utilizing the core volatility logic, the system identifies instances where price deviates beyond 2.0 standard deviations from the mean. While the trend may be technically bullish, this statistical anomaly suggests a high probability of mean reversion (elastic snap-back), triggering a defensive exit to capitalize on peak valuation.
• 3. Oscillator Rejection (Immediate Pivot): To manage sudden V-shaped volatility, the system monitors RSI pivots. If a sharp "Pivot High" or divergence is detected, the protocol triggers an immediate "Peak Exit," bypassing standard trend filters to secure liquidity during high-velocity reversals.
🎨 Chapter 4: Visualization Guide
Gradient Oscillator Ribbon
The 15-layer SMA ribbon visualized via plot(r1...r15) represents the "Momentum Density" of the market.
• Visuals:
◦ Cyan/Blue Ribbon: Indicates Bullish Momentum.
◦ Pink/Magenta Ribbon: Indicates Bearish Momentum.
• Interpretation:
◦ Laminar Flow: When the ribbon expands widely and flows in parallel, it signifies a robust trend where momentum is distributed evenly across timeframes. This is the ideal state for trend-following.
◦ Compression (Consolidation): If the ribbon becomes narrow, twisted, or knotted, it indicates a "Non-Tradable Zone" where the market lacks a unified direction. Traders are advised to wait for clarity.
◦ Over-Extension: If the top layer crosses the Overbought (85) or Oversold (15) lines, it visually warns of potential market overheating.
Trend Baseline
The thick, color-changing line plotted via plot(baseline) represents the Structural Backbone of the market.
• Visuals: Changes color based on the trend direction (Blue for Bullish, Pink for Bearish).
• Interpretation:
Structural Filter: Long positions are statistically favored only when price action sustains above this baseline, while short positions are favored below it.
Dynamic Support/Resistance: The baseline acts as a dynamic support level during uptrends and resistance during downtrends.
Entry Signals & Labels
Text labels ("Long Entry", "Short Entry") appear when the system detects high-probability setups grounded in quantitative confluence.
• Visuals: Labeled signals appear above/below specific candles.
• Interpretation:
These signals represent moments where Volatility (Expansion), Momentum (Alignment), and Structure (Trend) are synchronized.
Smart Exit: Labels such as "Smart Exit" or "Peak Exit" appear when the system detects momentum exhaustion or structural decay, prompting a defensive exit to preserve capital.
Dynamic TP/SL Boxes
The semi-transparent colored zones drawn via fill() represent the risk management geometry.
• Visuals: Colored boxes extending from the entry point to the Take Profit (TP) and Stop Loss (SL) levels.
• Function:
Volatility-Adjusted Geometry: Unlike static price targets, these boxes expand during high volatility (to prevent wicks from stopping you out) and contract during low volatility (to optimize Risk-to-Reward ratios).
SAR + MACD Glow
Small glowing shapes appearing above or below candles.
• Visuals: Triangle or circle glows near the price bars.
• Interpretation:
This visual indicates a secondary confirmation where Parabolic SAR and MACD align with the main trend direction. It serves as an additional confluence factor to increase confidence in the trade setup.
Support/Resistance Table
A small table located at the bottom-right of the chart.
• Function: Automatically identifies and displays recent Pivot Highs (Resistance) and Pivot Lows (Support).
• Interpretation: These levels can be used as potential targets for Take Profit or invalidation points for manual Stop Loss adjustments.
🖥️ Chapter 5: Dashboard & Operational Guide
Integrated Analytics Panel (Dashboard Overview)
To facilitate rapid decision-making without manual calculation, the system aggregates critical market dimensions into a unified "Heads-Up Display" (HUD). This panel monitors real-time metrics across multiple timeframes and analytical vectors.
A. Intermediate Structure (12H Trend)
• Function: Anchors the intraday analysis to the broader market structure using a 12-hour rolling window.
• Interpretation:
◦ Bullish (> +0.5%): Indicates a positive structural bias. Long setups align with the macro flow.
◦ Bearish (< -0.5%): Indicates structural weakness. Short setups are statistically favored.
◦ Neutral: Represents a ranging environment where the Confluence Score becomes the primary weighting factor.
B. Composite Confluence Score (Signal Confidence)
• Definition: A probability metric derived from the synchronization of Volatility (Impulse Core), Momentum (Ribbon), and Trend (Baseline).
• Grading Scale:
Strong Buy/Sell (> 7.0 / < 3.0): Indicates full alignment across all three vectors. Represents a "Prime Setup" eligible for standard position sizing.
Buy/Sell (5.0–7.0 / 3.0–5.0): Indicates a valid trend but with moderate volatility confirmation.
Neutral: Signals conflicting data (e.g., Bullish Momentum vs. Bearish Structure). Trading is not recommended ("No-Trade Zone").
C. Statistical Deviation Status (Mean Reversion)
• Logic: Utilizes Bollinger Band deviation principles to quantify how far price has stretched from the statistical mean (20 SMA).
• Alert States:
Over-Extended (> 2.0 SD): Warning that price is statistically likely to revert to the mean (Elastic Snap-back), even if the trend remains technically valid. New entries are discouraged in this zone.
Normal: Price is within standard distribution limits, suitable for trend-following entries.
D. Volatility Regime Classification
• Metric: Compares current ATR against a 100-period historical baseline to categorize the market state.
• Regimes:
Low Volatility (Lvl < 1.0): Market Compression. Often precedes volatility expansion events.
Mid Volatility (Lvl 1.0 - 1.5): Standard operating environment.
High Volatility (Lvl > 1.5): Elevated market stress. Risk parameters should be adjusted (e.g., reduced position size) to account for increased variance.
E. Performance Telemetry
• Function: Displays the historical reliability of the Trend Baseline for the current asset and timeframe.
• Operational Threshold: If the displayed Win Rate falls below 40%, it suggests the current market behavior is incoherent (choppy) and does not respect trend logic. In such cases, switching assets or timeframes is recommended.
Operational Protocols & Signal Decoding
Visual Interpretation Standards
• Laminar Flow (Trade Confirmation): A valid trend is visually confirmed when the 15-layer SMA Ribbon is fully expanded and parallel. This indicates distributed momentum across timeframes.
• Consolidation (No-Trade): If the ribbon appears twisted, knotted, or compressed, the market lacks a unified directional vector.
• Baseline Interaction: The Triple-Smoothed Baseline acts as a dynamic support/resistance filter. Long positions remain valid only while price sustains above this structure.
System Calibration (Settings)
• Adaptive Signal Filtering (Prev. Anti-Greed): Enabled by default. This logic automatically raises the required trend slope threshold following consecutive wins to mitigate behavioral bias.
• Impulse Sensitivity: Controls the reactivity of the Volatility Core. Higher settings capture faster moves but may introduce more noise.
⚙️ Chapter 6: System Configuration & Alert Guide
This section provides a complete breakdown of every adjustable setting within Impulse Reactor to assist you in tailoring the engine to your specific needs.
🌐 LANGUAGE SETTINGS (Localization)
◦ Select Language (Default: English):
Function: Instantly translates all chart labels, dashboard texts into your preferred language.
Supported: English, Korean, Chinese, Spanish
⚡ IMPULSE CORE SETTINGS (Volatility Engine)
◦ Deviation Lookback (Default: 30): The period used to calculate the standard deviation of volatility.
Role: Sets the baseline for normalizing momentum. Higher values make the core smoother but slower to react.
◦ Fast Pulse Length (Default: 10): The short-term ATR period.
Role: Detects rapid volatility expansion.
◦ Slow Pulse Length (Default: 30): The long-term ATR baseline.
Role: Establishes the background volatility level. The core signal is derived from the divergence between Fast and Slow pulses.
🎯 TP/SL SETTINGS (Risk Management)
◦ SL/TP Fibonacci (Default: 0.786 / 1.618): Selects the Fibonacci ratio used for risk calculation.
◦ SL/TP Multiplier (Default: 1.5 / 2): Applies a multiplier to the ATR-based bands.
Role: Expands or contracts the Take Profit and Stop Loss boxes. Increase these values for higher volatility assets (like Altcoins) to avoid premature stop-outs.
◦ ATR Length (Default: 14): The lookback period for calculating the Average True Range used in risk geometry.
◦ Use Soft Stop (Close Basis):
Role: If enabled, Stop Loss alerts only trigger if a candle closes beyond the invalidation level. This prevents being stopped out by wick manipulations.
🔊 RIBBON SETTINGS (Momentum Visualization)
◦ Show SMA Ribbon: Toggles the visibility of the 15-layer gradient ribbon.
◦ Ribbon Line Count (Default: 15): The number of SMA lines in the ribbon array.
◦ Ribbon Start Length (Default: 2) & Step (Default: 1): Defines the spread of the ribbon.
Role: Controls the "thickness" of the momentum density visualization. A wider step creates a broader ribbon, useful for higher timeframes.
📎 DISPLAY OPTIONS
◦ Show Entry Lines / TP/SL Box / Position Labels / S/R Levels / Dashboard: Toggles individual visual elements on the chart to reduce clutter.
◦ Show SAR+MACD Glow: Enables the secondary confirmation shapes (triangles/circles) above/below candles.
📈 TREND BASELINE (Structural Filter)
◦ Supertrend Factor (Default: 12) & ATR Period (Default: 90): Controls the sensitivity of the underlying Supertrend algorithm used for the baseline calculation.
◦ WMA Length (40) & EMA Length (14): The smoothing periods for the Triple-Smoothed Baseline.
◦ Min Trend Duration (Default: 10): The minimum number of bars the trend must be established before a signal is considered valid.
🧠 SMART EXIT (Dynamic Liquidity)
◦ Use Smart Exit: Enables the momentum exhaustion logic.
◦ Exit Threshold Score (Default: 3): The sensitivity level for triggering a Smart Exit. Lower values trigger earlier exits.
◦ Average Period (168) & Min Hold Bars (5): Defines the rolling window for momentum decay analysis and the minimum duration a trade must be held before Smart Exit logic activates.
🛡️ TRAILING STOP (Step)
◦ Use Trailing Stop: Activates the step-function trailing mechanism.
◦ Step 1 Activation % (0.5) & Offset % (0.5): The price must move 0.5% in your favor to arm the first trail level, which sets a stop 0.5% behind price.
◦ Step 2 Activation % (1) & Offset % (0.2): Once price moves 1%, the trail tightens to 0.2%, securing the position.
🌀 SAR & MACD SETTINGS (Secondary Confirmation)
◦ SAR Start/Increment/Max: Standard Parabolic SAR parameters.
◦ SAR Score Scaling (ATR): Adjusts how much weight the SAR signal has in the overall confluence score.
◦ MACD Fast/Slow/Signal: Standard MACD parameters used for the "Glow" signals.
🔄 ANTI-GREED LOGIC (Behavioral Bias)
◦ Strict Entry after Win: Enables the negative feedback loop.
◦ Strict Multiplier (Default: 1.1): Increases the entry difficulty by 10% after each win.
Role: Prevents overtrading and entering at the top of an extended trend.
🌍 HTF FILTER (Multi-Timeframe)
◦ Use Auto-Adaptive HTF Filter: Automatically selects a higher timeframe (e.g., 1H -> 4H) to filter signals.
◦ Bypass HTF on Steep Trigger: Allows an entry even against the HTF trend if the local momentum slope is exceptionally steep (catch powerful reversals).
📉 RSI PEAK & CHOPPINESS
◦ RSI Peak Exit (Instant): Triggers an immediate exit if a sharp RSI pivot (V-shape) is detected.
◦ Choppiness Filter: Suppresses signals if the Choppiness Index is above the threshold (Default: 60), indicating a flat market.
📐 SLOPE TRIGGER LOGIC
◦ Force Entry on Steep Slope: Overrides other filters if the price angle is extremely vertical (high velocity).
◦ Slope Sensitivity (1.5): The angle required to trigger this override.
⛔ FLAT MARKET FILTER (ADX & ATR)
◦ Use ADX Filter: Blocks signals if ADX is below the threshold (Default: 20), indicating no trend.
◦ Use ATR Flat Filter: Blocks signals if volatility drops below a critical level (dead market).
🔔 Alert Configuration Guide
Impulse Reactor is designed with a comprehensive suite of alert conditions, allowing you to automate your trading or receive real-time notifications for specific market events.
How to Set Up:
Click the "Alert" (Clock) icon in the TradingView toolbar.
Select "Impulse Reactor " from the Condition dropdown.
Choose one of the specific trigger conditions below:
🚀 Entry Signals (Trend Initiation)
Long Entry:
Trigger: Fires when a confirmed Bullish Setup is detected (Momentum + Volatility + Structure align).
Usage: Use this to enter new Long positions.
Short Entry:
Trigger: Fires when a confirmed Bearish Setup is detected.
Usage: Use this to enter new Short positions.
🎯 Profit Taking (Target Levels)
Long TP:
Trigger: Fires when price hits the calculated Take Profit level for a Long trade.
Usage: Automate partial or full profit taking.
Short TP:
Trigger: Fires when price hits the calculated Take Profit level for a Short trade.
Usage: Automate partial or full profit taking.
🛡️ Defensive Exits (Risk Management)
Smart Exit:
Trigger: Fires when the system detects momentum decay or statistical exhaustion (even if the trend hasn't fully reversed).
Usage: Recommended for tightening stops or closing positions early to preserve gains.
Overbought / Oversold:
Trigger: Fires when the ribbon extends into extreme zones.
Usage: Warning signal to prepare for a potential reversal or pullback.
💡 Secondary Confirmation (Confluence)
SAR+MACD Bullish:
Trigger: Fires when Parabolic SAR and MACD align bullishly with the main trend.
Usage: Ideal for Pyramiding (adding to an existing winning position).
SAR+MACD Bearish:
Trigger: Fires when Parabolic SAR and MACD align bearishly.
Usage: Ideal for adding to short positions.
⚠️ Chapter 7: Conclusion & Risk Disclosure
Methodological Synthesis
Impulse Reactor represents a shift from reactive price tracking to proactive energy analysis. By decomposing market activity into its atomic components — Volatility, Momentum, and Structure — and reconstructing them into a coherent decision model, the system aims to provide a quantitative framework for market engagement. It is designed not to predict the future, but to identify high-probability conditions where kinetic energy and trend structure align.
Disclaimer & Risk Warnings
◦ Educational Purpose Only
This indicator, including all associated code, documentation, and visual outputs, is provided strictly for educational and informational purposes. It does not constitute financial advice, investment recommendations, or a solicitation to buy or sell any financial instruments.
◦ No Guarantee of Performance
Past performance is not indicative of future results. All metrics displayed on the dashboard (including "Win Rate" and "P&L") are theoretical calculations based on historical data. These figures do not account for real-world trading factors such as slippage, liquidity gaps, spread costs, or broker commissions.
◦ High-Risk Warning
Trading cryptocurrencies, futures, and leveraged financial products involves a substantial risk of loss. The use of leverage can amplify both gains and losses. Users acknowledge that they are solely responsible for their trading decisions and should conduct independent due diligence before executing any trades.
◦ Software Limitations
The software is provided "as is" without warranty. Users should be aware that market data feeds on analysis platforms may experience latency or outages, which can affect signal generation accuracy.
