Smart Money Setup 04 [TradingFinder] Three Drive (Harmonic) + OB🔵 Introduction
The "Three Drive" pattern is a well-known formation in technical analysis, recognized for its ability to signal potential trend reversals in price action. Within the realm of trading, particularly in the context of "Reversal Patterns," the Three Drive pattern holds significance as a reliable indicator of shifts in market sentiment.
🟣 Bullish 3 Drive
This pattern typically manifests at a price bottom, where a sequence of lower lows suggests a prevailing negative trend. However, within the structure of the Three Drive pattern, a notable occurrence unfolds.
The second low breaches the range of the first low, followed by the third low surpassing the range of the second low. These penetrations signify a diminishing selling pressure and an emerging buying interest.
Traders often await the confirmation of the third low surpassing the second low as an entry point, with price targets set at the highs formed within the Three Drive pattern.
🟣 Bearish 3 Drive
Conversely, the Bearish Three Drive pattern emerges at a price top, characterized by a sequence of higher highs indicating an upward trend. Yet, amidst this apparent bullish momentum, a shift occurs.
The second high breaks beyond the range of the first high, succeeded by the third high exceeding the range of the second high. These breaches signify a waning buying strength and a resurgence in selling pressure.
Entry into a trade is often executed after the confirmation of the third high surpassing the second high, with targets set at the lows formed within the Three Drive pattern.
Importance :
Understanding the Three Drive pattern's significance extends beyond mere technical analysis. It bears resemblance to other established patterns, such as the Harmonic Pattern and Ending Diagonal within the Elliott Wave Theory.
Recognizing these parallels aids traders in comprehending broader market dynamics and potential price movements.
🔵 Formation of 3 Drive in Order Block Zone
The convergence of the Three Drive pattern with the concept of the Order Block Zone introduces a nuanced layer to traders' analytical approach.
In "Price Action" methodology, Order Blocks represent areas on the price chart where significant market players, such as institutional traders, have executed notable orders.
These zones often act as barriers, with price encountering resistance or support upon reaching them.
When the Three Drive pattern forms within an Order Block Zone, it signifies a confluence of market dynamics.
The completion of the pattern within this zone suggests a potential reversal in the prevailing trend, augmented by the presence of significant institutional orders.
Traders incorporate these Order Blocks into their analysis to identify probable levels where price may change direction, enhancing the reliability of their trading decisions.
🔵 How to Use :
To effectively utilize the Three Drive pattern within the Order Block Zone, traders seek alignment between the completion of the pattern and the presence of significant Order Blocks.
This convergence enhances the reliability of the pattern's signals, increasing the likelihood of successful trade outcomes.
Bullish Three Drive in Demand Zone :
Bearish Three Drive in Supply Zone :
Settings :
You can set your desired "Pivot Period" via settings for the indicator to identify setups based on it.
Cari dalam skrip untuk "smart"

Smart SuperTrend v.1 [TradeMindsetAI]
✅ 🚀 Smart Super Trend v.1 🚀 is an advanced Pine Script indicator that combines real pivot points with ATR-based dynamic bands to create a highly responsive Super Trend system — but smarter, using a weighted Adaptive Pivot Center for adaptive trend detection.
✅ Key Features:
• Detects pivot highs/lows with customizable period
• Builds a dynamic Adaptive Pivot Center from confirmed pivots (weighted averaging)
• Calculates upper/lower bands using ATR × Factor for volatility adaptation
• Generates clean Buy/Sell signals on trend flips with optional labels
• Plots Support/Resistance from last pivot levels (optional)
• Optional Adaptive Pivot Center visualization for deeper trend insight
• Fully customizable: ATR period, factor, pivot sensitivity, visuals
✅ Ideal for scalpers, swing traders & algo developers across crypto, forex, stocks.
✅ Note: Works best after 50+ bars for pivot stabilization.
✅ Recommended Settings (Optimized & Tested):
`Pivot Point Period: 2` | `ATR Factor: 3.0` | `ATR Period: 10` → Best for 1H–4H (All Markets)
`Pivot Point Period: 3` | `ATR Factor: 3.0` | `ATR Period: 14` → Best for Daily & Long-Term Trends
`Pivot Point Period: 1` | `ATR Factor: 2.5` | `ATR Period: 10` → Best for 15M & Scalping
🎯 Built for traders who want SuperTrend + Pivot Intelligence = Unbreakable Edge.
⭐ Like & Follow for more elite tools!
#supertrend #pivot #atr #trendfollowing #crypto #forex #tradingview
✅ اندیکاتور 🚀 Smart SuperTrend v.1 🚀 با ترکیب پیوتهای واقعی و باندهای دینامیک ATR، یک سوپرترند هوشمند و تطبیقپذیر ارائه میدهد — اما با یک خط مرکزی تطبیقی پیوت
(Adaptive Pivot Center) برای تشخیص روند دقیقتر.
✅ ویژگیهای کلیدی:
• شناسایی پیوتهای کف و سقف با دوره قابل تنظیم
• ساخت خط مرکزی تطبیقی پیوت بر اساس پیوتهای تأییدشده (میانگین وزنی)
• محاسبه باندهای بالا / پایین با ATR × ضریب برای تطبیق با نوسانات
• تولید سیگنالهای خرید / فروش تمیز در لحظه تغییر روند + برچسب اختیاری
• نمایش سطوح حمایت / مقاومت از آخرین پیوتها (اختیاری)
• نمایش خط مرکزی تطبیقی پیوت برای تحلیل عمیقتر روند (اختیاری)
• کاملاً قابل تنظیم: دوره ATR، ضریب، حساسیت پیوت، ظاهر
✅ مناسب برای اسکالپرها، سوئینگ تریدرها و توسعهدهندگان الگو در کریپتو، فارکس، سهام.
✅ نکته: پس از ۵۰ کندل برای تثبیت پیوتها بهترین عملکرد را دارد.
✅ تنظیمات پیشنهادی بهینه (تستشده):
`Pivot Point Period: 2` | `ATR Factor: 3.0` | `ATR Period: 10` → مناسب برای 1 و 4 ساعته (تمام بازارها)
`Pivot Point Period: 3` | `ATR Factor: 3.0` | `ATR Period: 14` → مناسب رای روند روزانه و بلندمدت
`Pivot Point Period: 1` | `ATR Factor: 2.5` | `ATR Period: 10` → مناسب برای ۱۵ دقیقه و اسکالپینگ
🎯 برای معاملهگرانی که سوپرترند + پیوت هوشمند = برتری غیرقابل شکست میخواهند.
⭐ لایک و فالو کنید تا ابزارهای حرفهای بیشتری ببینید!
#سوپرترند #پیوت #ای_تی_آر #دنبال_روند #کریپتو #فارکس #تریدینگ_ویو

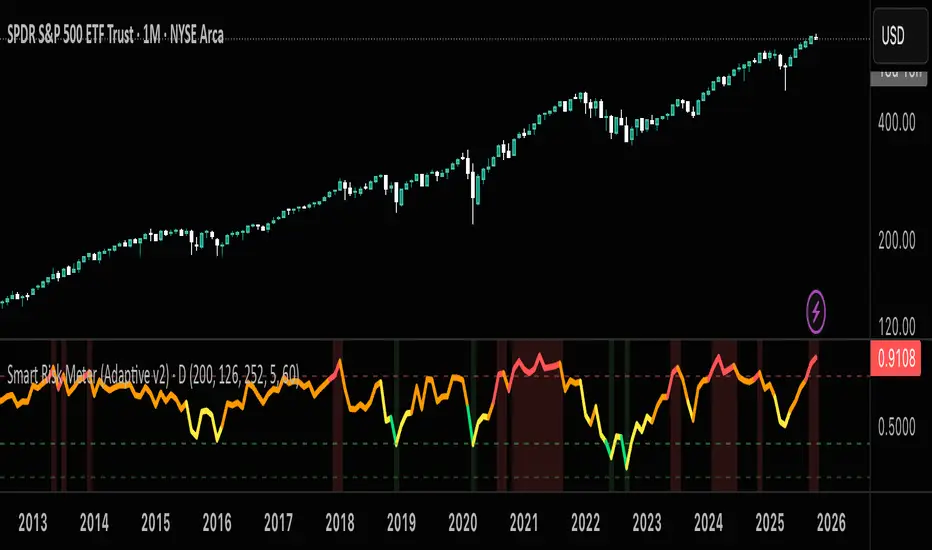
Smart Risk DCA Meter — Adaptive Market Risk EngineThe **Smart Risk DCA Meter** is an adaptive market-risk indicator that helps you invest smarter by scaling your DCA buys based on actual market conditions instead of emotion. It combines momentum, distance from trend, and drawdown factors into a single 0–1 risk score that automatically adjusts to each asset’s volatility — from stable indices like SPX to high-beta assets like BTC. Low readings (green zones) signal opportunity to buy heavier, while high readings (red zones) warn to slow down and protect capital.
SmartMoney BOS Pro [Stansbooth]
## ✨ BOS + ICT RSI Indicator — Trade Like Smart Money ✨
The market doesn’t move randomly — it moves with **structure**, **liquidity**, and **institutional intent**.
This indicator is built to help you see exactly that.
Powered by **Break of Structure (BOS)** and advanced **ICT concepts**, this tool highlights when the market is truly shifting direction or continuing with strength — the same way **smart money** trades.
To make every setup even stronger, a **smart RSI confirmation** is seamlessly integrated, helping you stay out of weak trades and focus only on **high-quality, high-probability opportunities**.
### 🔥
What Makes It Special?
• Clear and accurate BOS signals
• ICT-based market structure & liquidity insight
• RSI confirmation to reduce false entries
• Clean visuals — no clutter, no confusion
• Designed for scalpers, intraday & swing traders
🎯
Who Is This For?
If you’re tired of lagging indicators…
If you want to understand **why** price moves…
If you want to trade with confidence instead of guessing…
This indicator is for you.
📊
Markets Supported:
Forex • Crypto • Stocks • Indices
Stop chasing price.
Start trading ** structure, liquidity, and smart money**.
🚀 **See the market differently. Trade better.**
Smart Box Breakout Pro - Swing & ORB System🎯 **SMART BOX BREAKOUT PRO - Professional Trading System**
**Two Powerful Modes in ONE Indicator:**
✅ **SWING BOX MODE** - Automatic consolidation detection based on swing highs/lows
✅ **ORB MODE** - Opening Range Breakout for professional day trading
Stop manually drawing boxes and missing breakouts! This indicator does it ALL automatically.
━━━━━━━━━━━━━━━━━━━━━━━━━━━━━━━━━━━━━━━━━━━
## 🔥 **WHY THIS INDICATOR IS DIFFERENT**
### **1️⃣ SWING BOX MODE** (For All Timeframes)
- Automatically detects swing-based consolidation zones
- Draws perfect boxes around price consolidation
- Identifies breakouts with precision
- Works on ANY timeframe (M5 to Daily)
- Perfect for swing traders and position traders
### **2️⃣ ORB MODE** (For Day Traders) ⭐ UNIQUE FEATURE
- **Opening Range Breakout** system built-in
- Set custom time range (e.g., 09:30-10:00 for first 30 min)
- Works with multiple timezones (NY, London, Tokyo, Chicago)
- Daily auto-reset
- Professional day trading tool
### **3️⃣ 5-STAR SIGNAL QUALITY SYSTEM** 🌟
Every signal is rated 1-5 stars based on:
- ⭐ Box tightness (smaller = better)
- ⭐ Volume confirmation
- ⭐ HTF trend alignment
- ⭐ Clean breakout (no wicks back)
- ⭐ Momentum strength
**Only trade 4-5 star setups for highest probability!**
### **4️⃣ HIGHER TIMEFRAME FILTER**
- Optional HTF trend filter
- Only LONG signals in HTF uptrend
- Only SHORT signals in HTF downtrend
- Significantly improves win rate
### **5️⃣ AUTOMATIC TP/SL CALCULATION**
- Take Profit levels auto-calculated
- Stop Loss based on box structure
- Adjustable percentages
- Visual TP/SL lines on chart
### **6️⃣ PROFESSIONAL DASHBOARD**
- Live signal status
- Active box info
- Signal quality rating
- HTF trend direction
- Current TP/SL levels
━━━━━━━━━━━━━━━━━━━━━━━━━━━━━━━━━━━━━━━━━━━
## 📊 **HOW IT WORKS**
### **SWING BOX MODE:**
1. **Detection**: Indicator finds swing highs and swing lows
2. **Box Formation**: Draws box around consolidation (4 swing points)
3. **Breakout Wait**: Monitors price for breakout
4. **Signal**: When price closes above/below box → SIGNAL
5. **Quality Rating**: Shows 1-5 stars for signal quality
6. **Auto TP/SL**: Displays take profit and stop loss levels
**Perfect for:** Swing trading, position trading, all timeframes
### **ORB MODE (Opening Range Breakout):**
1. **Time Range**: You set the opening range time (e.g., 09:30-10:00)
2. **Range Formation**: Box forms during this time (tracks high/low)
3. **Range Complete**: After time ends, box is complete
4. **Breakout Wait**: Price must break above or below opening range
5. **Signal**: Breakout = entry signal with quality rating
6. **Auto TP/SL**: Professional risk management built-in
**Perfect for:** Day trading stocks, forex, crypto, futures
━━━━━━━━━━━━━━━━━━━━━━━━━━━━━━━━━━━━━━━━━━━━━
## ⚙️ **FEATURES & SETTINGS**
### **Mode Selection:**
- Toggle between Swing Box and ORB mode
- Each mode optimized for different trading styles
### **Swing Box Settings:**
- Swing Length (sensitivity)
- Min distance between boxes
- Max box width (filters out large ranges)
### **ORB Settings:**
- Custom time range (any hours you want)
- Timezone selection (NY, London, Tokyo, Chicago)
- Daily reset option
- Extend box right option
### **Trading Settings:**
- Take Profit % (adjustable)
- Stop Loss offset % (adjustable)
- Minimum signal quality filter (1-5 stars)
### **HTF Filter:**
- Enable/disable higher timeframe trend filter
- Select HTF timeframe
- EMA period for trend determination
### **Visual Customization:**
- Show/hide swing points
- Show/hide TP/SL lines
- Show/hide dashboard
- Custom colors for all elements
- Adjustable line lengths
━━━━━━━━━━━━━━━━━━━━━━━━━━━━━━━━━━━━━━━━━━━
## 🎯 **BEST USE CASES**
### **Swing Box Mode:**
✅ Forex pairs (any timeframe H1-Daily)
✅ Stock swing trading (H4-Daily)
✅ Crypto swing trading (H1-H4)
✅ Index trading (H4-Daily)
✅ Commodity swing trades
### **ORB Mode:**
✅ US Stock day trading (09:30-10:00 EST opening range)
✅ Forex day trading (London open 08:00 GMT)
✅ Crypto day trading (any session)
✅ Futures day trading (08:30-09:00 EST)
✅ Gold/Silver day trading
━━━━━━━━━━━━━━━━━━━━━━━━━━━━━━━━━━━━━━━━━━━
## 📈 **RECOMMENDED SETTINGS**
### **For Forex (Swing Box Mode):**
- Timeframe: H1 or H4
- Swing Length: 5
- Min Signal Quality: 3 stars
- HTF Filter: ON (use H4 or Daily)
### **For Stock Day Trading (ORB Mode):**
- Timeframe: 5min or 15min
- ORB Time: 0930-1000 (EST)
- Timezone: America/New_York
- Min Signal Quality: 4 stars
- HTF Filter: OFF
### **For Crypto (Swing Box Mode):**
- Timeframe: H1 or H4
- Swing Length: 5-7
- Min Signal Quality: 3 stars
- HTF Filter: ON (use H4)
### **For Index Trading (Swing Box Mode):**
- Timeframe: H4 or Daily
- Swing Length: 5
- Min Signal Quality: 4 stars
- HTF Filter: ON (use Daily)
━━━━━━━━━━━━━━━━━━━━━━━━━━━━━━━━━━━━━━━━━━━━━
## 🔔 **ALERTS**
The indicator includes 4 alert types:
1. **🚀 LONG Breakout** - Any long signal
2. **💥 SHORT Breakout** - Any short signal
3. **⭐ 5-STAR LONG** - Perfect 5-star long setup
4. **⭐ 5-STAR SHORT** - Perfect 5-star short setup
**Alert Message Format:**
🚀 LONG BREAKOUT (swing) | Quality: 4/5 | Entry: 1.2345 | TP: 1.2363 | SL: 1.2295
**How to Set Alerts:**
1. Click "Create Alert" button
2. Select alert condition (e.g., "🚀 LONG Breakout")
3. Set alert frequency: "Once Per Bar Close"
4. Name your alert
5. Done! You'll get notified of every signal
━━━━━━━━━━━━━━━━━━━━━━━━━━━━━━━━━━━━━━━━━━━
## 💡 **TRADING TIPS & BEST PRACTICES**
### **✅ DO:**
- Wait for bar close before entering (no repainting!)
- Focus on 4-5 star signals for best results
- Use HTF filter in trending markets
- Respect the auto TP/SL levels
- Trade during high volume sessions
- Use proper position sizing
### **❌ DON'T:**
- Enter before bar close (wait for confirmation)
- Ignore the quality rating (stars matter!)
- Trade against strong HTF trend without filter off
- Move stops closer than indicator suggests
- Overtrade - quality over quantity
- Risk more than 1-2% per trade
### **🎯 PRO TIPS:**
**For Swing Box Mode:**
- Best on trending pairs/stocks
- H1/H4 timeframes work best
- Combine with major support/resistance
- Wait for 4+ star signals in choppy markets
**For ORB Mode:**
- Best on volatile stocks/pairs
- First hour usually defines the day
- Higher volume = better breakouts
- Avoid on low volume days (holidays)
- 5-star ORB breakouts are gold!
━━━━━━━━━━━━━━━━━━━━━━━━━━━━━━━━━━━━━━━━━━━━━
## ❓ **FREQUENTLY ASKED QUESTIONS**
**Q: Does this indicator repaint?**
A: NO! All signals appear on bar close and never disappear or change.
**Q: Can I use this on any market?**
A: YES! Works on Forex, Stocks, Crypto, Futures, Indices, Commodities.
**Q: What's the difference between the two modes?**
A: Swing Box = auto-detects consolidation (any timeframe). ORB = opening range breakout (day trading specific time).
**Q: How accurate are the signals?**
A: Focus on 4-5 star signals with HTF filter for 60-70% win rate potential. Lower star signals = lower probability.
**Q: Can I customize the TP/SL percentages?**
A: YES! Fully adjustable in settings.
**Q: What timeframe works best?**
A: Swing Box: H1-Daily | ORB: M5-M15 (for day trading)
**Q: Do I need to watch the chart all day?**
A: NO! Set up alerts and the indicator notifies you of breakouts.
**Q: Can I backtest this?**
A: YES! All signals are visible on historical bars. Test it yourself on demo first.
**Q: Is the HTF filter necessary?**
A: Optional but recommended in trending markets. Improves win rate significantly.
**Q: How do I set up ORB for US stock trading?**
A: Mode: "ORB", Time: "0930-1000", Timezone: "America/New_York", Timeframe: M5 or M15
━━━━━━━━━━━━━━━━━━━━━━━━━━━━━━━━━━━━━━━━━━━
## 🎓 **WHAT YOU'LL LEARN**
Using this indicator teaches you:
- How to identify consolidation zones
- When breakouts are most likely to succeed
- Quality over quantity in trading
- Importance of HTF trend context
- Professional risk management (TP/SL)
- Opening Range Breakout strategy
- Box breakout methodology
━━━━━━━━━━━━━━━━━━━━━━━━━━━━━━━━━━━━━━━━━━━━━
## 🚀 **WHY TRADERS LOVE THIS INDICATOR**
✅ **Two Systems in One** - Swing Box + ORB = Amazing value
✅ **Quality Rating** - Know which signals to focus on
✅ **No Repainting** - 100% reliable, signals never change
✅ **Auto TP/SL** - Risk management handled for you
✅ **HTF Filter** - Trade with the trend for higher win rate
✅ **Professional Dashboard** - All info at a glance
✅ **Works Everywhere** - Any market, any timeframe
✅ **Clean Design** - Not cluttered, easy to read
✅ **Full Alerts** - Never miss a setup
✅ **Beginner Friendly** - Easy to understand and use
━━━━━━━━━━━━━━━━━━━━━━━━━━━━━━━━━━━━━━━━━━━
## 📊 **TECHNICAL DETAILS**
**Swing Box Detection:**
- Uses pivot high/low logic
- Pattern recognition (4 swing points)
- Filters based on box width and spacing
- Dynamic box sizing
**ORB Detection:**
- Session-based time filtering
- High/low tracking during specified range
- Automatic daily reset
- Timezone-aware calculations
**Signal Quality Algorithm:**
Evaluates 5 factors:
1. Box size (tightness)
2. Volume confirmation
3. HTF trend alignment
4. Breakout cleanliness
5. Momentum strength
**No Repainting:**
- All logic confirmed on bar close
- Variables properly managed with var keyword
- Historical consistency guaranteed
━━━━━━━━━━━━━━━━━━━━━━━━━━━━━━━━━━━━━━━━━━━
## 🎁 **BONUS FEATURES**
- Visual swing point markers (toggle on/off)
- Connection lines showing box formation
- Box extends right for easy viewing
- Color-coded signals (green=long, red=short)
- Quality stars on every signal
- Dashboard shows real-time info
- Multiple timezone support
- Fully customizable colors
━━━━━━━━━━━━━━━━━━━━━━━━━━━━━━━━━━━━━━━━━━━
## 🏆 **PERFECT FOR:**
👉 Day Traders using ORB strategy
👉 Swing Traders looking for breakouts
👉 Forex Traders on H1/H4
👉 Stock Traders (intraday and swing)
👉 Crypto Traders 24/7
👉 Futures Traders
👉 Beginners learning breakout trading
👉 Experienced traders wanting automation
━━━━━━━━━━━━━━━━━━━━━━━━━━━━━━━━━━━━━━━━━━━
## 📖 **STRATEGY GUIDE**
### **Conservative Approach:**
- Only trade 5-star signals
- Use HTF filter ON
- Trade only in direction of HTF trend
- Smaller position sizes
- **Expected Win Rate: 65-75%**
### **Balanced Approach:**
- Trade 4-5 star signals
- Use HTF filter ON
- Respect TP/SL levels
- Standard position sizing
- **Expected Win Rate: 55-65%**
### **Aggressive Approach:**
- Trade 3+ star signals
- HTF filter optional
- Both directions
- Manage trades actively
- **Expected Win Rate: 50-60%**
━━━━━━━━━━━━━━━━━━━━━━━━━━━━━━━━━━━━━━━━━━━
## 💎 **UPGRADE YOUR TRADING TODAY**
Stop missing breakouts. Stop drawing boxes manually. Stop guessing which setups are best.
**Let Smart Box Breakout Pro do the heavy lifting!**
✅ Add to your charts now (it's FREE!)
✅ Set up your alerts
✅ Start catching high-quality breakouts
✅ Trade with confidence
━━━━━━━━━━━━━━━━━━━━━━━━━━━━━━━━━━━━━━━━━━━
## 📞 **SUPPORT & UPDATES**
Questions? Suggestions? Found it useful?
- Drop a comment below
- Follow for updates and new indicators
- Check out my other professional tools
**Created by ThePipsMaker - Professional Trading Indicators**
━━━━━━━━━━━━━━━━━━━━━━━━━━━━━━━━━━━━━━━━━━━
## ⚠️ **DISCLAIMER**
This indicator is for educational purposes. Trading involves risk. Past performance does not guarantee future results. Always practice proper risk management and never risk more than you can afford to lose. Test on demo account first.
━━━━━━━━━━━━━━━━━━━━━━━━━━━━━━━━━━━━━━━━━━━
**📊 Smart Box Breakout Pro - Your Edge in the Markets! 🎯**
**#BoxBreakout #ORB #OpeningRange #SwingTrading #DayTrading #ForexIndicator #TradingViewIndicator #Breakout #SmartMoney**

SmartPhase Analyzer📝 SmartPhase Analyzer – Composite Market Regime Classifier
SmartPhase Analyzer is an adaptive regime classification tool that scores market conditions using a customizable set of statistical indicators. It blends multiple normalized metrics into a composite score, which is dynamically evaluated against rolling statistical thresholds to determine the current market regime.
✅ Features:
Composite score calculated from 13+ toggleable statistical indicators:
Sharpe, Sortino, Omega, Alpha, Beta, CV, R², Entropy, Drawdown, Z-Score, PLF, SRI, and Momentum Rank
Uses dynamic thresholds (mean ± std deviation) to classify regime states:
🟢 BULL – Strongly bullish
🟩 ACCUM – Mildly bullish
⚪ NEUTRAL – Sideways
🟧 DISTRIB – Mildly bearish
🔴 BEAR – Strongly bearish
Color-coded histogram for composite score clarity
Real-time regime label plotted on chart
Benchmark-aware metrics (Alpha, Beta, etc.)
Modular design using the StatMetrics library by RWCS_LTD
🧠 How to Use:
Enable/disable metrics in the settings panel to customize your composite model
Use the composite histogram and regime background for discretionary or systematic analysis
⚠️ Disclaimer:
This indicator is for educational and informational purposes only. It does not constitute financial advice or a trading recommendation. Always consult your financial advisor before making investment decisions.

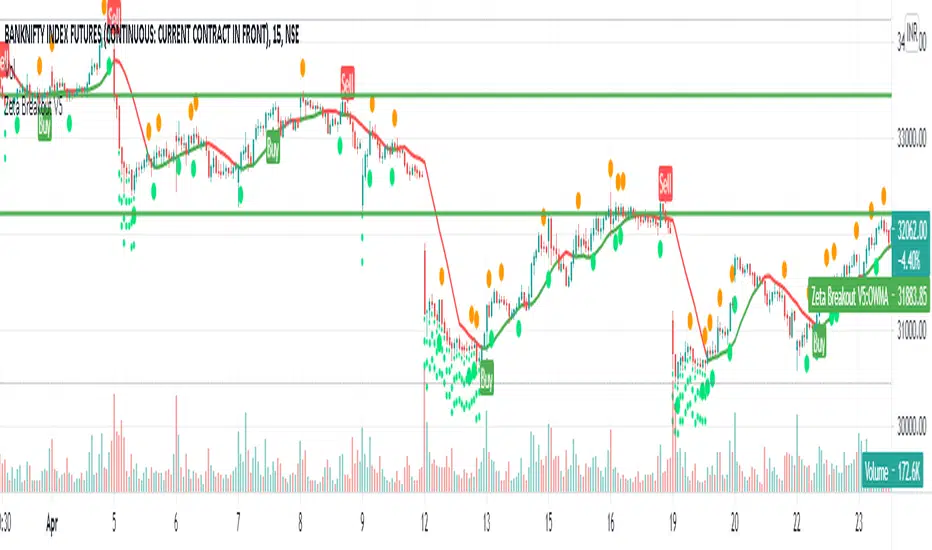
Zeta BreakoutIf I ask you what moves the price, most of you will say the same old answer: Demand & Supply
But who creates Demand & Supply? You or Me, the retailers? No. It is Big Institutions and Mutual Funds and Big Banks which create this demand and supply because the
share of retailers in Stock Market is so little it does not affect the price in a big way.
The Big Institutions, Mutual Funds, Big Banks or in some cases Governments, are collectively called Smart Money.
When Smart Money steps in, the previous levels of Support or Resistance are broken and then the up or down move starts which most probably goes a certain distance.
Now the Support or Resistance levels are not static, they are dynamic in nature and keep changing with the time.
How does this indicator work?
Zeta Breakout dynamically and automatically detects and marks these levels and when the price break-outs or break-downs or bounces up or down from these levels, the Buy or Sell Signals are generated for you to follow.
The indicator keeps watching previous or newly created levels of Support or Resistance and as soon as price crosses these levels or bounces from these levels, the user is alerted in the form of 'Buy' or 'Sell' Signals.
How to use this indicator?
1. When you see a Buy Signal, take Buy Position and hold it till either (a) You see opposite signal or (b) Your Stop Loss is hit which is ideally the low of candle preceding the signal candle or any other user defined SL. If your stop loss is hit and then price again starts moving in the same direction as indicated by the last Buy signal, take a fresh position as soon as the price crosses the level where previous signal is sitting.
2. When you see a Sell Signal, close your Buy Position, take a Sell position and hold it till either (a) You see opposite signal or (b) Your Stop Loss is hit which is ideally the high of candle preceding the signal candle or any user defined SL. If your stop loss is hit and then price again starts moving in the same direction as indicated by the last Sell signal, take a fresh position as soon as the price crosses the level where previous signal is sitting.
What are the target instruments/markets for this indicator?
This indicator can be used on Stocks, Indices, Gold , Silver , Currency Pairs, Crude Oil or anything being trades on any exchange in the world.
This indicator is not limited to any specific time-frame. You may select any time-frame which suits your trading style.
How can you get this indicator?
This is an invite-only paid indicator but we can give you FREE TRIAL for 05 days if you are interested.
For Free Trial, send a message to @jellygill
Smart Money COTThis indicator implements the method of analysing COT data as defined by Michael Huddleston (I.E. The Inner Circle Trader). It removes all superfluous information contained in the standard COT reports and focusses only on Commercial speculators using the overall Long-Short positions.
Features
The unique feature of this indicator is its ability to look back over time and provide the following information:
Calculation of the range high and low of the specified lookback range.
Calculation of equilibrium of that range.
Automatic colour coding of net long and net short positions when the Long-Short COT calculation is above or below equilibrium of the lookback range.
Instructions
Use the Daily Timeframe only. You may get unexpected results on other timeframes.
Ensure the asset has COT data available. Script is mainly focused on commodity futures, such as ES, NQ, YM. It has not been tested against Forex.
You will need to define the "Lookback" setting in the script settings. Use the total number of trading days required for your analysis. E.g. if you want a 6 month COT analysis, use the measurement tool to count the quantity of daily candles between now and 6 months ago - use this as your Lookback setting. Adjust as needed for other lookback periods, e.g. 3 months, 12 months etc.
Other Info
The script provides the ability to customise colours in its settings.
Range High and Range Low plots can be disabled in settings.

STIC bullish and bearish hunter with FVGSmart Trading and Investment Companion (STIC) is a sophisticated tool designed to identify and visualize inducement, market structure, market trends, track liquidity, and project and forecast price action for all applicable assets. it has been tested to work on all timeframes and has been traded on stock, forex, and crypto assets.
This script is an upgraded version of previous STIC indicator, which you can use in addition to it or separately as you deem fit
Traders/ investor that are familiar with market structure, inducement, candlestick psychology, trend-following indicatorsand Fair Value Gap FVG will find it easy to adopt this trading and investment companion. As stated below, this is how it works.
Features and how to use
1st of all, after adding the indicator to yoursuperchart, you want to endusre to set your to so as to enable you see the text labeling clearly. to do that, after adding the indicator to your chart, right click it on the list, you will se the Visual order option.
Special Extreme Alert!
By analyzing the trends and dimensions, we are able to predict market extremes conditions, especially in pump and dump scenarios. (the bullish or bearish P/D extreme alerts).
Market flip arrow
The arrows trigger to indicate when the market flips to bullish (green) or bearish (red) conditions. note that this arrow is just a market flip confirmation and it it triggered by market trends, it does not come one time and sometimes later after market trigger conditions had been met.
circled in white.
Buy or sell potential {The tiny yelow(sell) and blue(buy) triangle}
By analyzing market extreme conditions, market sentiment, and liquidity, the buy/sell potential alert trigger is able to determine the state of the market, This can and should be used in combination with the market flip line (MFL) [the yellow line from , market flip trigger (MFT) (purple line), and market support/resistance line (MSR)(blue line) .
Market flip Line (Blue line) (MFL): the MFL is useful to also understand the market phase; a candle close above the MFL is bullish, while a candle close Below, the MFL is bearish. You are, however, expected to experience market retests and rejections coupled with support and resistance to follow through with the predicted direction. Patience is a valuable virtue in trading.
Extended sell or buy hunt (Red and Green Triangle)
this is real-time triangles indicator just like every other indicator on theis chart that indicates the market direction labeled with buy and sell. Note that the market-extended extreme can occur multiple times in the same direction. Hence, we'll advise having multiple trade entries.
The flip support line
Market Flip Trigger Line (MFTL) (Magenta): When the market crosses and closes below or above the Market Flip Trigger Line, you should wait for a confirmation. a confirmation is usually a retest or rejection of the line. A candle close and reject indicates the market as flip direction and it is going for a correction or major reversal. it is applicable on all timeframe.
As mentioned earlier, if you understand market structure and sentiment, using the uFVG, iFVG, upLQTY, downLQTY and BOS will be easy. however, this is how it works, you may need tohave and expanded readbout market structure for additional knowledge.
upLQTY (Bullish liquidity inducement)
The indicator appear at the close and confirmation on the 3rd candle and it is extended to only appear on 200 bars applicable on all timeframes.
This is a bullish sentiment and liquidty inducement order block that occurs, leading to the break of trend structure and change of character. Meaning the market sentiment as change which is backed up by liquidity in that region, which mostly gets filled, especially on lower timeframes before the price action continues. If price revese breaks and hold above this region, it invalidates the order block. This will always appear when there is a confirmed change of character CHoCH to the bullish side.
downLQTY (Bearish liquidity inducement) The indicator appear at the close and confirmation on the 3rd candle and it is extended to only appear on 200 bars applicable on all timeframes. It is and inverse of the upLQTY.
like order block, these are supply and demand zones that has the potential to change the direction of a trade. This is a bearish order block that occurs, leading to the break of structure and change of character. Meaning there is bearish liquidity yet to be accounted for in the region, which mostly gets filled, especially on lower timeframes before the price action continues. If broken, it invalidates the order block. This will always appear when there is a confirmed change of character from CHoCH to the bearish side.
Fair Value Gap
From general knowledge, FVG also know as Fair value gaps are inbalnace created by a 3 candlestick pattern where the top of the bottom candles doesn't cross the bottom of the top candle. like order block, these are supply and demand zones that has the potential to change the direction of a trade. This mostly indicate the presense of big plays in the market. for STIC indicator, FVG are labeled as listed below;
UFVG, also FVGup, {Colour green box} = bullish imbalance fair value gap
IFVG, aka FVGdown, {Red box} = bearish imbalance fair value gap
OIFVG, {Yellow box, no label} = other imbalances fair value gab
You should not that FG has upper, lower and middle band, any of the this area can be induced and filled by price.
Alert Conditions!
Buy alert conditions
- Any bullish buy alert
- Bullish hunt
- Re-entry Buy
- Sharp Market Sell rejection
- Buy potential
- upLQTY
Long position Exit conditions
- ExtremeB
- Profit
- Sell hunt
The Entry, exit and trail profit alert trigger should be used as position exit conditions either for a Long (Buy) or Short (Sell) situation and should be set as OPB (Once Per Bar). Using it as entry for exit or vice versa as shown not to be very profitable. hence the need to combine with other order entry alerts like the Any bullish or Bearish alerts
Sell alert conditions ( NOTE: All Sell alert are not yet included in this current version as this is targeted towards bullrun.)
- Sell potential
- Sell triangle (Sell hunt)
- downLQTY
and any trail profit alert, this alert put into consideration all the conditions required to trail profit.
Risk management advice
Patience and a good risk management strategy are required to be profitable trader using this tool. You need to ensure not to overleverage, and you should have multiple entries in case the buy coditions/alert shows again below the previous buy alert before a sell condition/alert occurs.

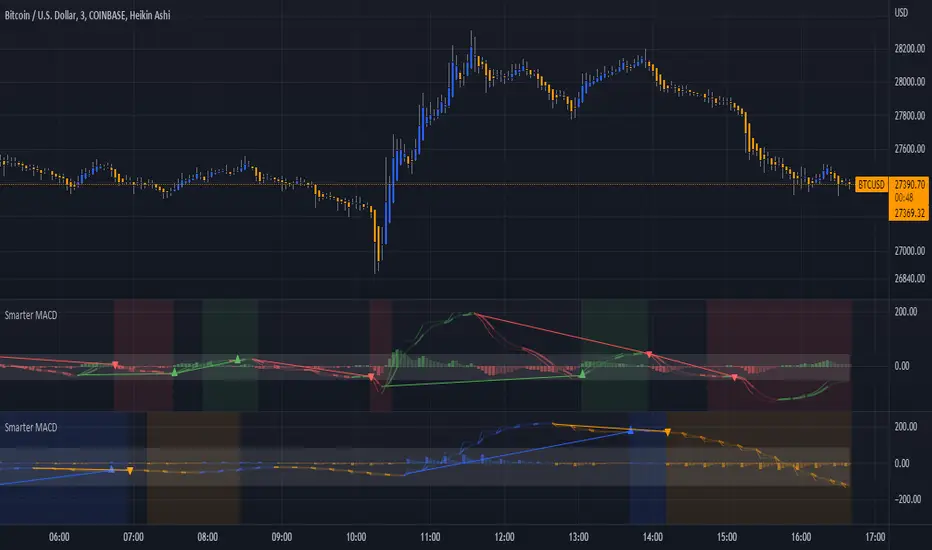
Smarter MACDA classic MACD with average peak and dip lines. The lighter green and red horizontal lines are the average peak and dip of the entire span, respectively. The second, bolder of the two lines are the averages of the peaks and dips above and below the overall peak and dip averages. The filled in color is to help visualize these averages and possible trade setups. Rework of the MACD + Averages script.
Smarter Pullback + Candlestick Pattern (Steven Hart)Built with love "Smarter Pullback + Candlestick Pattern"
This indiator will help you to find a Pullback + Candlestick Pattern, inspirated by Steven Hart
You can combine with your own strategy, or use this purely
DISCLAIMER :
Measure the risk first before use it in real market
Backtest The Strategy was very important, so you know the probability
Fundamentally Logical :
Pullback (Some Previous candle is Red for Bull Pullback vice versa)
the Entry candle must be a Candlestick Pattern
Features :
1. Engulfing
2. Hammer & Shooting Star
3. Doji
How to use it :
1. Adjust the Pullback Period
2. Check and Uncheck the Pattern you want to see
3. Adjust the style to your favourite
Regards,
Hanabil

Smarter SNR (Support and Ressistance, Trendline, MTF OSC)Built with love "Smarter SNR (Support and Ressistance, Trendline, MTF OSC) "
This indiator will show you Support & Ressistance, Good Trendline, and Multi-timeframe analyzing of Oscillator (Stochastic and RSI)
You can combine with your own strategy, or use this purely
DISCLAIMER :
Measure the risk first before use it in real market
Backtest The Strategy was very important, so you know the probability
Fundamentally Logical :
SNR -> Last 3 Zigzag Pivot
Trendline -> Using two last pivot for calculating the slope
Features :
1. SNR
2. Trendline
3. MTF Oscillator Analyzing
How to use it :
1. All Label, Table & Line can be turned on/off in settings
2. Pivot Period can be Adjusted in settings
3. All Label, Table & Line style can be adjusted in settings
Regards,
Hanabil

Smart Money ChecklistJust a basic info panel I made to remind me of my trading strategy.
I couldn't find a script close enough to what I wanted so I made this.
Be free to tweak it to your needs.

SMT-MTF-GRIDSmart Money Tracker - Multi Time Frame
Instructions to combine multiple instance of the indicator to form a larger grid
gifyu.com

Smart Divergence Engine [ChartNation]SMART DIVERGENCE ENGINE — REPAINTING-PROOF RSI DIVERGENCE WITH EXHAUSTION CONFIRMATION
═══════════════════════════════════════════
Smart Divergence Engine solves three critical problems that plague free RSI divergence indicators:
PROBLEM 1: REPAINTING DIVERGENCES
Most divergence scripts detect divergence in real-time as bars form. This causes signals to appear, disappear, and reappear unpredictably—making them unusable for alerts or systematic trading.
OUR SOLUTION: Pivot-Locked Detection
Smart Divergence Engine evaluates RSI at the exact bar where price structure confirms (rsi ), not at the current bar. Once a divergence prints, it NEVER disappears. This is implemented via:
Full swing confirmation (Pivot Left + Pivot Right bars must complete)
RSI evaluation at historical bar: rsi , not rsi
Divergence triggers AFTER structure lock, not during formation
Technical implementation: The script stores RSI values at confirmed pivot bars using var floats (lowRsiPrev, lowRsiCurr, highRsiPrev, highRsiCurr), then compares these locked values when new pivots confirm. This prevents any possibility of historical repaint.
PROBLEM 2: FALSE POSITIVE OVERLOAD
Divergence scripts trigger on ANY price-RSI mismatch, flooding charts with weak signals during choppy conditions. No filtering means traders must manually screen out noise.
OUR SOLUTION: Shark Fin Exhaustion Filter
Before any divergence can be considered actionable, Smart Divergence Engine requires RSI to demonstrate genuine momentum exhaustion through our proprietary "Shark Fin" detection:
Shark Fin Logic (Not Found in Free Scripts):
RSI must pierce the outer volatility band by a configurable buffer (default 1.5 RSI points)
RSI must re-enter the band with directional confirmation (positive slope for bullish, negative slope for bearish)
Band width must exceed minimum standard deviation threshold (volatility qualification)
Cooldown period enforced (default 25 bars) to prevent signal clustering
This multi-condition filter dramatically reduces false divergences by requiring RSI to physically demonstrate exhaustion BEFORE structure confirmation matters.
Technical implementation: The Shark Fin state machine uses boolean flags (bullFinForming, bearFinForming) to track when RSI is stretched beyond bands, then validates re-entry using ta.crossover(rsi, lower) / ta.crossunder(rsi, upper) with slope checks (ta.change(rsi) > 0 / < 0) and volatility gates (dev >= finMinDev).
PROBLEM 3: NO VOLATILITY CONTEXT
Divergence scripts use fixed RSI levels (30/70 or similar) that fail to adapt to changing market conditions. What's "overbought" in a low-volatility regime differs drastically from high-volatility conditions.
OUR SOLUTION: Adaptive Volatility Bands
Smart Divergence Engine calculates dynamic overbought/oversold zones using:
34-period SMA of RSI as basis
1.618 standard deviation multiplier (golden ratio expansion)
Real-time band expansion/contraction based on RSI volatility
The bands provide three advantages:
Shark Fin events only qualify when RSI breaches ADAPTIVE thresholds, not arbitrary fixed levels
Band width (standard deviation) serves as volatility filter—narrow bands = low conviction moves get rejected
50-line midline provides regime context (above 50 = bullish bias, below 50 = bearish bias)
Technical implementation: basis = ta.sma(rsi, 34), dev = ta.stdev(rsi, 34), upper/lower = basis ± dev * 1.618. Shark Fin logic requires rsi < (lower - finBuffer) or rsi > (upper + finBuffer) to trigger, ensuring exhaustion is measured relative to CURRENT volatility, not historical constants.
═══════════════════════════════════════════
METHODOLOGY COMPARISON VS FREE ALTERNATIVES
═══════════════════════════════════════════
STANDARD DIVERGENCE SCRIPTS:
Detection timing: Real-time (current bar)
Historical stability: Repaints continuously
Signal filtering: None or minimal
Volatility adaptation: Fixed levels (30/70)
Exhaustion confirmation: Not implemented
Confirmation layers: 1 (divergence only)
Alert reliability: Unreliable (signals disappear)
SMART DIVERGENCE ENGINE:
Detection timing: Pivot-confirmed (rsi )
Historical stability: Locked at structure bar
Signal filtering: Shark Fin + cooldown + stdev gate
Volatility adaptation: Dynamic bands (34-SMA + 1.618σ)
Exhaustion confirmation: Required via Shark Fin
Confirmation layers: 3 (structure + exhaustion + volatility)
Alert reliability: Stable (never repaints)
═══════════════════════════════════════════
TECHNICAL SPECIFICATIONS
═══════════════════════════════════════════
RSI ENGINE:
Base calculation: ta.rsi(src, 14)
Smoothing: ta.rma(rsiRaw, 2) — reduces whipsaw noise
Source: Configurable (default close)
VOLATILITY BANDS:
Basis: 34-period SMA of RSI
Multiplier: 1.618 (golden ratio)
Upper band: basis + (stdev * 1.618)
Lower band: basis - (stdev * 1.618)
Purpose: Creates adaptive overbought/oversold zones
DIVERGENCE DETECTION:
Pivot confirmation: 10 left bars + 10 right bars (default)
RSI evaluation: Locked at rsi (historical bar, never current)
Bullish divergence: price lower low + RSI higher low
Bearish divergence: price higher high + RSI lower high
Rendering: Lines drawn between last two confirmed pivots with labels
SHARK FIN EXHAUSTION FILTER:
Depth buffer: 1.5 RSI points (penetration threshold beyond band)
Min band stdev: 1.0 (volatility qualification)
Cooldown: 25 bars minimum between Shark Fin confirmations
Slope validation: Requires ta.change(rsi) > 0 (bullish) or < 0 (bearish)
State tracking: Boolean flags prevent premature confirmations
VISUAL CUSTOMIZATION:
Beauty Mode: Six-layer gradient fill anchored at 50-line
• Purple regime (above 50) with configurable opacity
• Green regime (below 50) with configurable opacity
• Gradient layers: 33%, 66%, 100% intensity
Divergence lines: Glow effect (6px) + core line (3px), both configurable
Shark Fin rendering: 20% fill between RSI and violated band (ephemeral)
Labels: Compact "Bull"/"Bear" markers with dot indicators
═══════════════════════════════════════════
ALERT SYSTEM
═══════════════════════════════════════════
Four distinct alert conditions (configure once, fires on all intervals):
"RSI Shark Fin — Bullish"
Triggers when: RSI re-enters lower band from below with slope + stdev + cooldown confirmation
Use case: Momentum exhaustion at oversold extreme
Reliability: No repaint (confirmation locked at re-entry bar)
"RSI Shark Fin — Bearish"
Triggers when: RSI re-enters upper band from above with slope + stdev + cooldown confirmation
Use case: Momentum exhaustion at overbought extreme
Reliability: No repaint (confirmation locked at re-entry bar)
"Bullish Divergence (Panel)"
Triggers when: Pivot-confirmed bullish divergence completes (price LL + RSI HL)
Timing: Fires AFTER Pivot Right bars complete (delayed but stable)
Reliability: Never repaints (divergence locked at rsi )
"Bearish Divergence (Panel)"
Triggers when: Pivot-confirmed bearish divergence completes (price HH + RSI LH)
Timing: Fires AFTER Pivot Right bars complete (delayed but stable)
Reliability: Never repaints (divergence locked at rsi )
═══════════════════════════════════════════
TRADING IMPLEMENTATION
═══════════════════════════════════════════
CONFLUENCE FRAMEWORK:
Highest-probability setups occur when three conditions align:
Bullish Setup:
Shark Fin confirms below lower band (exhaustion)
Bullish divergence prints at pivot (structure)
RSI reclaims 50 line (regime shift to bullish)
→ Entry consideration at next price structure (support, swing low)
Bearish Setup:
Shark Fin confirms above upper band (exhaustion)
Bearish divergence prints at pivot (structure)
RSI loses 50 line (regime shift to bearish)
→ Entry consideration at next price structure (resistance, swing high)
TREND CONTEXT:
Strong uptrends: Prioritize bullish divergence + lower band Shark Fins (buy dips)
Strong downtrends: Prioritize bearish divergence + upper band Shark Fins (sell rallies)
Range-bound markets: Use 50-line crossovers as additional confirmation filter
RISK MANAGEMENT:
Smart Divergence Engine provides CONTEXT, not entries:
Wait for price confirmation (engulfing candle, rejection wick, structure break)
Place stops below/above pivot structure that triggered divergence
Size positions based on distance to invalidation level
Divergence + Shark Fin = elevated probability, not certainty
═══════════════════════════════════════════
CONFIGURATION PARAMETERS
═══════════════════════════════════════════
RSI SETTINGS:
RSI Length: 14 (default, standard momentum window)
Price Source: close (configurable to any price source)
Note: 2-period RMA smoothing is hardcoded (reduces noise)
VOLATILITY BAND SETTINGS:
Band Length: 34 (SMA period for RSI basis)
Band Multiplier: 1.618 (golden ratio, adjustable)
Show Bands: Toggle visibility (true/false)
DIVERGENCE SETTINGS:
Pivot Left: 10 bars (left-side swing confirmation)
Pivot Right: 10 bars (right-side swing confirmation)
Overbought Level: 68 (reference line, does not affect logic)
Oversold Level: 32 (reference line, does not affect logic)
SHARK FIN SETTINGS:
Fin Depth Buffer: 1.5 RSI points (penetration threshold)
Min Band Stdev: 1.0 (volatility qualification gate)
Min Bars Between Fins: 25 (cooldown period)
VISUAL SETTINGS (Beauty Mode):
Enable Beauty Mode: true/false (gradient rendering)
Divergence Glow: true/false (glow effect on lines)
Glow Width: 3-10 px (glow layer thickness)
Main Line Width: 1-6 px (divergence core line)
Top Color: Purple (configurable, above-50 regime)
Bottom Color: Green (configurable, below-50 regime)
Top Opacity: 0-100% (gradient base transparency)
Bottom Opacity: 0-100% (gradient base transparency)
═══════════════════════════════════════════
PERFORMANCE & LIMITATIONS
═══════════════════════════════════════════
RESOURCE ALLOCATION:
max_lines_count: 500 (divergence + Shark Fin lines)
max_labels_count: 500 (divergence markers)
max_bars_back: 500 (historical pivot lookback)
Suitable for most timeframes; reduce limits if performance degrades on low-end devices
SIGNAL TIMING:
Divergences print AFTER Pivot Right bars complete. This is intentional:
Delayed signals are more reliable than real-time signals
Structure confirmation requires waiting for swing completion
Users demanding instant signals should use free real-time divergence indicators
Users demanding reliable signals that never disappear should use this
PANEL VS OVERLAY:
This is the panel version (overlay=false):
Renders in separate pane below price chart
RSI, bands, divergence lines, and Shark Fin fills appear in this pane
For price-chart annotations, use the companion overlay version (same logic, different rendering)
═══════════════════════════════════════════
This script implements proprietary methodology not available in regular community scripts:
REPAINTING-PROOF ARCHITECTURE
The pivot-locked detection system (rsi evaluation) is a non-trivial implementation that requires:
State management across bars using var variables
Historical RSI value storage at pivot confirmation
Divergence comparison between stored values (not current bar)
This architecture eliminates the #1 complaint with free divergence indicators: disappearing signals.
SHARK FIN EXHAUSTION LOGIC
The multi-condition state machine that validates momentum exhaustion is not found in free scripts:
Penetration threshold (buffer beyond band)
Directional slope confirmation on re-entry
Volatility gate (minimum standard deviation)
Cooldown enforcement (prevents clustering)
This filter layer was developed through extensive backtesting to reduce false divergences during choppy conditions.
ADAPTIVE VOLATILITY FRAMEWORK
The dynamic band system (34-SMA + 1.618σ) provides context-aware overbought/oversold detection:
Bands expand in volatile markets → signals adapt to conditions
Bands contract in ranging markets → tighter detection thresholds
50-line regime framework → directional bias context
This approach outperforms fixed-level systems (30/70) that ignore market context.
CONFLUENCE METHODOLOGY
The three-layer confirmation system (structure + exhaustion + volatility) was engineered to answer: "When is a divergence actually tradeable?" Free scripts detect divergence and stop there. Smart Divergence Engine asks: "Did RSI show exhaustion? Is volatility sufficient? Did structure confirm?"
This level of methodological depth—combined with repainting-proof architecture and professional-grade visual implementation—justifies closed-source protection and paid access.
═══════════════════════════════════════════
Smart Divergence Engine is engineered for traders who demand institutional-grade divergence detection without the noise, repainting, and false positives that plague free alternatives.
Access is restricted to maintain signal quality as methodology evolves.

Smart RSI MTF Matrix [DotGain]Summary
Are you tired of trading trend signals, only to miss the bigger picture because you are focused on a single timeframe?
The Smart RSI MTF Matrix is the ultimate "Cockpit View" for momentum traders. Unlike chart overlays that can sometimes clutter your price action, this indicator organizes RSI conditions across 10 different timeframes simultaneously into a clean, separate Heatmap pane.
It monitors everything from the 5-minute chart all the way up to the 12-Month view , giving you a complete X-ray vision of the market's momentum structure instantly.
⚙️ Core Components and Logic
The Smart RSI MTF Matrix relies on a sophisticated hierarchy to deliver clear, actionable context:
Multi-Timeframe Engine: The script runs 10 independent RSI calculations in the background, organized in rows from bottom (Short Term) to top (Long Term).
Classic RSI Thresholds:
Overbought (> 70): Indicates price may be extended to the upside.
Oversold (< 30): Indicates price may be extended to the downside.
Smart Visibility System (The "Secret Sauce"): Not all signals are equal. A 5-minute signal is "noise" compared to a Yearly signal. This indicator automatically applies Transparency to differentiate importance. The visibility increases by 10% for each higher timeframe slot (Row).
🚦 How to Read the Matrix
The indicator plots dots in 10 stacked rows. The position and opacity tell you the direction and significance:
🟥 RED DOTS (Overbought Condition)
Trigger: RSI is above 70 on that specific timeframe.
Meaning: Potential bearish reversal or pullback.
🟩 GREEN DOTS (Oversold Condition)
Trigger: RSI is below 30 on that specific timeframe.
Meaning: Potential bullish reversal or bounce.
⚪ GRAY DOTS (Neutral)
Trigger: RSI is between 30 and 70.
Meaning: No extreme momentum present.
👻 TRANSPARENCY (Signal Strength)
The visibility of the dot tells you exactly which Timeframe (Row) is triggered. The higher the row, the more solid the color:
Faint (10-30% Visibility): Rows 1-3 (5m, 15m, 1h). Used for scalping entries.
Medium (40-60% Visibility): Rows 4-6 (4h, 1D, 1W). Used for swing trading context.
Solid (70-100% Visibility): Rows 7-10 (1M, 3M, 6M, 12M). Used for identifying major macro cycles.
Visual Elements
Structure: Row 1 (Bottom) represents the 5-minute timeframe. Row 10 (Top) represents the 12-Month timeframe.
Vertical Alignment: If you see a vertical column of Red or Green dots, it indicates Multi-Timeframe Confluence —a highly probable reversal point.
Key Benefit
The goal of the Smart RSI MTF Matrix is to keep your main chart clean while providing maximum information. You can instantly see if a short-term pullback (Faint Green Dot) is happening within a long-term uptrend (Solid Gray/Red Dot), allowing for precision entries.
Have fun :)
Disclaimer
This "Smart RSI MTF Matrix" indicator is provided for informational and educational purposes only. It does not, and should not be construed as, financial, investment, or trading advice.
The signals generated by this tool (both "Buy" and "Sell" indications) are the result of a specific set of algorithmic conditions. They are not a direct recommendation to buy or sell any asset. All trading and investing in financial markets involves substantial risk of loss. You can lose all of your invested capital.
Past performance is not indicative of future results. The signals generated may produce false or losing trades. The creator (© DotGain) assumes no liability for any financial losses or damages you may incur as a result of using this indicator.
You are solely responsible for your own trading and investment decisions. Always conduct your own research (DYOR) and consider your personal risk tolerance before making any trades.

Smart RSI MTF [DotGain]Summary
Are you tired of constantly switching between timeframes to check the RSI, only to miss the bigger picture?
The Smart RSI MTF (Multi-Timeframe) is designed to solve this exact problem. It is a streamlined chart overlay that monitors RSI conditions across up to 10 different timeframes simultaneously —from the 1-minute chart all the way up to the Monthly view.
This indicator removes the need for multiple open tabs and declutters your analysis by plotting signals directly on your main chart using a smart "visual hierarchy" system based on transparency.
⚙️ Core Components and Logic
The Smart RSI MTF relies on a sophisticated 3-layer logic to deliver clear, actionable context:
Multi-Timeframe Engine: The script runs 10 independent RSI calculations in the background. It checks standard intervals (5m, 15m, 1h, 4h, Daily, Weekly, Monthly) to ensure you never miss a momentum extreme on any scale.
Classic RSI Thresholds:
Overbought (> 70): Indicates price may be extended to the upside.
Oversold (< 30): Indicates price may be extended to the downside.
Smart Visibility System (The "Secret Sauce"): Not all signals are equal. A 5-minute Overbought signal is "noise" compared to a Weekly Overbought signal. This indicator automatically applies Transparency to differentiate importance:
Minutes = High Transparency (Faint).
Hours = Medium Transparency.
Days/Weeks/Months = No Transparency (Solid/Bold).
🚦 How to Read the Indicator
The indicator plots shapes (Labels by default) directly above or below the candles. The appearance tells you the direction and the timeframe significance:
🟥 RED SIGNALS (Overbought Condition)
Trigger: RSI is above 70 on a specific timeframe.
Location: Placed above the candle bar.
Meaning: Potential bearish reversal or pullback.
🟩 GREEN SIGNALS (Oversold Condition)
Trigger: RSI is below 30 on a specific timeframe.
Location: Placed below the candle bar.
Meaning: Potential bullish reversal or bounce.
👻 TRANSPARENCY (Signal Strength)
Faint/Ghostly: The signal comes from a lower timeframe (e.g., 5m, 15m). Use for scalping or entry timing.
Solid/Bright: The signal comes from a major timeframe (e.g., Daily, Weekly). Use for swing trading and identifying major market turns.
Visual Elements
Symbol Shapes: Fully customizable (Label, Diamond, Circle, Triangle, etc.) via settings.
Stacking: If multiple timeframes trigger at once, symbols will overlay, creating a visually denser and darker color, indicating Confluence .
Key Benefit
The goal of the Smart RSI MTF is to help traders instantly spot Confluence . When you see a faint short-term signal align with a solid long-term signal, you have identified a high-probability reversal zone without leaving your chart.
Have fun :)
Disclaimer
This "Smart RSI MTF" indicator is provided for informational and educational purposes only. It does not, and should not be construed as, financial, investment, or trading advice.
The signals generated by this tool (both "Buy" and "Sell" indications) are the result of a specific set of algorithmic conditions. They are not a direct recommendation to buy or sell any asset. All trading and investing in financial markets involves substantial risk of loss. You can lose all of your invested capital.
Past performance is not indicative of future results. The signals generated may produce false or losing trades. The creator (© DotGain) assumes no liability for any financial losses or damages you may incur as a result of using this indicator.
You are solely responsible for your own trading and investment decisions. Always conduct your own research (DYOR) and consider your personal risk tolerance before making any trades.

Smart Money Volume Matrix [Ata]Smart Money Volume Matrix
The Smart Money Volume Matrix (SMV Matrix) is an advanced volume-spread analysis (VSA) dashboard and charting tool designed to identify significant market anomalies by analyzing the relationship between price extremes and volume flow.
Unlike traditional indicators that rely solely on moving averages or oscillators, this tool performs a "Snapshot Analysis" of a defined lookback period (default: 100 bars) to rank price action based on Order Flow Dominance. It isolates the Top 10 Highest and Lowest Close prices and scrutinizes the volume behind them to categorize market sentiment into four distinct phases: Distribution, No Demand, Absorption, and Exhaustion.
Core Logic & Methodology
The script operates on a Zero-Lag Snapshot Engine. It does not print historical signals bar-by-bar; instead, it evaluates the current market structure relative to the recent history (Lookback Period).
1. Ranking Engine: The script scans the lookback period to find the Top 10 Highest Closes and Top 10 Lowest Closes.
2. Volume Classification: For each ranked bar, it calculates the "Intrabar Buy/Sell Volume" (or approximates it using candle geometry if Intrabar data is unavailable).
3. Dominance Detection: It compares Buying Volume vs. Selling Volume to determine who is in control at critical price levels.
Signal Classifications (VSA Logic)
The indicator generates labels on the chart and updates the dashboard table based on the following logic:
1. At Price Tops (Resistance Areas):
- Distribution (Supply): High Price + High Total Volume + Sellers Dominant.
Interpretation: Indicates heavy institutional selling into rising prices. Often precedes a reversal.
- Buy Climax: High Price + High Total Volume + Buyers Dominant.
Interpretation: Extreme buying frenzy. While bullish, it often marks a "trap" or temporary top due to exhaustion.
- No Demand: High Price + Low Volume.
Interpretation: Prices drifted higher but lack institutional participation. A sign of weakness.
2. At Price Bottoms (Support Areas):
- Absorption: Low Price + High Total Volume + Buyers Dominant.
Interpretation: Institutional money is absorbing selling pressure (passive buying). A strong sign of accumulation.
- Panic Sell: Low Price + High Total Volume + Sellers Dominant.
Interpretation: Extreme fear. High volume at lows typically indicates capitulation and potential hands-changing.
- Exhaustion: Low Price + Low Volume.
Interpretation: Selling pressure has dried up. The market may float upward due to lack of sellers.
Key Features
- Dashboard Matrix Table:
Displays the exact Close Price, Buy/Sell Volume, and Market State (Group) for the Top 10 ranking bars.
Smart Footer: Automatically detects the active "Resistance Zone" (derived from G1 Distribution levels) and "Support Zone" (derived from G3 Absorption levels) and reports the current price status relative to these zones (e.g., "Testing Resistance", "Breakout", "At Support").
- Smart Zones (Auto S/R):
Automatically draws Support and Resistance boxes extending into the future based on the most significant volume clusters found in the rankings. Includes logic to detect "Flips" (e.g., when Support breaks, it is labeled as a flip to Resistance).
- Average Trend Channels:
Calculates a Linear Regression trend line based specifically on the coordinates of the Top 10 Highs and Top 10 Lows, providing a "Best Fit" channel for the current market structure.
- Visual Clarity:
Labels utilize a "Smart Stacking" algorithm to prevent overlap on the chart. Guide lines connect labels to their respective candles for precise identification.
Settings & Configuration
- Matrix Settings: Lookback Period (default 100 bars) and Top Rank Count.
- Volume Engine: Choose between "Intrabar (Precise)" for accurate order flow or "Geometry (Approx)" for standard volume estimation.
- Visuals: Toggle Table, Labels, Lines, Zones, and Trend Lines. Adjust transparency and font sizes.
IMPORTANT NOTE ON SNAPSHOT LOGIC
This indicator is designed as a Real-Time Dashboard. It continuously updates the "Top 10" list as new candles form. Therefore, a label that appears on a candle may disappear if that candle falls out of the Top 10 ranking or leaves the lookback window. This is intended behavior to ensure the chart always reflects the current most critical levels, rather than a historical record of past signals. It is best used for live market analysis rather than historical back testing.
Disclaimer: This tool is for educational and analytical purposes only. Volume analysis is subjective and should be used in conjunction with other methods of technical analysis.

Smart Swing & Order Block Pro v1📌 Smart Swing & Order Block Pro v1
The Smart Swing & Order Block Pro v1 indicator is an advanced tool designed for traders who use Smart Money Concepts, institutional analysis, and deep market-structure reading. It combines precise Order Block detection, intelligent classification, reliable swing identification, and professional volume/delta filtering to deliver a clean, structured, and actionable view of price behavior.
🎯 Indicator Purpose
Provide a consistent, clean, and verifiable identification of institutional zones (OBs), their evolution over time, their break and mitigation events, and a complete structural reading of swings and trend direction.
This indicator replaces the typical noise found in standard OB tools with a robust system based on:
OBs validated by volume and delta
Dynamic OB classification (Extreme, Mitigated, Breaker, Intermediate)
Clean visual separation between intact and broken OBs
Accurate Swing High / Swing Low detection using dynamic pivots
Visual panels with quantitative swing and OB statistics
🧠 Key Features
1. Precision Order Block Detection
The indicator identifies bullish and bearish Order Blocks using a combination of:
Market structure
Validated breakouts
Optional filtering via relative volume (RVOL)
Normalized delta filtering to measure directional intent
This prevents low-quality or non-institutional OBs from being drawn.
2. Intelligent OB Classification
Each detected OB is automatically assigned a structural role:
🔹 Extreme OB
The origin point of a movement (up leg or down leg).
Crucial for spotting institutional footprints and major displacement zones.
🔹 Mitigated OB
An OB already tapped or partially consumed by price.
Useful for identifying weakened zones or controlled pullbacks.
🔹 Breaker OB
An OB broken by price in the opposite direction.
The box is visually split into two parts:
Left section → original OB color
Right section → breaker color
🔹 Intermediate OB
Active OBs that do not meet the criteria above.
3. Professional OB Visualization
OBs automatically extend to the right.
Broken OBs show a clear color split (intact vs. breaker).
Mitigated OBs update color automatically.
Extreme OBs are highlighted with a special color.
Automatic cleanup of boxes and lines for performance and clarity.
4. Ultra-Precise Swing Detection
Unlike standard swing indicators:
Uses configurable pivot strengths
Marks the exact candle that created the swing
Avoids excessive false signals
Draws clean swing-high and swing-low lines
Places crosses exactly when price breaks a swing
This results in a perfectly readable structure (HH, HL, LH, LL).
5. Dynamic Panels
The script includes two optional informational panels:
📊 Swing Panel
Displays:
Average bars between swing highs
Average bars between swing lows
Current trend based on structure (UP / DOWN / RANGE)
📉 OB Panel
Displays counts of:
Bullish Extreme
Bullish Mitigated
Bearish Extreme
Bearish Mitigated
Perfect for evaluating institutional strength and directional bias.
⚙️ Configurable Options
Swing strength (independent lookback for high/low)
Use of candle body vs. wicks
Volume/delta filter modes (Strict, Normal, Loose)
Toggle visibility of OBs, swings, and panels
Color themes per OB classification
Panel positioning (Top Left / Top Right)
🎨 Clean and Professional Visualization
The indicator focuses on:
Clarity
Structural accuracy
Immediate interpretability
Institutional-grade behavior
Real reaction zones
Nothing unnecessary, nothing noisy — just clean structure.
🚀 Who Is This Indicator For?
Ideal for traders using:
Smart Money Concepts (SMC)
ICT-style analysis
Wyckoff methodology
Order Flow
Swing trading based on structure
Algorithmic OB logic
Strategies based on breakers, traps, and displacement
Paneles gráficos informativos sobre swings y OB.
🧠 Funcionalidades Principales
1. Detección Precisa de Order Blocks (OB)
El indicador identifica OB alcistas y bajistas usando una combinación de:
Estructura de precio
Rupturas validadas
Filtro opcional por volumen relativo (RVOL)
Filtro por delta normalizado (direccionalidad del cuerpo de la vela)
Esto evita identificar OB sin relevancia institucional.
2. Clasificación Inteligente de OB
Cada OB detectado recibe una etiqueta automática según su importancia estructural:
🔹 Extreme
Es el OB origen del movimiento (up leg o down leg).
Fundamental para identificar desplazamientos fuertes y zonas institucionales críticas.
🔹 Mitigated
OB ya tocado, parcialmente consumido o con interacción del precio.
Ideal para detectar zonas debilitadas o retrocesos controlados.
🔹 Breaker
OB que fue roto por el precio en sentido contrario.
La caja se divide visualmente en dos colores:
Parte izquierda = color del OB original
Parte derecha = color de breaker
🔹 Intermediate
OB activos que aún no pertenecen a las categorías anteriores.
3. Visualización Profesional de Order Blocks
Los OB se extienden hacia la derecha.
Los breakers se dividen en color original y color de ruptura.
Los OB mit igados cambian automáticamente de color.
Los OB extremos destacan con un color especial.
Limpieza automática de cajas y líneas.
4. Swings Ultra Precisos
A diferencia del detector estándar de swings:
Usa pivotes configurables
Marca correctamente la vela que originó el swing
Evita el exceso de falsos positivos
Genera líneas limpias de swing high y low
Coloca cruces exactamente donde el precio rompe el swing
Esto permite medir estructura (HH, HL, LH, LL) de forma clara.
5. Paneles Dinámicos
El script incorpora dos paneles opcionales:
📊 Panel de Swings
Incluye:
Promedio de barras entre swings high
Promedio de barras entre swings low
Tendencia actual basada en estructura (UP / DOWN / RANGE)
📉 Panel de OB
Muestra conteos de:
Bullish Extreme
Bullish Mitigated
Bearish Extreme
Bearish Mitigated
Ideal para medir fuerza institucional y bias del mercado.
⚙️ Opciones Ajustables
Fuerza del swing (lookback independiente para high/low)
Uso del cuerpo/candlestick o mechas en la lógica
Filtro de volumen/delta (Strict, Normal, Loose)
Visualización de OB, Swings y Paneles
Estilos de color por cada tipo de OB
Posición de paneles (Top Left / Top Right)
🎨 Visualización Limpia y Profesional
El indicador prioriza:
Claridad
Estructura
Lectura inmediata
Comportamiento “institucional”
Zonas de reacción reales
No pinta elementos innecesarios y mantiene un diseño elegante y minimalista.
🚀 ¿Para quién está diseñado?
Ideal para traders que utilizan:
Smart Money Concepts
Wyckoff
Order Flow
ICT / SMC
Swing trading basado en estructura
Trading algorítmico basado en OB
Estrategias basadas en trampas y breakers

Smart Trail + Trend RibbonSmart Trail + Trend Ribbon
This script combines a smart trailing system with an EMA-based trend ribbon to help you quickly read trend direction, potential reversals and dynamic support/resistance zones.
1. Smart Trail
The Smart Trail module is based on an external library function getSmartTrail() and plots a dynamic trailing line that adapts to market conditions.
• The line switches its state between long and short depending on price action.
• When the direction is long , the trail is colored with the Up Color; when short , it uses the Down Color.
• The area between the main trail and the filler line is shaded to highlight the active bias and strength of the move.
Smart Trail inputs:
• Trail Period – base length for calculating the trail.
• Param A / Param B – additional sensitivity and smoothing parameters that control how fast the trail reacts to price changes.
• Up Color / Down Color – visual colors for long/short regimes.
Use it as a dynamic support/resistance reference or as a trailing level for managing open positions.
2. Trend Ribbon (EMA Ribbon)
The Trend Ribbon block uses two EMAs calculated on hlc3 (average of high, low and close) and creates a colored band between them.
• When EMA Ribbon 1 is above EMA Ribbon 2 , the area between them is filled with Uptrend Colors .
• When EMA Ribbon 1 is below EMA Ribbon 2 , the area is filled with Downtrend Colors .
• The ribbon is slightly expanded relative to the EMAs using the current price range to make the zone more visible on the chart.
Trend Ribbon inputs:
• EMA Ribbon 1 Period – faster EMA.
• EMA Ribbon 2 Period – slower EMA.
• Uptrend Color / Uptrend Color (2) – main and secondary colors for bullish conditions.
• Downtrend Color / Downtrend Color (2) – main and secondary colors for bearish conditions.
This gives you a clear visual filter of the current trend and helps avoid trading directly against the dominant direction.
How to use
• Combine the Smart Trail direction with the Trend Ribbon bias to confirm entries and exits.
• Long setups are stronger when the Smart Trail is in long mode and the Trend Ribbon shows an uptrend.
• Short setups are cleaner when the Smart Trail is in short mode and the Trend Ribbon shows a downtrend.
• Works on any symbol and timeframe; parameters can be tuned to your trading style (scalping, intraday, swing).
Disclaimer: This script is for educational and analytical purposes only and is not financial advice. Always manage your own risk.

Elliott Wave + SMC Fusion # Elliott Wave + SMC Fusion
## TITLE:
Elliott Wave + Smart Money Concepts Fusion
---
## SHORT DESCRIPTION:
Automated Elliott Wave pattern detection with Smart Money Concepts confirmation, EWO oscillator integration, and confluence scoring system.
---
## FULL DESCRIPTION:
### 📊 OVERVIEW
This indicator combines three powerful trading methodologies into a unified system:
- **Elliott Wave Theory** - Automated detection of Wave 1-2 impulse patterns
- **Smart Money Concepts (SMC)** - Order Blocks and Fair Value Gaps for institutional confirmation
- **Elliott Wave Oscillator (EWO)** - Momentum-based signal validation
The core concept is to identify high-probability Wave 3 entries by detecting completed Wave 1-2 structures and validating them with SMC and momentum indicators.
---
### 🔧 HOW IT WORKS
**1. Pattern Detection (ZigZag Method)**
- Uses pivot high/low detection to identify swing points
- Validates Wave 2 retracement using Fibonacci ratios (default: 38.2% - 88.6%)
- Requires minimum wave size to filter noise
- Applies confirmation bars to avoid premature signals
**2. Wave Projections**
- Wave 3 target: Fibonacci extension of Wave 1 (default: 1.618)
- Wave 4 retracement: Percentage of Wave 3 (default: 38.2%)
- Wave 5 projection: Extension of Wave 1 from Wave 4
**3. Smart Money Validation**
- **Order Blocks**: Identifies last opposing candle before breakout (institutional footprint)
- **Fair Value Gaps**: Detects price imbalances for potential support/resistance
**4. EWO Confirmation**
- Calculates momentum: (EMA5 / EMA34 - 1) × 100
- Signal line crossovers confirm trend direction
- Strong signals occur at extremes (< -13 or > 13 threshold)
**5. Confluence Scoring (0-100%)**
Points awarded for:
- Fibonacci quality of Wave 2 retracement (10-30 pts)
- Order Block presence (15 pts)
- Fair Value Gap presence (10 pts)
- Volume confirmation (10-15 pts)
- Trend alignment with EMA50 (10 pts)
- EWO confirmation (10-20 pts)
---
### 🎯 UNIQUE FEATURES
**Pattern Locking System**
- Once a valid pattern is detected, it locks until:
- Pattern invalidates (price breaks Wave 0)
- Pattern completes (Wave 5 reached)
- Auto-timeout (configurable bars)
- Prevents rapid signal flipping and false alerts
**Signal Stability Controls**
- Adjustable cooldown between signals (default: 20 bars)
- Minimum bar distance between wave points
- Direction change requirement option
- Confirmation bars after Wave 2 formation
**Visual Wave Tracking**
- Solid lines for impulse waves (0→1, 2→3, 4→5)
- Dashed lines for corrective waves (1→2, 3→4)
- Numbered labels on each wave point
- Real-time projection lines to targets
**Comprehensive Dashboard**
- Current wave status and lock state
- Pattern grade (A+ to D based on confluence)
- Projected vs actual wave levels (✓ when completed)
- SMC confirmation status
- Risk/Reward ratio calculation
- EWO trend direction
---
### 📈 TRADING APPLICATION
**Entry Strategy**
- Wait for Wave 1-2 pattern detection (diamond signal)
- Check confluence score (>65% = higher probability)
- Verify EWO alignment with pattern direction
- Enter after 30% retracement of Wave 2 (customizable)
**Risk Management**
- Stop Loss: Below Wave 0 (with buffer)
- Take Profit 1: Wave 3 projection
- Take Profit 2: Wave 5 projection
- R:R displayed in dashboard
**Invalidation Rules**
- Price breaks below Wave 0 (bullish) or above (bearish)
- Wave 2 level violated before Wave 3 forms
- Pattern timeout exceeded
---
### ⚙️ KEY SETTINGS
**Elliott Wave**
- ZigZag Length: Pivot detection sensitivity
- Fib Tolerance: Acceptable retracement range
- Min Wave Size: Filter small movements
**Signal Stability**
- Signal Cooldown: Minimum bars between signals
- Lock Pattern Until Invalid: Prevent signal changes
- Confirmation Bars: Wait after Wave 2
**Wave Projection**
- Wave 3/4/5 Fibonacci extensions
- Projection display distance
**EWO Settings**
- Fast/Slow EMA lengths
- Signal smoothing
- Strength threshold
**SMC Settings**
- Order Block lookback period
- FVG minimum size percentage
---
### 🔔 ALERTS
- New bullish/bearish pattern detected
- High confluence setup (>75%)
- Pattern invalidation
- Wave completion
---
### ⚠️ IMPORTANT NOTES
- This indicator identifies **potential** Elliott Wave patterns based on mathematical rules
- Elliott Wave analysis is subjective - patterns may be interpreted differently
- Always combine with other analysis methods and proper risk management
- Past pattern performance does not guarantee future results
- Pattern locking prevents repainting but delays new pattern detection
- Best used on higher timeframes (1H+) for cleaner wave structures
---
### 📚 METHODOLOGY REFERENCES
**Elliott Wave Theory**
- Wave 2 typically retraces 38.2% - 88.6% of Wave 1
- Wave 3 is often the strongest, extending 161.8% of Wave 1
- Wave 4 usually retraces 38.2% of Wave 3
- Wave 5 completes the impulse structure
**Smart Money Concepts**
- Order Blocks represent institutional supply/demand zones
- FVGs indicate price inefficiencies that may act as magnets
**Elliott Wave Oscillator**
- Developed to identify wave momentum
- Crossovers signal potential wave transitions
- Extreme readings often coincide with wave completions
---
### 🎨 VISUAL ELEMENTS
- **Green**: Bullish patterns and projections
- **Red**: Bearish patterns and projections
- **Orange**: Wave projection levels
- **Purple**: Order Block zones
- **Yellow**: Fair Value Gaps
- **Blue**: Entry levels
- **Diamond shapes**: New pattern signals
- **Triangle shapes**: EWO crossover signals
---
### 💡 TIPS FOR BEST RESULTS
1. Use on liquid markets with clear trend behavior
2. Higher timeframes produce more reliable patterns
3. Look for confluence scores above 65%
4. Verify EWO alignment before entry
5. Consider market context (overall trend, key levels)
6. Adjust ZigZag length based on your trading style
7. Increase cooldown period for longer-term signals
---
**Indicator Type**: Overlay
**Markets**: All (Crypto, Forex, Stocks, Commodities)
**Timeframes**: All (1H+ recommended)
**Style**: Pattern Recognition + Momentum + Price Action

Smart Money Flow V6 Pro📊 Smart Money Flow V6 Pro
🎯 Overview
Smart Money Flow V6 Pro is an advanced multi-timeframe indicator designed to detect institutional order flow and smart money accumulation/distribution patterns. It combines delta volume analysis, order block detection, and opening range breakout strategies to identify high-probability trading opportunities.
🔍 What Makes This Indicator Unique?
1. Proprietary Delta Flow Analysis
Unlike standard volume indicators, this script calculates:
Cumulative Delta: Tracks the net difference between buying and selling pressure over time
Delta Momentum Oscillator: Uses RSI calculation on cumulative delta to identify momentum shifts
Volume-Weighted Delta: Multiplies delta by volume-to-average-volume ratio for stronger signals
Why it matters: Standard volume indicators show only total volume. This script separates buying vs selling volume to reveal institutional footprints that retail traders miss.
2. Smart Money Divergence Detection
The indicator identifies hidden smart money activity through:
Bullish Divergence: Price makes lower lows while cumulative delta makes higher lows (institutions accumulating)
Bearish Divergence: Price makes higher highs while cumulative delta makes lower highs (institutions distributing)
Calculation Method: Compares 5-bar price movement against cumulative delta direction to spot divergences
3. Institutional Order Block Identification
Order blocks represent price levels where large institutions placed significant orders:
Bullish OB: Detected after 2+ consecutive down candles followed by a strong bullish candle (>50% of previous range)
Bearish OB: Detected after 2+ consecutive up candles followed by a strong bearish candle
Visual Display: Boxes extend right to show active zones where price may react
4. Opening Range Breakout System
Tracks the first 30 minutes (customizable) of trading:
Identifies OR High, Low, and Midpoint
Monitors breakouts/breakdowns for directional bias
Only activates after OR period completes
Usage: Helps traders align with the day's initial institutional positioning
5. Dynamic Support/Resistance
Uses pivot point detection with tolerance zones:
Stores last 5 resistance and 5 support levels
Creates zones (default 0.5% tolerance) around key levels
Updates dynamically as new pivots form
Calculation: pivothigh()/pivotlow() functions with 10-bar lookback, stored in arrays
6. Three Signal Modes for Different Trading Styles
Aggressive Mode:
Triggers: Trend alignment + positive delta momentum
Best for: Active scalpers, high-frequency trading
Signal frequency: High
Balanced Mode (Recommended):
Triggers: Trend + delta momentum threshold (>30) + confluence (divergence OR S/R OR order block)
Best for: Swing traders, position traders
Signal frequency: Medium
Conservative Mode:
Triggers: All balanced conditions + high volume + divergence confirmation
Best for: Risk-averse traders, larger positions
Signal frequency: Low but highly accurate
📈 How It Works (Technical Methodology)
Step 1: Volume Analysis
buyVolume = close > open ? volume : 0
sellVolume = close < open ? volume : 0
delta = buyVolume - sellVolume
cumDelta += delta (running total)
Step 2: Momentum Calculation
deltaMomentum = RSI(cumDelta, 14) - 50
This normalizes cumulative delta into an oscillator ranging from -50 to +50
Step 3: Trend Filter
EMA(20) determines trend direction
Signals only trigger WITH the trend (no counter-trend trades)
Step 4: Signal Generation Logic
Buy Signal (Balanced Mode):
Price > EMA(20) ✓
Delta > 0 AND cumDelta rising ✓
Volume > 1.2x average ✓
Delta Momentum > 30 ✓
At least ONE: Bullish divergence OR near support OR bullish order block ✓
Sell Signal: Opposite conditions
Step 5: Visual Confirmation
Large triangles for primary signals
Small circles for divergences
Boxes for order blocks
Lines for OR levels and S/R
🎨 Dashboard Metrics Explained
The real-time dashboard shows:
Delta: Current bar's buy/sell pressure
Cum Delta: Running total (positive = bullish bias)
Momentum: RSI-based oscillator (-50 to +50)
Trend: EMA direction
Volume: Compared to average (HIGH/NORMAL/LOW)
OR Status: Price position relative to opening range
S/R Level: Proximity to support/resistance
Order Block: Active institutional zones
Divergence: Smart money divergence status
Mode: Current signal sensitivity
Price: Current close
SIGNAL: Overall market bias (STRONG BUY/SELL/WAIT)
🔧 How to Use This Indicator
For Day Traders:
Wait for opening range to complete (default 9:15-9:45)
Use Aggressive or Balanced mode
Take signals that align with OR breakout direction
Exit at opposite order block or S/R level
For Swing Traders:
Use Conservative or Balanced mode
Enter only on divergence + signal confluence
Hold through minor pullbacks to order blocks
Trail stops below/above order blocks
For Scalpers:
Use Aggressive mode on lower timeframes (1-5 min)
Take quick profits at S/R levels
Monitor delta momentum for exhaustion
Exit if momentum crosses zero line
⚠️ Important Notes
What This Indicator Does NOT Do:
Does NOT repaint (all calculations finalize on bar close)
Does NOT use future data
Does NOT guarantee profits (no indicator does)
Originality Statement:
This indicator is NOT a simple combination of existing indicators. It features:
Custom delta calculations not available in standard volume indicators
Unique momentum oscillator using RSI on cumulative delta (not price)
Proprietary signal logic that requires multiple confluence factors
Dynamic order block detection with automatic zone management
Three-mode signal system allowing strategy customization
Why Closed Source?
The specific thresholds, weighting factors, and signal combination logic represent proprietary research. The methodology is fully disclosed above, but exact parameters are protected.
📊 Best Practices
Always use with proper risk management (2% max per trade)
Combine with price action (don't trade signals blindly)
Backtest on your specific instrument before live trading
Adjust parameters for different markets (forex, stocks, crypto)
Start with Conservative mode until familiar with signals
🔔 Alert Conditions Available
Long Signal
Short Signal
Bullish Divergence
Bearish Divergence
Bullish Order Block
Bearish Order Block
📞 Disclaimer
This indicator is for educational purposes. Past performance does not guarantee future results. Always practice proper risk management and never risk more than you can afford to lose.

Smart Money Volume Tools | Lyro RSSmart Money Volume Tools | Lyro RS
Overview
The Smart Money Volume Tools (SMVT) is a multi-dimensional volume-based analysis suite designed to visualize the interplay between price action, moving averages, and smart money behavior.
By integrating dynamic moving averages, volume normalization, and multi-timeframe intelligence, SMVT helps traders identify when institutional (smart money) or retail participants are influencing price movements — all in a single, adaptive display.
Unlike traditional oscillators or trend tools, SMVT dynamically adjusts its sensitivity and thresholds based on volume z-scores and normalized momentum, revealing true intent behind price shifts rather than reacting to them.
🔹 Key Features
4 Core Analytical Modes:
Trail Mode – Identifies directional bias using dynamic volume-weighted trails based on adaptive ATR multipliers.
Volume Mode – Displays normalized volume strength vs. price trend, highlighting volume-driven expansions.
Smart Money Volume Mode – Detects institutional buying/selling spikes from lower timeframes using volume z-score outliers.
Retail Money Volume Mode – Contrasts retail-driven impulses to visualize crowd behavior and exhaustion points.
Dynamic Volume Normalization: Converts volume impulses into a 0–100 range using a sigmoid function for smoother interpretation.
Multi-Timeframe Intelligence: Automatically reads lower timeframe volume data to distinguish smart vs. retail activity.
Adaptive Color Systems: Multiple palette modes ( Classic , Mystic , Accented , Royal ) or full custom color control.
Signal Table Overlay: Built-in real-time module summary showing status for Trail , Volume , Smart Money , and Retail Money — right on your chart.
🔹 How It Works
Volume Strength Calculation:
Calculates relative volume strength using a moving average baseline, then normalizes the result via a sigmoid function — mapping activity into a clean 0–100 range.
Smart Money Detection:
Scans lower timeframe data for extreme volume z-scores ( z > 2 ) to pinpoint institutional accumulation or distribution zones.
Trail Logic:
Uses adaptive upper and lower trails based on ATR and volume intensity to track volatility-adjusted trend direction.
Color Logic:
Trail, candle, and fill colors change dynamically according to the active signal type and selected palette — making directional bias instantly visible.
🔹 Practical Use
Swing Confirmation (Trail Mode): Confirms sustained bullish or bearish momentum supported by volume, ideal for trailing positions and managing exits.
Volume Expansion (Volume Mode): Highlights key moments when institutional liquidity pushes price before visible breakout confirmation.
Smart vs. Retail Divergence: Identify conflicts between retail activity and smart money to detect exhaustion or reversal points early.
Table Overlay Utility: Instantly see all active signals across modules in one compact, on-chart interface.
🔹 Customization
Custom color palettes or manual bullish/bearish color selection.
Adjustable EMA lengths and Volume SMA period .
Selectable lower timeframe source for Smart Money analysis.
Flexible table position & size controls — choose between Top, Middle, Bottom and Tiny to Huge.
Switch freely between Trail , Volume , Smart Money , and Retail Money modes.
Credits
Thank you to @AlgoAlpha for the smart money and retail activity source code.
⚠️Disclaimer
This indicator is a tool for technical analysis and does not provide guaranteed results. It should be used in conjunction with other analysis methods and proper risk management practices. The creators of this indicator are not responsible for any financial decisions made based on its signals.
