Smart EMA SignalsThis indicator starts by plotting each time the price action crosses above or below the EMA, of which you can tune the timeframe and duration.
It then takes it a step further and plots whether or not that indicator would have given you a profitable trade, of which you can also tune the parameters (Max wait time, and % Profit).
Once you have your EMA tuned to your liking, set up alerts to notify you of a golden opportunity.
Cari dalam skrip untuk "smart"

Smart Labelling - Candlestick ChartingThis is a full-fledged implementation of a system presented in an unique research paper 'Profitability of Candlestick Charting Patterns in the Stock Exchange of Thailand' (2017) on candlestick charting, candlestick patterns, trend identification methods, and testing.
You can easily find this paper in the Web. For example, visit: www.researchgate.net
This script is best suited for middle-to-higher time frames. Possible future developments: trend identification and factor calculation techniques.
Donate: PayPal (paypal.me)

Smart Labelling - Range FilterThis is a labelling module based on a range filter . Notice that the trick here is to use fibonachi numbers . Use smaller range multiplier for higher TFs. This module may serve as a signal generator to be passed through a signal filter.
Quote from the original author:
This is an experimental study designed to filter out minor price action for a clearer view of trends. Inspired by the QQE's volatility filter, this filter applies the process directly to price rather than to a smoothed RSI. First, a smooth average price range is calculated for the basis of the filter and multiplied by a specified amount. Next, the filter is calculated by gating price movements that do not exceed the specified range. Lastly the target ranges are plotted to display the prices that will trigger filter movement.

Smart Target Introduction
This is the first forward-looking indicator on TradingView!
A normal moving average indicator will use two averages of differing lengths, referred to as “fast and slow” or “short and long” moving averages, to identify trends and potential trades.
The Smart Target indicator uses the average trade profitability and trade duration of a moving average strategy to determine a forward-looking target that is specific to the chart that it has been applied to.
Every historical trade is considered when the indicator determines the future price target of an asset and the accuracy will improve with time as new trade data is continually introduced.
Indicator Utility
If the fast-moving average crosses above the slow, a blue target will appear.
A red target will appear when the fast-moving average crosses below the slow.
The target will never change once it has been plotted and will not repaint in any way which means that it is fully functional for trading in real-time.
Input Values
The period length of the two moving averages will need to be determined by the user and can be changed in the indicator settings panel.
View the full documentation on this indicator at this link: www.kenzing.com

Smart VolumeOut of beta!
This script distinguishes up/down volume based on lower resolution.
It's important to set correct input "Detailed Resolution" — it affects detalization/loading speed. If equal to chart resolution, should match builtin "volume". The lower it is, the more detalized up/down border.
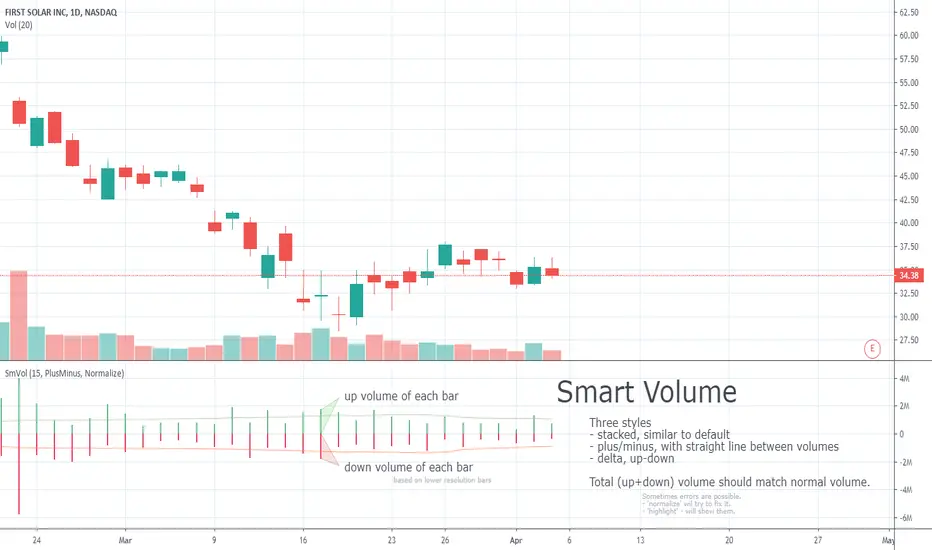
Smart Volume (beta)This script distinguishes up/down volume based on lower resolution.
It's important to set correct inputs. Second - affects detalisation/loading speed. Third one needs to be set according to your chart resolution. 1440 for 'D', 30 for '30'.

Mxwll Price Action Suite [Mxwll]Introducing the Mxwll Price Action Suite!
The Mxwll Price Action Suite is an all-in-one analysis indicator incorporating elements of SMC and also ideas extending beyond the trading methodology!
Features
Internal structures
External structures
Customizable Sensitivities
BoS/CHoCH
Order Blocks
HH/LH/LL/LH Areas
Rolling TF highs/lows
Rolling Volume Comparisons
Auto Fibs
And more!
The image above shows the indicator's market structure identification capabilities. Internal BoS and CHoCH structures in addition to overarching market structures are available with customizable sensitivities.
The image above shows the indicator identifying order blocks! Additionally, HH/LH/LL/LH areas are also identified.
The image above shows a rolling area of interest. These areas can be compared to supply/demand zones, where traders might consider a bargain long/short/sell area.
The indicator displays a rolling 4hr high/low and 1D high/low, alongside auto fibonacci levels with a customizable sensitivity.
Finally, the Mxwll Price Action Suite shows relevant session information.
Table information
Current Session
Countdown to session close
Next Session
Countdown to next session open
Rolling 4-Hr volume intensity
Rolling 24-Hr volume intensity
Introducing the Mxwll SMC Suite!
The Mxwll SMC Suite is an all-in-one analysis indicator incorporating elements of SMC and also ideas extending beyond the trading methodology!
Features
Internal structures
External structures
Customizable Sensitivities
BoS/CHoCH
Order Blocks
HH/LH/LL/LH Areas
Rolling TF highs/lows
Rolling Volume Comparisons
Auto Fibs
And more!
The image above shows the indicator's market structure identification capabilities. Internal BoS and CHoCH structures in addition to overarching market structures are available with customizable sensitivities.
The image above shows the indicator identifying order blocks! Additionally, HH/LH/LL/LH areas are also identified.
The image above shows a rolling area of interest. These areas can be compared to supply/demand zones, where traders might consider a bargain long/short/sell area.
The indicator displays a rolling 4hr high/low and 1D high/low, alongside auto fibonacci levels with a customizable sensitivity.
Finally, the Mxwll Price Action Suite shows relevant session information.
Table information
Current Session
Countdown to session close
Next Session
Countdown to next session open
Rolling 4-Hr volume intensity
Rolling 24-Hr volume intensity
Expanded Features of Mxwll Price Action Suite
Internal and External Structures
Internal Structures: These elements refer to the price formations and patterns that occur within a smaller scope or a specific trading session. The suite can detect intricate details like minor support/resistance levels or short-term trend reversals.
External Structures: These involve larger, more significant market patterns and trends spanning multiple sessions or time frames. This capability helps traders understand overarching market directions.
Customizable Sensitivities
Adjusting sensitivity settings allows users to tailor the indicator's responsiveness to market changes. Higher sensitivity can catch smaller fluctuations, while lower sensitivity might focus on more significant, reliable market moves.
Break of Structure (BoS) and Change of Character (CHoCH)
BoS: This feature identifies points where the price breaks a significant structure, potentially indicating a new trend or a trend reversal.
CHoCH: Detects subtle shifts in the market's behavior, which could suggest the early stages of a trend change before they become apparent to the broader market.
Order Blocks and Market Phases
Order Blocks: These are essentially price levels or zones where significant trading activities previously occurred, likely pointing to the positions of smart money.
HH/LH/LL/LH Areas: Identifying Higher Highs (HH), Lower Highs (LH), Lower Lows (LL), and Lower Highs (LH) helps in understanding the trend and market structure, aiding in predictive analysis.
Rolling Timeframe Highs/Lows and Volume Comparisons
Tracks highs and lows over specified rolling periods, providing dynamic support and resistance levels.
Compares volume data across different timeframes to assess the strength or weakness of the current price movements.
Auto Fibonacci Levels
Automatically calculates and plots Fibonacci retracement levels, a popular tool among traders to identify potential reversal points based on past movements.
Session Data and Volume Intensity
Session Information: Displays current and upcoming trading sessions along with countdown timers, which is crucial for day traders and those trading on session overlaps.
Volume Intensity: Measures and compares the volume within the last 4 hours and 24 hours to gauge market activity and potential breakout/breakdown movements.
Visualizations and Practical Use
Dynamic Visuals: The suite provides dynamic visual aids, such as real-time updating of high/low markers and Fibonacci levels, which adjust as new data comes in. This feature is critical in fast-paced markets.
Strategic Entry/Exit Points: By identifying order blocks and using Fibonacci levels, traders can pinpoint strategic entry and exit points, maximizing potential returns.
Risk Management: Enhanced features like session countdowns and volume intensity help in better risk management by providing traders with more data on market sentiment and potential volatility.

DOP - Load-Level Identification & Setup Assistant (L.I.S.A)This toolkit is made up of more than 3+ innovative indicators that have been designed to assist people in trading smart-money concepts. Get access to a variety of trading tools & relevant data all within one indicator to create your own, smart-money trading strategy.
Catering To SMART-Money Trading Styles
Our toolkit works in any market & allows users to:
• Detect the trend of the market by displaying real-time changes in market structure.
• Detect institutional activity in the market by highlighting structural changes.
• Get automatic order block support and resistance levels in real-time to assist with order entry placement and target take profit levels.
• Timely removal of order blocks that have been run through to give a clear picture of current market structure.
How Does It Work?
The algorithm tracks key pivot points within market data and when these are broken by price movements it provides key information to the user such as when it broke structure, where it broke structure and what levels are now considered support and resistance.
Trend Bar Colouring
The trend bar colouring feature provides a clear visual indication of the market trend by colouring candles red or green depending on the last break in market structure.
Market Structure Breaks
Breaks in market structure are displayed with a single line between two candles, this indicates that there may have been a shift in market trend.
Order Block Levels
Once structure breaks it creates support and resistance levels which can help in trade entries and deciding on take profit targets; these are displayed in real-time with colour coded boxes at either the support or resistance levels. If a level has been broken it is automatically removed from the chart to give a clear representation of the current market state.
If you are using this script you acknowledge past performance is not necessarily indicative of future results and there are many more factors that go into being a profitable trader.
You can see the Author's instructions below to get instant-access to this indicator.
FXC Order Block Finder █ OVERVIEW
The FXC Order Bock Finder finds and draws institutional order blocks according to the Smart Money Concept. Order blocks are zones where institutions have most likely left some orders that need to be filled at a later point in time. In These order blocks or POIs can be used to either place limit orders or to look for instant entries as price comes to retest the zone. It works on all time frames but higher time frames tend to be more precise.
█ HOW DOES IT WORK?
The indicator waits for a break of structure (BOS) and then prints a zone if there's an engulfing pattern and an open imbalance. Basically it draws zones where a fake move followed by aggressive buying or selling happened and Imbalances were left open.
█ WHAT MAKES IT UNIQUE?
Apart from the fact that I haven’t found any indicator that is able to properly draw order blocks most indicators do re-paint which doesn’t make any sense in the case of the Smart Money Concept.
Furthermore does this indicator have settings that let’s you adjust how the order blocks are drawn. From wick to end of the imbalance or candle close to imbalance. Also you can set how many candles it takes into consideration for the imbalance in case the imbalance starts after the engulfing pattern has formed. And you can set how many candles have to checked to determine a BOS or an internal BOS by using fractal breaks.
█ HOW TO USE IT?
Either place sell limits at the lower end of the order block with SL slightly above the OB and buy limits at the upper end of the OB with SL slightly below the OB. Target a fixed Risk Reward Ratio or trade it to the next order block. By using multi time frame analysis you can determine the overall direction of the market and prevent low probability trades. Also worth mentioning is that order blocks that have been created during high volume sessions tend to result in way better trades than with order blocks that have been printed during the Asia session.
█ ADDITIONAL INFO
As soon as price retested an order block the order block is mitigated and therefore not valid anymore. Also order blocks that are too far back in time are less probable to deliver good trades. In general the win rate tends not to be too high using this method but more often than not there's a reaction as price taps into an order block and trades with high RRR are quite often. As always in trading, proper money management and risk management is key.
█ DISCLAIMER
This is not financial advice. The Indicator spots these zones according to the smart money concept . However there's absolutely no guarantee that a nice order blocks results in a good trade.
█ Examples

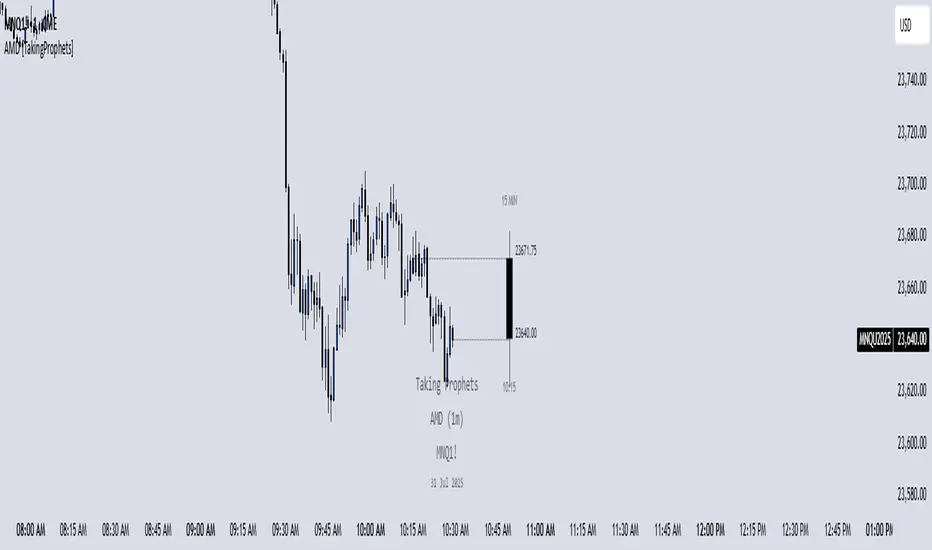
AMD [TakingProphets]Accumulation Manipulation Distribution – Real-Time HTF Candle Projection for ICT/SMC Traders
Accumulation Manipulation Distribution (AMD) is a premium, real-time indicator designed for traders who use ICT and Smart Money Concepts (SMC). It projects higher timeframe (HTF) candles directly onto your lower timeframe chart, allowing you to monitor institutional price behavior without switching timeframes.
By continuously tracking the open, high, low, and close (OHLC) of active HTF candles, AMD helps traders interpret whether the market is in a phase of accumulation, manipulation, or distribution—a key concept for understanding institutional order flow.
Core Features and How It Works
1. Live HTF Candle Visualization
Displays complete HTF candles — including body and wicks — in real time.
Provides immediate higher timeframe context for lower timeframe execution.
Supports any timeframe from 1 minute to monthly.
2. Real-Time OHLC Projections
Projects the open, high, low, and current close of the active HTF candle as it develops.
Acts as evolving reference points for support, resistance, and directional bias.
Fully customizable with adjustable colors, line styles, and labels.
3. Session Timing and Labeling
Optional time labels mark candle openings and help anticipate session closes.
Supports 12-hour and 24-hour formatting for flexibility across markets.
4. Complete Visual Customization
Configure candle width, wick transparency, border color, and projection lines.
Maintain a clean, professional overlay that aligns with your preferred charting style.
How to Use AMD
Determine HTF Bias: Identify whether the active candle is expanding in your trade direction or showing signs of rejection.
Track Price Reaction: Monitor how price interacts with projected HTF highs, lows, and midpoints—especially during ICT killzones or after liquidity events.
Anchor Lower Timeframe Entries: Combine AMD with tools like Order Blocks, Liquidity Levels, or Rejection Blocks to confirm high-probability Smart Money setups.
This approach allows traders to synchronize LTF executions with HTF market structure, enhancing clarity and confidence in trade selection.
SIP SmartlyIntroduction:
The SIP Smartly indicator is designed to mimic the behavior of a systematic investment plan, a popular investment strategy where a fixed quantity of an asset is purchased at regular intervals, typically monthly. In this case, we're applying this concept to trading by specifying a start date, a fixed purchase quantity, and certain conditions for buying.
Indicator Components:
User Inputs:
1. Start Date Inputs:
startyear, startmonth, startday: These inputs allow you to specify the year, month, and day when the SIP strategy begins.
2. buyQty:
This input allows you to specify the quantity of the security to purchase in each SIP installment.
What is Standard SIP ?
A Standard Systematic Investment Plan (SIP) is an investment strategy where individuals consistently invest a fixed amount of money at regular intervals, such as monthly or quarterly, in mutual funds or stocks. This approach promotes disciplined and long-term investing, taking advantage of rupee-cost averaging, where more shares are purchased when prices are low and fewer when prices are high. SIPs are designed for individuals seeking gradual wealth accumulation over time while mitigating the impact of market volatility through consistent, automated investments.
Logic of the Smart SIP Indicator:
Dynamic Quantity: The Smart SIP indicator allows you to invest a fixed quantity of a security at regular intervals based on technical analysis conditions. This is different from a standard SIP, where you typically invest a fixed amount of money.
Technical Analysis Driven: The Smart SIP indicator employs technical analysis indicators, such as multiple moving averages and uses the crossover of a higher MA with a lower MA which indicates a possible trend reversal, to determine Buy signals based on price trends. In contrast, a standard SIP doesn't consider technical factors but rather involves regular investments regardless of market conditions.
Adaptability: Unlike a standard SIP, which follows a predetermined investment schedule, the Smart SIP can adapt to changing market conditions. It triggers Buy actions only when specific technical conditions are met, providing a more flexible and responsive approach to investing or trading.
Market Value Tracking: The Smart SIP continuously tracks the market value of the invested quantity in real-time. This allows you to monitor the performance of your SIP investments dynamically, considering market fluctuations. In a standard SIP, you typically track the overall portfolio value without real-time adjustments.
Alert Notifications: The Smart SIP can send alert notifications when Buy conditions are met. This feature ensures timely execution of trades when favorable market conditions align with the technical criteria. In a standard SIP, you usually follow a fixed investment schedule without real-time alerting.
In summary, the unique logic of the Smart SIP indicator lies in its adaptability, technical analysis-driven approach, and real-time tracking and alerting features, making it well-suited for trading in financial markets while still following the concept of a systematic investment plan.
How to Use the SIP Smartly Indicator:
Start Date Selection:
Input your desired start date using the startyear, startmonth, and startday parameters. This is the date when your SIP strategy will begin.
Buy Quantity Setting:
Set the buyQty input to the quantity of the security you want to purchase in each SIP installment.
Alerts:
The indicator can trigger alerts when Buy conditions are met. These alerts can be configured to notify you when it's time to make a SIP installment.
Risk Management and Considerations:
Confirmation: While the SIP Smartly indicator provides insights, use it alongside other technical and fundamental analysis tools for confirmation before making trading decisions.
Backtesting: Before using this indicator in live trading, conduct thorough backtesting on historical data to evaluate its performance under different market conditions.
Position Sizing: Determine your position size and risk management rules based on the quantity purchased in each SIP installment.
Market Awareness: Stay informed about market conditions and news events that could impact price movements. This indicator is a tool to aid your trading strategy, not a standalone solution.
Conclusion:
The SIP Smartly Indicator offers a systematic approach to trading by simulating a SIP strategy. By inputting your start date and desired buy quantity, you can follow a disciplined investment approach in your trading. Remember to customize the inputs to match your trading preferences and risk tolerance.
Disclaimer: This indicator is provided for educational purposes and should be used with caution. Trading involves risks, and you should thoroughly test any strategy before applying it in live trading.

ATHENS Gold ICT + Smart Money [Advanced Signals]🎯 ADVANCED ICT + SMART MONEY CONFLUENCE INDICATOR
This indicator combines Inner Circle Trader (ICT) concepts with Smart Money theory to deliver high-probability trading signals based on institutional order flow and market structure.
━━━━━━━━━━━━━━━━━━━━━━━━━━━━━━━━━━━━━━━━
⚡ KEY FEATURES:
✅ ICT CONFLUENCE SYSTEM (0-4 Score)
• Order Blocks (Institutional Entry Zones)
• Fair Value Gaps (Price Imbalances)
• Liquidity Sweeps (Stop Hunt Detection)
• Market Structure (BOS & ChoCh)
✅ SMART SIGNALS
• Signals only trigger with minimum confluence
• Customizable requirements (OB/FVG/Liquidity)
• Filters out low-quality setups
• Higher win rate potential (65-85%)
✅ VISUAL COMPONENTS
• Order Blocks (OB+ / OB-)
• Fair Value Gaps (FVG↑ / FVG↓)
• Liquidity Zones (💧 markers)
• Break of Structure (BOS)
• Change of Character (ChoCh)
✅ PERSISTENT TP/SL LINES
• Entry, Stop Loss, TP1, TP2
• Automatically calculated from OB levels
• Lines extend across chart canvas
• Clear risk:reward visualization
✅ SMART DASHBOARD
• Real-time confluence score
• Component status (OB/FVG/Liquidity)
• Trend direction & RSI
• Signal strength indicator
━━━━━━━━━━━━━━━━━━━━━━━━━━━━━━━━━━━━━━━━
🎯 HOW IT WORKS:
The indicator scores each setup based on 4 key components:
1️⃣ ORDER BLOCK PRESENCE
• Bullish OB = Last bearish candle before strong move up
• Bearish OB = Last bullish candle before strong move down
• Price must be in OB zone
2️⃣ FAIR VALUE GAP (FVG)
• Gap between 3 candles indicating imbalance
• Price tends to fill these gaps
• Bounce from FVG = high probability entry
3️⃣ LIQUIDITY SWEEP
• Price sweeps recent high/low
• Retail stop losses triggered
• Smart money enters opposite direction
4️⃣ MARKET STRUCTURE
• Bullish = HH + HL
• Bearish = LH + LL
• Confirms trend direction
CONFLUENCE SCORE:
- 4/4 = Excellent (75-85% win rate)
- 3/4 = Good (65-75% win rate)
- 2/4 = Moderate (55-65% win rate)
- 1/4 = Weak (avoid)
━━━━━━━━━━━━━━━━━━━━━━━━━━━━━━━━━━━━━━━━
⚙️ CUSTOMIZABLE SETTINGS:
SIGNAL REQUIREMENTS:
- Require Order Block (ON/OFF)
- Require FVG (ON/OFF)
- Require Liquidity Sweep (ON/OFF)
- Minimum Confluence (1-4)
VISUAL SETTINGS:
- Show/Hide OB, FVG, BOS, ChoCh
- Adjustable lookback periods
- Customizable colors
- Line extension length
RISK MANAGEMENT:
- Risk:Reward ratio (1:1 to 5:1)
- Stop Loss buffer (%)
- Auto TP/SL calculation
- Clear old lines option
━━━━━━━━━━━━━━━━━━━━━━━━━━━━━━━━━━━━━━━━
📈 RECOMMENDED SETTINGS:
CONSERVATIVE (High Quality):
- Require OB: ON
- Require FVG: ON
- Min Confluence: 3/4
- Result: 1-2 signals/day, 70-80% win rate
BALANCED (Recommended):
- Require OB: ON
- Require FVG: OFF
- Min Confluence: 2/4
- Result: 2-4 signals/day, 60-70% win rate
AGGRESSIVE (More Signals):
- Require OB: OFF
- Require FVG: OFF
- Min Confluence: 2/4
- Result: 3-6 signals/day, 55-65% win rate
━━━━━━━━━━━━━━━━━━━━━━━━━━━━━━━━━━━━━━━━
🎯 BEST PRACTICES:
✅ Trade 3/4 or 4/4 confluence signals only
✅ Confirm with higher timeframe (H4/Daily)
✅ Trade during kill zones (London/NY open)
✅ Use proper position sizing (1-2% risk)
✅ Wait for all components to align
✅ Respect stop losses
✅ Take partial profits at TP1
❌ Don't trade 1/4 confluence signals
❌ Don't ignore liquidity sweeps
❌ Don't trade against higher TF trend
❌ Don't overtrade (quality > quantity)
━━━━━━━━━━━━━━━━━━━━━━━━━━━━━━━━━━━━━━━━
⚡ SIGNAL TYPES:
🟢 BUY SIGNAL (Green Triangle)
- Appears when bullish confluence met
- Label shows "BUY ICT"
- Blue entry line + Red SL + Green/Lime TPs
- Long opportunity
🔴 SELL SIGNAL (Red Triangle)
- Appears when bearish confluence met
- Label shows "SELL ICT"
- Blue entry line + Red SL + Green/Lime TPs
- Short opportunity
━━━━━━━━━━━━━━━━━━━━━━━━━━━━━━━━━━━━━━━━
📊 SUITABLE FOR:
- Gold (XAUUSD) - Optimized
- Forex pairs (Major pairs)
- Indices (US30, NAS100, SPX500)
- Crypto (BTC, ETH - adjust settings)
Recommended Timeframes:
- 15M - Primary for scalping
- 5M - Entry refinement
- 1H - Swing trading
- H4/Daily - Trend confirmation
━━━━━━━━━━━━━━━━━━━━━━━━━━━━━━━━━━━━━━━━
⚠️ DISCLAIMER:
This indicator is for educational purposes only. Past performance does not guarantee future results. Always:
- Practice on demo account first
- Use proper risk management
- Never risk more than you can afford to lose
- Seek professional financial advice
- Understand that trading carries risk
━━━━━━━━━━━━━━━━━━━━━━━━━━━━━━━━━━━━━━━━
🎓 BASED ON:
- ICT (Inner Circle Trader) Concepts
- Smart Money Theory
- Order Flow Analysis
- Institutional Trading Zones
- Market Structure Theory
━━━━━━━━━━━━━━━━━━━━━━━━━━━━━━━━━━━━━━━━
📢 FEATURES SUMMARY:
✅ Confluence-based signals (not random)
✅ Order Blocks + FVG + Liquidity integration
✅ Persistent TP/SL lines (scroll-friendly)
✅ Smart dashboard (real-time info)
✅ Customizable requirements
✅ High-probability setups
✅ Professional trading approach
✅ Works on multiple assets
✅ Clean visual presentation
✅ Beginner to advanced friendly
━━━━━━━━━━━━━━━━━━━━━━━━━━━━━━━━━━━━━━━━
Trade smart. Trade with confluence. 🎯
#ICT #SmartMoney #OrderBlocks #FVG #Gold #Forex #TradingStrategy #Confluence

[TehThomas] - ICT Rejection BlocksWhat Are Rejection Blocks?
Rejection Blocks are price zones formed when a candle attempts to push through a level, gets rejected with force, and then closes in the opposite direction. This price action creates a “block” that reflects clear intent from smart money participants. These blocks are typically marked by a large wick that fails to close beyond a key high or low, followed by a body that closes back inside the previous range. The zone around the candle body becomes a footprint of where buyers or sellers aggressively stepped in, often defending that level with size.
Why Rejection Blocks Matter to Smart Money Traders
In any smart money model, understanding where large players are active is key. Rejection Blocks highlight exactly that. These zones often sit just above inducement highs or below engineered lows, where liquidity was taken before displacement occurred. By identifying where price got rejected with conviction, traders can spot the origin of institutional interest. These levels often act as magnets for retracement and can provide high-probability entries when price trades back into them. The best part is they often line up with other SMT elements like Fair Value Gaps, Breaker Blocks, or market structure shifts, allowing for strong confluence-based setups.
How the Indicator Works and Why It’s Effective
This script is designed to do one thing exceptionally well, automatically detect and display clean, high-quality rejection blocks. It filters out noise and only marks candles that meet strict rejection criteria. That means long wicks showing failed pushes, and bodies that close convincingly in the opposite direction. The indicator then draws a box over the candle body to mark the rejection zone. These boxes help map out areas where price is likely to react or stall in the future. By automating this process, the indicator saves time, improves consistency, and removes guesswork. You no longer have to manually scan charts or second-guess if a level is valid, the tool handles it for you.
What This Adds to Your Trading Workflow
This tool fits perfectly into any smart money strategy built around liquidity, displacement, and market structure. It helps you focus on the most meaningful zones, especially when price sweeps a high or low and leaves behind a reversal. Whether you trade breakouts, reversals, or liquidity setups, Rejection Blocks give you a visual confirmation of where price got turned away. They act as future entry zones, rejection points, or even stop placement areas. You can pair them with your Fair Value Gap entries, or use them to validate the direction of a shift in structure. This is the type of tool that simplifies your chart without losing precision.
Optimized for Focus and Clarity
There’s no clutter, no overload of options, and no distractions. Just clean, focused rejection zones that update in real-time. The boxes stay until invalidated, giving you a static map of relevant zones without recalculating on every bar. This makes it ideal for traders who want to plan entries, set alerts, or manage risk without redrawing levels every session. Whether you scalp on the 5M or swing trade using the 4H, this tool helps lock in the zones where price already told you something important, rejection with force.
Conclusion
The Rejection Blocks indicator is for traders who want cleaner charts, smarter levels, and more conviction behind every entry. It isolates zones where price showed clear rejection and turns them into actionable blocks that fit seamlessly into any smart money strategy. If you rely on liquidity sweeps, displacement, and reaction-based entries, this tool brings clarity and consistency to your edge. Just turn it on and let it show you where real rejection occurred.
Example of how to use it

[AlbaTherium] MTF Internal Ranges Analysis - IRA-Phoenix for SMCIntroduction:
The MTF Internal Ranges Analysis - IRA - Phoenix acts as an extension to the original main SMC Indicator by AlbaTherium . This add-on provides insights into multi-timeframe internal structure points, swing structure points, POIs (Points of Interest), and order blocks (OB). By integrating this enhancement, your multi-timeframe analyses become more streamlined, expediting the process and minimizing chart workload .
This tool represents an advanced smart money technical analysis aimed at enhancing your trading experience. It introduces four pivotal concepts:
Main Features:
Multiple Timeframes and Confluences,
SCOB Internal Order Block.
Demand to Supply (D2S) or Supply to Demand (S2D) across Multiple timeframes
SCOB on LTF and SCM on HTF across same Candle
By combining these concepts all in one, traders can find confluences zones across multiple timeframes and gain a comprehensive understanding of market dynamics, theses confluences zones empower order block skills and potentiality, showcasing them as essential, crucial, powerful, strategic, and pivotal, one of the pillars in smart money concepts trading strategy to make more informed decisions.
Settings Overview:
Select timeframe {Select or current chart}
Inside bar ranges
Internal structure as Internal zigzag {turn on/ off / unconfirmed(live) zigzag}
Single Candle Mitigation Pattern {turn on/ off / confirmed / unconfirmed}
Single Candle Order Block Pattern {turn on/ off / confirmed / unconfirmed}
Demands and Supplies (D&S) {turn on/ off / confirmed / unconfirmed}
OB Mitigation {touch/ extended}
Understanding the Features:
Chapter 1: Multiple Timeframes and Confluences
Our Multi-timeframe analysis approach enables traders to analyze market trends and volatility across different timeframes. Confluences, where signals align across multiple timeframes, provide strong indications for trading opportunities.
Practical Example:
- With MTF IRA - Phoenix , traders can seamlessly transition between different timeframes while maintaining a cohesive analysis. For instance, traders can monitor the M15, H1, or M5 charts while focusing on entry on the M1 timeframe, enabling a holistic view of market trends and opportunities .
Chapter 2: SCOB Internal Order Block across Multiple Timeframe
SCOB Internal Order Block (SCOB IOB) highlights critical zones in price action, showcasing the dominance of aggressive buyers or sellers on orders blocks. As confluences accumulate across multiple timeframes, the strength of the order block intensifies, presenting entry opportunities.
Practical Example:
You have the ability to detect zones where price ranges have formed; these areas are highly sought after for taking buying as well as selling positions, especially when these areas are reflected across 1 or 3 timeframes.
The only practical way to see theses confluences is to use this Indicator, see the example below
Chapter 03: Demand to Supply (D2S) or Supply to Demand (S2D) across Multiple timeframes
The Demand to Supply or Supply to Demand feature within MTF Internal Ranges Analysis - IRA - Phoenix offers a nuanced analysis of price action dynamics across various timeframes. By identifying shifts in supply and demand zones, traders gain valuable insights into market sentiment and potential price reversals.
This feature enables traders to anticipate changes in market direction by recognizing the interplay between demand and supply across different timeframes. By understanding how price reacts at key support and resistance levels, traders can make informed decisions and capitalize on emerging trends.
The Demand to Supply or Supply to Demand feature enhances the indicator's usefulness by providing traders with actionable information to navigate complex market conditions effectively. With this comprehensive analysis, traders can better manage risk and optimize trading strategies across multiple timeframes.
Real-world Example:
Chapter 04: SCOB on LTF and SCM on HTF across same Candle
with MTF Internal Ranges Analysis - IRA - Phoenix , explores the concepts of SCOB (Single Candle Order Block) on Lower Timeframes (LTF) and SCM (Single Candle Mitigation) on Higher Timeframes (HTF).
SCOB on LTF refers to the identification and analysis of single candle order blocks within shorter timeframes. These blocks represent critical price levels where significant buying or selling activity occurred within a single candlestick. By recognizing SCOB patterns, traders can pinpoint key areas of market interest and anticipate potential price movements.
On the other hand, SCM on HTF involves analyzing single candle mitigation entries within longer timeframes. This technique aims to capitalize on price reversals or shifts in market sentiment indicated by single candlestick patterns. By incorporating SCM analysis, traders can gain insights into broader market trends and make strategic trading decisions accordingly.
the intricacies of SCOB on LTF and SCM on HTF, offering traders valuable tools to enhance their analysis and decision-making processes across different timeframes. Through a comprehensive understanding of these concepts, traders can identify high-probability trading opportunities and navigate the markets with confidence.
Real-world Example:
SCOB on M5 and SCM on M15 generate a powerful order block.
Conclusion:
MTF Internal Ranges Analysis - IRA - Phoenix for Smart Money Concepts is a valuable asset for traders seeking to add more insights in today's dynamic markets especially for Intraday Traders. By focusing on concepts like "Multiple timeframes and Confluences, with one single timeframe u can analyze all timeframes", "SCOB Internal Order Block. With its innovative features and user-friendly interface, whether you're a seasoned trader or just starting your journey, MTF IRA - Phoenix can help you navigate through the complexities of price action and make more informed trading choices.
This document provides an extensive overview of MTF Internal Ranges Analysis - IRA - Phoenix, emphasizing its importance in comprehending market dynamics and utilizing essential smart money concepts trading principles.

Khosro XAUUSD Strategy [TradingFinder] Trading Room Hunter Setup🔵 Introduction
The Trading Room Hunter (TRH) strategy is an analytical model based on the Smart Money Concept, developed by Khosro, an Iranian international trader based in Dubai. This approach is built upon a deep understanding of liquidity engineering, market structure shifts, and institutional order flow. Its core objective is to identify the so-called TRH Zone, the area where market liquidity gets trapped and institutional investors begin accumulating positions. Unlike traditional indicator-based methods, the TRH Zone focuses purely on price behavior and supply & demand dynamics to pinpoint the most precise reversal zones in the market.
Within Smart Money logic, every impulsive move in price results from the displacement or absorption of liquidity in a specific range. In the TRH model, the last pivot preceding the impulsive move (Origin Pivot) is defined as the Distal Line, and the Break Candle, which disrupts the market structure, forms the Proximal Line. The area between these two points defines the Trading Room Hunter Zone, a reaction zone where price, after creating a displacement or Break of Structure (BoS), often returns to fill an imbalance and provide a precision entry opportunity.
In essence, the TRH Zone is the region where smart money seeks re-entry after a liquidity sweep and a confirmed CHoCH or BoS. It frequently lies between supply/demand boundaries and fair value gaps (FVGs), forming one of the strongest decision-making frameworks within modern price-action theory. Due to its structural accuracy, the TRH setup can also function as a Set & Forget Setup, where the trader defines the zone, places a limit order, and lets the market naturally react, eliminating emotional decision-making and allowing for automated execution aligned with institutional logic.
🔵 How to Use
In the TRH strategy, entries are taken based on price returning to the area between the last impulsive pivot and the break candle. This range (the TRH Zone) represents the region where liquidity from the previous move remains concentrated. Before continuing its main direction, price often revisits this zone to fill imbalances or mitigate unfilled orders. The logic is simple: every explosive move originates from a point where large orders were executed, and TRH precisely highlights that institutional footprint.
🟣 Bullish Setup
When the market breaks a structural high after a strong bearish leg, liquidity shifts from sellers to buyers. The last bearish candle before the breakout marks the origin of the bullish move, and the zone between that candle and the break candle becomes the smart-money entry area. As price revisits this zone and signs of exhaustion in selling pressure appear, that’s the optimal point for a long position. Stop-loss is placed slightly below the origin pivot, and targets are set at the next supply zone or upper liquidity pool.
🟣 Bearish Setup
Conversely, when the market breaks a structural low after a sharp bullish leg, liquidity transitions from buyers to sellers. The last bullish candle before the drop is identified as the origin pivot, while the bearish break candle defines the lower boundary of the zone. The range between these two points forms the TRH Supply Zone, where late buyers are trapped and fresh institutional selling begins. As price retraces into this zone, short entries can be placed near the upper boundary, with stops above the pivot and targets toward the next liquidity pool below.
Because of its structural precision and clearly defined reaction behavior, TRH is one of the most effective Set & Forget setups in Smart Money trading. Simply mark the zone, place your order, and let the market do the rest.
🔵Setting
🟣 Spike Filter | Movement
Minimum Spike Bars : Defines the minimum number of consecutive candles required for a valid spike.
Movement Power : Enables or disables the momentum-based spike filter.
Movement Power Level : Sets the strength threshold; higher values filter out weaker moves and only detect strong spikes.
Pivot Period : Defines the lookback range used to detect swing highs and swing lows in market structure. A higher value smooths out smaller fluctuations and focuses on major pivots, while a lower value increases sensitivity and identifies minor turning points more frequently.
🟣 Position Management
Stop-Loss Threshold : Enables or disables the stop-loss threshold feature.
Stop-Loss Threshold Value : Defines the value of the stop-loss threshold for risk management.
Risk-Reward Ratio : Sets the desired risk-to-reward ratio (e.g., 1:1 or 1:2).
Wide Zone Filter : Filters out zones that exceed a defined width threshold, preventing detection of overly broad TRH areas.
🟣 Display Settings
Display Mode : Chooses between Setup (showing setups) or Signal (showing trade signals).
Show Entry Levels : Displays entry levels on the chart (buy/sell zones) when enabled
Only Display the Last Position : Displays only the most recent position on the chart when enabled.
Setup Width Drawing : Adjusts the visual width of the setup drawings on the chart for better visibility.
🔵 Conclusion
The TRH strategy is a precise structural model of liquidity flow that identifies zones where smart money is most likely to enter and where price is most likely to react. By combining the Origin Pivot and Break Candle, TRH isolates the key areas that drive institutional order flow. Without relying on indicators, it focuses purely on price structure, making it highly effective for both reactive entries and Set & Forget setups.
Ultimately, TRH creates a balance between market structure and liquidity flow, enabling traders to identify institutional decision zones on the chart with minimal risk and maximum clarity

Machine Learning-Inspired Supply & Demand Zones [AlgoPoint]This indicator is a Smart Supply & Demand Zone tool, developed with principles inspired by Machine Learning (ML). It intelligently filters out market noise, allowing you to focus only on the most significant zones where institutional order flow is likely present.
💡 How It Works: Why Is This Indicator "Smart"?
Unlike traditional indicators that only measure simple price movements, this script uses an algorithm that asks the same critical questions an experienced market analyst would to qualify a zone:
- 1. Price Imbalance: How fast and aggressively did the price leave the zone? Our algorithm measures the body size of the "departure candle" relative to the current market volatility (ATR). A zone is only considered if it was formed by an explosive move that is statistically significant, indicating a major imbalance between buyers and sellers.
- 2. Volume Confirmation: Did the "smart money" participate in this move? The script checks if the volume on the departure candle was significantly higher than the recent average volume. A spike in volume confirms that the move was backed by institutional interest, adding strength and validity to the zone.
- 3. Valid Pivot Structure: Did the zone originate from a meaningful swing high or low? The algorithm first identifies a valid pivot structure, ensuring that zones are not drawn from insignificant or random price fluctuations.
Only when a potential zone passes these three critical tests—our "quality filter"—is it drawn on your chart.
🚀 Features & How to Use
Using the indicator is straightforward. You will see two primary types of boxes on your chart:
* 🟥 Red Box (Supply Zone): An area of potential resistance where selling pressure is likely to be strong. Look for potential shorting opportunities as the price approaches this zone.
* 🟩 Green Box (Demand Zone): An area of potential support where buying pressure is likely to be strong. Look for potential long opportunities as the price pulls back into this zone.
Dynamic Zone Management
This indicator is not static; it lives and breathes with the market:
- Fresh Zone: A newly formed zone appears in its full, vibrant color. These are the highest-probability zones as they have not yet been re-tested.
- Broken / Flipped Zone: You have full control over what happens when a zone is broken! In the settings, you can choose:
- Delete Zone: The zone will be removed completely when the price closes through it.
- Show as Broken (Flip): When broken, the zone will turn gray, stop extending, and remain on your chart. This is extremely useful for identifying Support/Resistance Flips, where a broken demand zone becomes new resistance, or a broken supply zone becomes new support.
⚙️ Settings & Customization
Fine-tune the indicator to match your personal trading style via the settings menu:
- Breakout Behavior: The most powerful feature. Choose between Delete Zone and Show as Broken (Flip) to customize your chart.
- Zone Finding Logic: Control the indicator's sensitivity.
- Selective: Requires both strong imbalance and high volume. Finds fewer, but higher-quality, zones.
- Moderate: Requires either strong imbalance or high volume. Finds more potential zones.
- Sensitivity Settings: Adjust the ATR Multiplier and Volume Multiplier to make the criteria for a "strong" zone stricter or looser.

ICT Market Structure Screener (Zeiierman)█ Overview
The ICT Market Structure Screener (Zeiierman) is designed to identify and display key market structure levels and patterns based on Smart Money Concepts. It highlights bullish and bearish structures, premium and discount levels, and generates alerts for significant market structure changes, making it a valuable tool for traders looking to understand institutional trading behaviors and market trends. A key feature of this indicator is its screener function, which allows traders to monitor multiple symbols simultaneously. This feature provides a consolidated view of the market structure for various assets, making it easier to identify trading opportunities across a diverse portfolio.
█ How It Works
The ICT Market Structure Screener operates by identifying high and low pivot points within a specified period, then analyzing these pivots to determine changes in market structure. The indicator tracks price movements and categorizes them into bullish or bearish structures, indicating potential trend reversals or continuations. By plotting premium and discount levels, it helps traders identify overbought and oversold conditions. The indicator also provides real-time updates and alerts for significant changes in the market structure.
█ Terminology
ChoCH (Change of Character): Indicates a potential reversal in market direction. It is identified when the price breaks a significant high or low, suggesting a shift from a bullish to bearish trend or vice versa.
SMS (Smart Money Shift): Represents the transition phase in market structure where smart money begins accumulating or distributing assets. It typically follows a BMS and indicates the start of a new trend.
BMS (Bullish/Bearish Market Structure): Confirms the trend direction. Bullish Market Structure (BMS) confirms an uptrend, while Bearish Market Structure (BMS) confirms a downtrend. It is characterized by a series of higher highs and higher lows (bullish) or lower highs and lower lows (bearish).
Premium: A zone where the price is considered overbought. It is calculated as the upper range of the current market structure and indicates a potential area for selling or shorting.
Mid Range: The midpoint between the high and low of the market structure. It often acts as a support or resistance level, helping traders identify potential reversal or continuation points.
Discount: A zone where the price is considered oversold. It is calculated as the lower range of the current market structure and indicates a potential area for buying or going long.
█ How to Use
The ICT Market Structure Screener allows traders to follow smart money moves in the market more effectively. By identifying key market levels and monitoring bullish and bearish structures, traders can easily spot trend changes and strong trends. The indicator's premium and discount levels help identify overbought and oversold conditions, providing valuable entry and exit points. Alerts for ChoCH, SMS, and BMS keep traders informed about significant market changes, enabling real-time adjustments to trading strategies.
The screener functionality is particularly valuable for monitoring multiple markets simultaneously. The screener table displays critical information such as current price, trend direction, signal type, and premium/discount levels for each symbol. This makes it easier to track the market structure of various assets at a glance and quickly identify trading opportunities across different markets.
Example Strategies:
⚪ Trend Following: Use the indicator to identify the current market trend (bullish or bearish) and trade in the direction of the trend. Enter trades on pullbacks to premium (for shorts) or discount (for longs) levels.
⚪ Reversal Trading: Look for ChoCH signals to identify potential trend reversals. Enter trades when the price breaks a significant high or low and confirms a change in market structure, or wait for a retest of the nearest Orderblock that was formed.
⚪ Support and Resistance: Utilize the mid-range, premium, and discount levels as support and resistance zones. Enter trades when the price approaches these levels and shows signs of reversal or continuation.
⚪ Multi-Symbol Analysis: Use the screener table to monitor multiple symbols and quickly assess their market structure. This helps in diversifying trading opportunities and managing a portfolio of assets efficiently.
█ Settings
Period: The pivot period for calculating the structure. Increasing the period captures broader trends, making the structure more representative of long-term movements. Decreasing the period focuses on shorter-term trends, increasing sensitivity.
Response: Enabling this option uses the response period instead of the pivot period, providing more flexibility in capturing short-term or long-term structures. The period for the response, which determines the structure's sensitivity. Increasing the response period smoothens the structure, making it less reactive to short-term fluctuations. Decreasing the response period makes the structure more responsive to short-term changes.
Structure Display: Choose between displaying the active range or the previous range. 'Active Range' shows real-time premium, discount, and mid-range levels based on the current structure. 'Previous Range' displays past ranges, useful for analyzing historical support/resistance levels.
Ticker Symbols: List of symbols to include in the screener. Enabling the option includes the symbol in the screener, allowing the user to track its structure. Disabling it excludes the symbol from the screener, reducing the number of tracked symbols.
-----------------
Disclaimer
The information contained in my Scripts/Indicators/Ideas/Algos/Systems does not constitute financial advice or a solicitation to buy or sell any securities of any type. I will not accept liability for any loss or damage, including without limitation any loss of profit, which may arise directly or indirectly from the use of or reliance on such information.
All investments involve risk, and the past performance of a security, industry, sector, market, financial product, trading strategy, backtest, or individual's trading does not guarantee future results or returns. Investors are fully responsible for any investment decisions they make. Such decisions should be based solely on an evaluation of their financial circumstances, investment objectives, risk tolerance, and liquidity needs.
My Scripts/Indicators/Ideas/Algos/Systems are only for educational purposes!

True SMCThe True SMC Indicator is specifically designed for structure mapping and the identification of high-probability Order Blocks. Excelling in distinctly recognising four types of Order Blocks, it provides traders with a direct and efficient method to dissect market movements and identify strategic entry points with precision
🔶 Understanding Structure Mapping
This indicator introduces a unique approach to analysing market structure, focusing on liquidity, which is termed 'Inducement'. Inducement is crucial for identifying key structural markers in the market, such as Higher Highs (HH), Higher Lows (HL), Lower Lows (LL), and Lower Highs (LH).
Inducement acts like a trap set near a supply or demand zone. It entices impatient buyers or sellers into the market before the actual zone is reached, thereby creating liquidity. For an inducement to be considered valid, it must represent a valid pullback.
A valid scenario occurs when the price sweeps or closes beyond the high or low of the previous candle; in this case, the candle's color, whether bullish or bearish, is not relevant, and both scenarios are considered valid. Inside bars are ignored as they do not meet this criterion. The indicator assists in this process by automatically highlighting valid pullbacks with a distinctive gray round label.
This feature is not just a visual aid but also a crucial tool in effortlessly understanding market movements, providing a clear visual representation of ongoing market trends.
🔶 Understanding How Order Block is working
Our indicator incorporates four distinct types of Order Blocks, each designed for specific roles in market analysis. Among these, the **OB-IDM** and **OB-EXT** are regarded as high-probability Order Blocks, and our primary focus is on these two for market entry.
IDM Order Block (OB-IDM): IDM Order block (OB-IDM) is basically the first Order Block that shows up after the IDM level is passed. Think of it as the closest OB you find below the current IDM.
Extreme Order Block (OB-EXT): OB-EXT is the first and lowest Order Block that you'll find between a Major Low and a Major High.
Single Candle Order Block (SCOB): Single candle mitigation is very Powerful way to add multiple entries in you're winning trades.
Smart Money Trap (SMT): The SMT consists of all the Order Blocks that lie between the Extreme and OB-IDM. It acts as a cautionary signal, indicating potential traps for Smart Money Concept traders. It is essential to recognize that the SMT does not provide additional confirmation for trading. Instead, it highlights areas where traders should exercise extra caution. Trading decisions should be based on clear confirmations, such as inducements or liquidity sweeps, rather than solely on the SMT.
🔶 How to Use the True SMC Indicator:
The True SMC Indicator is designed to enhance your trading strategy by identifying key order blocks and market signals. Below is a guide on how to utilize the various elements of the True SMC Indicator:
OB IDM (Order Block Inducement):
Usage : This is a decisional order block crucial for identifying trade entries. It is particularly effective for pinpointing potential reversal zones.
Alerts: Setting up alerts on OB IDM is recommended to be notified when the price reaches this critical area, thus facilitating prompt and informed trading decisions.
OB-EXT (Extreme Order Block):
Usage : OB-EXT serves as an extreme and high-probability order block for trade entries, ideal for identifying strategic entry points at potential reversal points.
Alerts: Activating alerts on OB-EXT will keep you informed about price approaches, aiding in the preparation of your trade setups.
SCOB (Single Candle Order Block):
Usage : SCOB is ideal for scaling into a position. It should be employed for adding to positions when the market reacts to OB IDM or OB-EXT, indicating a potential reversal.
SMT (Smart Money Trap):
Usage Caution: The SMT should be approached with caution as it represents a potential trap. It is advised to avoid trading directly at SMT zones. Instead, use these zones to gauge market sentiment and make informed decisions.
This structured approach to using the True SMC Indicator will help you in making more precise and strategic trading decisions, enhancing your overall market analysis.
🔶 Example of usage:
Market Structure Diagram
This diagram illustrates the key structural markers in the market such as Higher Highs (HH), Higher Lows (HL), Lower Lows (LL), and Lower Highs (LH). It provides a visual guide to understanding the underlying market structure.
Example from a Real Chart: This chart is a prime example of how our indicator is used to dissect and highlight market structure in a live trading environment. It vividly demonstrates the 'Inducement' concept in action, pinpointing key structural points like HH, HL, LL, and LH in real-time market trends.
Valid Pullback
Illustration of a Valid Pullback: This image showcases a typical scenario where the price sweeps beyond the previous candle's high or low, marking a valid pullback. Notice the distinctive gray round label indicating the point of inducement.
IDM Order Block (OB-IDM)
This diagram illustrates the IDM Order Block (OB-IDM), highlighting its position as the first OB following the IDM level. It represents the nearest OB below the current IDM level.
IDM Order Block in Action This real chart example showcases the OB-IDM in a live market scenario, demonstrating how it appears and functions in practical trading.
Extreme Order Block (OB-EXT)
The diagram depicts the OB-EXT, which is identified as the first and lowest Order Block between a Major Low and a Major High.
OB-EXT in Real Market: This chart example highlights the OB-EXT, showing its position and significance in market analysis between major market points.
Single Candle Order Block (SCOB)
The accompanying chart demonstrates the SCOB in a live trading environment, illustrating its effectiveness in trade optimization.
Smart Money Trap (SMT)
This real chart provides insight into how the SMT is used in actual trading, marking areas for increased caution and illustrating its role in a comprehensive trading strategy.
🔶 Additional Features
Easy-to-Follow Trend Display : The script employs a Color Coded candle system, simplifying trend recognition.
Any Alert function call = It can be configured for a range of trading events, allowing you to stay informed about key market movements. In the settings, you can choose to enable or disable alerts for events such as BOS Sweep, CHock, CHock Sweep, IDM, IDM Sweep, OB IDM, OB EXT, and PDH/PDL.
Automatic resolving of ChoCh-IDM and IDM-BoS conflicts = The indicator is equipped to automatically resolve conflicts that arise between ChoCh-IDM and IDM-BoS. It intelligently identifies situations where there might be an IDM instead of a ChoCh, or a BoS instead of an IDM, ensuring accurate readings and analysis.
Anywhere Structure Mapping : The tool simplifies market analysis by enabling you to draw structures from any chosen moment. Simply adjust the slider to your desired point and instantly trade based on the internal structure revealed. This feature offers an intuitive and efficient way to understand and navigate market dynamics.
🔶 Conclusion
The True SMC Indicator distinguishes itself from other market analysis tools through its specialised focus on structure mapping and high-probability Order Blocks. Unlike generic indicators, it expertly identifies and categorizes four distinct types of Order Blocks, including IDM and Extreme Order Blocks, which are crucial for high-accuracy trade entries. Its unique approach in analysing market structure centers on 'Inducement,' a key concept for pinpointing vital market structural markers. This feature, combined with its ability to alert traders to both promising entry points and potential Smart Money Traps, equips users with a comprehensive tool for a nuanced understanding of market dynamics and strategic trade execution. Such targeted capabilities make the True SMC Indicator an invaluable asset for traders seeking precision and efficiency in their market analysis.

Volume-Confirmed FTR Zones [AlgoPoint]FTR Zone Indicator — Fail To Return Zones (With Volume Confirmation)
Advanced Smart Money Zone Detection for Institutional Orderflow
The FTR Zone Indicator is a professional-grade tool designed for traders who follow Smart Money Concepts (SMC), ICT methodologies, or institutional orderflow. It automatically detects Fail To Return Zones (FTR) — high-probability supply and demand areas formed after strong displacement moves.
By combining impulse detection, base identification, and volume confirmation, this indicator highlights zones where price is most likely to react, reverse, or mitigate shortly after structure breaks.
⸻
⭐ What Are FTR Zones?
FTR zones (Fail To Return zones) are price areas where:
1. A strong displacement / impulse candle is formed
2. That impulse originates from a small consolidation (base)
3. Price moves away aggressively
4. AND fails to return immediately to the origin area
These zones often indicate:
• Institutional orders
• Imbalance
• Hidden liquidity
• Origin of a trend leg
• High-probability mitigation points
This indicator fully automates the detection and visualization of such areas.
🔍 How the Indicator Works
1. Impulse Detection
The indicator identifies a valid impulse candle using:
• ATR-based bar range filter
• Trend-aligned candle body direction
• Optional volume confirmation
Only large, meaningful institutional candles qualify — filtering out noise.
2. Base Zone Identification
Before every impulse, the tool finds the micro-consolidation base using:
• Highest high of the last X bars
• Lowest low of the last X bars
This base becomes the potential FTR zone.
3. FTR Zone Creation
When a valid impulse is detected:
• Bullish impulse → Demand FTR zone
• Bearish impulse → Supply FTR zone
The zone is immediately drawn on the chart using box.new().
4. Zone Extension
Every zone continuously extends to the right as price evolves, allowing you to track:
• Mitigation
• Retests
• Reaction points
• Liquidity sweeps
5. Invalidation Logic
Zones automatically delete when violated:
• Demand zone invalid if close < zone low
• Supply zone invalid if close > zone high
This keeps the chart clean and helps focus only on active, high-value areas.
🎛️ Key Features
✔ Automatic FTR Zone Detection
Instantly identifies institutional origin zones based on real impulse and displacement.
✔ Volume-Based Filtering
Ensures only high-volume impulses (true institutional orders) create zones.
✔ Supply & Demand Coloring
• Bullish FTR → Demand Zone (Teal tone)
• Bearish FTR → Supply Zone (Red tone)
✔ Safe Zone Storage
Fault-tolerant logic ensures no array errors, invalid zones, or broken visuals.
✔ Auto-Extending Boxes
Real-time zone updates with precise historical mapping.
✔ Smart Invalidation
Zone is removed only when fully broken, preventing false signals.
✔ Clean, Non-Repainting Logic
Impulse detection and zone placement are confirmed only on bar close.
📈 How to Use It (Example Schenarios)
For Reversals or Continuations
• Look for price reacting or mitigating inside a zone
• Use as entry confirmation in trend continuations
• Combine with FVG, BOS/CHOCH, liquidity sweeps, or premium/discount zones
For Scalping or Intraday Trading
• High-probability countertrend entries
• Reaction-based setups at institutional footprints
For Swing Traders
• Identify weekly/daily origin zones
• Plan entries around large displacement points

Liquidity Swap Detector Ultimate - Cedric JeanjeanAdvanced Smart Money Concepts indicator designed to detect high-probability liquidity sweeps and institutional order flow reversals. This professional-grade tool combines multiple ICT (Inner Circle Trader) strategies to identify optimal entry points.
═══════════════════════════════════════════════════════
📊 KEY FEATURES:
✅ Smart Swing Detection
- Identifies confirmed swing highs and lows using adaptive lookback periods
- Eliminates false signals through double-confirmation logic
- Detects liquidity grabs at key market structure points
✅ Fair Value Gap (FVG) Analysis
- Multi-timeframe FVG detection for enhanced accuracy
- Filters imbalances by minimum size threshold
- Combines current timeframe and higher timeframe FVGs
✅ Advanced Volatility Filter
- ATR-based volatility analysis to avoid low-quality setups
- Adjustable volatility threshold (default 0.35%)
- Ensures entries during optimal market conditions
✅ Precision Signal Generation
- LONG signals: Confirmed swing lows + FVG + volatility confirmation
- SHORT signals: Confirmed swing highs + FVG + volatility confirmation
- Clear visual markers with price labels
✅ Comprehensive Alert System
- Three alert types: Simple, Detailed, JSON (for webhooks)
- Separate LONG/SHORT alert controls
- Compatible with MT5 integration via webhooks
- TradingView native alertcondition support
✅ Professional Dashboard
- Real-time ATR monitoring
- Volatility percentage display
- FVG status indicator
- Alert status tracker
═══════════════════════════════════════════════════════
⚙️ CUSTOMIZABLE PARAMETERS:
🔹 Lookback Swing (1-50): Defines swing detection sensitivity
🔹 ATR Multiplier: Controls wick filter strength
🔹 Volatility Filter: Minimum required market volatility (%)
🔹 FVG Filter: Minimum fair value gap size (%)
🔹 FVG Timeframe: Higher timeframe for multi-TF analysis
🔹 Visual Options: Toggle swing marks, FVG zones, labels
🔹 Alert Controls: Enable/disable LONG/SHORT notifications
═══════════════════════════════════════════════════════
📈 HOW IT WORKS:
1. The indicator scans for confirmed swing points using a robust double-confirmation algorithm
2. Simultaneously analyzes Fair Value Gaps on both current and higher timeframes
3. Validates market volatility to ensure sufficient price movement
4. Generates precise entry signals when all conditions align
5. Triggers customizable alerts for instant notification
═══════════════════════════════════════════════════════
🎯 BEST PRACTICES:
- Use on liquid markets (Forex majors, indices, crypto)
- Recommended timeframes: 15m, 1H, 4H
- Combine with support/resistance for confirmation
- Adjust lookback period based on market volatility
- Test alert settings before live trading
- Use JSON alerts for automated trading integration
═══════════════════════════════════════════════════════
⚡ ALERT CONFIGURATION:
1. Click the Alert icon (bell) in TradingView
2. Select "Liquidity Swap Detector Ultimate - TITAN v6"
3. Choose your preferred alert condition:
- LONG Signal: Only bullish setups
- SHORT Signal: Only bearish setups
- ANY Signal: All trading opportunities
4. Set expiration and notification preferences
5. For MT5 integration: Select "JSON" message type and configure webhook URL

Peak Reaction Zones [BigBeluga]Peak Reaction Zones is an advanced Smart Money Concept (SMC) indicator that identifies the most recent swing high and swing low zones, helping traders determine premium and discount areas for optimal trade positioning.
🔵 Key Features:
Swing High & Low Zones:
Automatically detects the latest swing high and swing low levels.
Helps traders identify key reaction points where price is likely to respond.
Premium & Discount Concept:
The high zone represents a premium area, where price is overextended and may reverse.
The low zone represents a discount area, where price is undervalued and may bounce.
The midline dynamically marks the equilibrium of the range.
Adjustable Zone Width:
Users can fine-tune the width of the zones to match their trading style.
Wider zones capture broader reaction ranges, while narrower zones focus on precise levels.
Zone Retest Signals:
Blue markers appear when price retests the lower reaction zone, signaling potential support.
Orange markers appear when price retests the upper reaction zone, indicating possible resistance.
Price Labels for Key Levels:
Displays the price value of the swing high, swing low, and midline for quick reference.
Helps traders recognize major reaction points at a glance.
🔵 Usage:
Smart Money Trading: Utilize the premium and discount concept to align trades with institutional order flow.
Zone Reactions: Watch for price tests of reaction zones and use the retest signals to confirm potential reversals.
Midline Confirmation: If price holds above or below the midline, it can indicate directional bias.
Scalping & Swing Trading: Short-term traders can look for zone rejections, while swing traders can use the levels for trend continuation setups.
Peak Reaction Zones is a must-have tool for traders looking to trade with Smart Money Concepts, allowing for precise entries and exits based on key liquidity areas and market structure.

Market Core [BigBeluga]MARKET CORE Toolkit
The BigBeluga Market Core Toolkit is a comprehensive suite of advanced trading indicators designed to provide traders with a holistic view of market dynamics, structure, and potential opportunities.
In an ever-evolving market, relying on a single indicator can leave traders vulnerable to gaps in their analysis. The BigBeluga Market Core Toolkit addresses this challenge by integrating a range of complementary indicators that work synergistically to reveal the full picture. From detecting key support and resistance levels to identifying market structure shifts, volume imbalances, inefficiencies or analysis of money flow, this toolkit covers every aspect of market behavior.
⬤ Order Blocks
BigBeluga Order Blocks revolutionize the way traders visualize potential areas of significant market activity. Unlike traditional order block indicators that often result in cluttered, noisy charts, these Order Blocks are designed for clarity and effectiveness. They simulate and predict where large areas of market orders may rest by analyzing volume and volatility, providing excellent support or resistance areas.
The blocks offer cleaner chart presentation with reasonable distribution, volume ratio visualization within each block, and categorization into Strong, High and Balanced blocks.
Additionally, a third line has been introduced to rank order blocks by volume using a modified percent rank method for more precise ranking.
This ranking system uses percentile ranks, a concept commonly used in standardized tests. In the context of order blocks, the percentile rank of a particular order block's volume is interpreted as the percentage of the order blocks strength. This method provides a more nuanced and statistically robust way of comparing and prioritizing order blocks.
Key features:
Cleaner chart presentation with reasonable distribution of blocks
Volume ratio visualization within each block (bullish vs bearish)
Categorization into High and Balanced blocks for easy identification of significant levels
Relative volume percentage and volume delta display
Advanced ranking system using modified percent rank method for volume comparison
These Order Blocks help traders:
Forecast excellent support or resistance areas
Gain insight into the balance of the market at specific levels
Identify significant market levels at a glance
Visualize market imbalances through volume delta
Prioritize order blocks based on their relative volume importance
Make more informed decisions about potential entry and exit points
⬤ Beluga Profile
The Beluga Profile is a revolutionary market analysis tool that transforms complex market data into a clear, intuitive visual narrative. At its core, it combines a Dual-Profile Analysis, merging Delta Volume Profile with Money Flow Profile to give traders a comprehensive view of market dynamics.
The percentage scale on the left side aren't just numbers; they represent the Levels Strength Percentage, a crucial ranking system that immediately draws your attention to the most significant price zones. Complementing this, a heat map overlay brings these strength levels to life, offering an instant, color-coded representation of where the market's most influential areas lie.
To the right, a detailed breakdown of volume and money flow for each level provides the hard data behind the visual cues. This granular information allows you to dive deep into the market's structure, understanding not just where the significant levels are, but why they matter.
Below the main chart, the Delta Volume Bar serves as a foundation, showing the average delta of the volume profile. This bar is more than just a measure of volume – it's a window into the underlying forces driving price movement. Just above this bar, a macro trend indicator in the form of an arrow offers a quick, clear signal of the overall market direction based on these delta volume calculations.
But the Beluga Profile doesn't just show you what's happening – it helps you understand the 'why' and 'how'. The Adaptive Points of Interest feature allows you to customize your analysis, focusing on the areas that matter most to your trading strategy. You can select from various options including Money Flow, Delta+, Delta-, Volume+, and Level % (Highest), tailoring the display to your specific analytical needs. This flexibility ensures you can focus on the most relevant data for your trading style. Real-time Active Price Tracking ensures you're always in sync with the latest market movements.
All of these elements work in concert, creating a symphony of market information. They empower you to:
Spot key price levels with uncanny precision
Foresee potential market turns before they happen
Grasp the quality and strength of price moves
Adjust your strategy on the fly as market conditions shift
Develop a holistic understanding of market structure and participant behavior
Make informed decisions backed by a clear view of the overall market trend
In essence, the Beluga Profile isn't just a tool – it's your market storyteller, translating the complex language of price, volume, and money flow into a narrative that you can understand and act upon with confidence.
⬤ Smart Money Concepts (SMC)
The Smart Money Concepts component of the toolkit focuses on automatically detecting key market structures crucial in technical analysis. It identifies and visualizes Break of Structure (BOS) and Change of Character (CHOCH) patterns, helping traders spot potential trend reversals and significant market movements. This includes BOS identification when price breaks previous support or resistance and CHOCH detection for potential trend reversals, with automatic detection of both bullish and bearish patterns.
The latest enhancement to this feature adds a new layer of analysis through Delta Volume Calculation. When a BOS or CHOCH is detected, the toolkit calculates the delta volume within the range from the high or low point to the break point. This analysis considers all the candles in this range and determines whether the volume is predominantly bullish, bearish, or neutral.
Bullish Volume: If the delta volume is bullish, a green diamond is plotted at the high or low point, indicating potential upward momentum.
Bearish Volume: If the delta volume is bearish, a red diamond is plotted, suggesting downward pressure.
Neutral Volume: When the volume is neutral, a yellow diamond is displayed, indicating a balance in buying and selling forces.
This visual representation of volume dynamics provides an additional layer of insight, helping traders assess the strength and direction of price movements following a structure break. You can see an example of this on the attached image, where the diamonds clearly indicate the type of volume driving the breakout.
The toolkit also incorporates Fair Value Gap (FVG) Detection. Fair Value Gaps represent inefficiencies in the market, where there is an imbalance between buy and sell orders. These gaps often act as magnets for price, potentially leading to future reversals or continuations when filled. The toolkit identifies and highlights these gaps, allowing traders to recognize areas where the market may seek to rebalance.
Additionally, Double Top and Bottom Pattern Detection has been integrated, identifying potential reversal points at these classic price formations. Double tops signal potential bearish reversals after a price peak, while double bottoms suggest potential bullish reversals after a price dip. These patterns can be crucial indicators for traders looking to capitalize on upcoming trend changes.
Smart Money Concepts help traders:
Identify potential trend reversals early with a clearer view of market structure.
Recognize significant changes in market structure and volume participation.
Differentiate between temporary pullbacks and genuine trend changes using volume insights (color coded diamonds).
Shows Fair Value gaps which helps to identify price momentum and inefficiencies in the market.
This enhancement ensures that traders can not only see structural changes but also understand the volume behind those moves, leading to more informed and confident trading decisions.
⬤ Support and Resistance Levels
This powerful tool is designed to identify key price levels in the market, providing traders with a clear visual representation of potential support and resistance areas. It goes beyond simple level identification by incorporating a sophisticated ranking system and adjustable sensitivity.
The grading system of levels is a unique feature that evaluates the significance of high and low points in the price action. It takes into consideration how many times the price has touched or interacted with specific levels. This means that levels which have been tested multiple times are given higher importance in the ranking. For example, a price level that has acted as support or resistance three times will be ranked higher than a level that has only been touched once.
By leveraging this grading system, traders can focus on the most significant levels that have repeatedly influenced price action, potentially improving the accuracy of their trading decisions and risk management strategies.
This Support and Resistance Levels indicator helps traders:
Identify and prioritize potential reversal points based on their historical significance and frequency of price interaction
Set more accurate entry and exit points aligned with key market levels, focusing on those with higher ranking
Understand the hierarchical structure of market support and resistance, distinguishing between major and minor levels
Plan stop-loss and take-profit levels with greater precision, using the ranking to gauge the strength of each level
Adapt their analysis to varying market strengths and volatilities, with the ability to filter out less significant levels
Recognize recurring price patterns and potential breakout levels based on the ranked historical price interactions
⬤ How to Use the Toolkit
Each of these indicators, while powerful on its own, works synergistically with the others to provide a more complete picture of the market.
The strength of this toolkit lies in its ability to analyze the market from multiple perspectives
Combining these advanced trading indicators into a cohesive toolkit empowers traders with a comprehensive, multi-dimensional view of the market that no single indicator could provide on its own. The market's complexity demands an approach that goes beyond relying on just one aspect, such as price action, volume, or order flow. Integrating these diverse indicators creates a robust analytical framework that captures the market from multiple angles, leading to more accurate insights and better-informed decision-making.
Analyze Order Blocks to identify potential support/resistance and volume imbalances
Use Beluga Profile for comprehensive market structure and trend analysis
Monitor SMC indicators for potential trend reversals and breakouts
Utilize Support and Resistance Levels for precise entry/exit points and risk management
Combine insights from all tools for a multi-dimensional view of market conditions
⬤ Customization
Each component of the toolkit offers various customization options to suit different trading styles and preferences. These inputs allow traders to adjust settings to better fit their analysis needs and strategies:
Order Blocks
- Order Blocks : Set the amount of Order Blocks on the chart.
- Color Selection : Choose the color for highlighting the order blocks on your chart.
Market Structure
- Sensitivity : Adjust the sensitivity for detecting market structure breaks. Higher sensitivity will detect more granular breaks, while lower sensitivity focuses on more significant movements.
- Data : Enable or disable the display of market structure data.
- Zigzag Option : Toggle Zigzag displays from highs and lows.
S/R (Support and Resistance)
- Sensitivity : Control how sensitive the tool is in detecting support and resistance levels. Lower sensitivity will highlight fewer but stronger levels, while higher sensitivity may reveal more levels.
- Width % : Adjust the width of the support and resistance zones to visually emphasize their importance.
- Color Selection : Choose colors for both support and resistance levels for better clarity.
FVG (Fair Value Gap)
- Max : Set the maximum number of fair value gaps to display. Higher values will show more gaps, while lower values will focus on the most prominent ones.
- Color Selection : Customize the color for the fair value gap areas.
Volume Profile
- Length : Define the look-back period for the volume profile analysis. A longer length considers more historical data, while a shorter length focuses on recent data.
- Levs : Choose the number of volume levels to display, allowing for more or fewer volume bars within the profile.
- BG : Enable or disable background shading for the volume profile.
- HeatMap : Activate or deactivate the heat map overlay for volume intensity visualization.
- POC (Point of Control) : Toggle the Point of Control display and choose between different metrics, such as volume+, money flow, Delta+ and Delta-, Level % (Highesr), to base the POC on.
- Color Selection : Customize the color for the Point of Control line.
These customization options provide traders with the flexibility to tailor the toolkit to their specific trading strategies, enhancing their ability to identify key market signals with precision.
Each component of the toolkit offers various customization options to suit different trading styles and preferences.
The BigBeluga Market Core Toolkit synthesizes complex market data into clear, actionable formats, providing traders with professional-level insights. It's a comprehensive market analysis system that can give traders a significant edge in understanding market behavior and identifying high-probability trade setups. While highly effective, it's recommended to use this toolkit in conjunction with fundamental analysis and sound risk management practices for optimal trading results.
Skrip berbayar

Market Structure CHoCH/BOS (Fractal) [LuxAlgo]The Market Structure CHoCH/BOS (Fractal) indicator is an experimental take on classical market structure, whereas fractal patterns are used for their construction instead of swing points.
Compared to utilizing swing points for highlighting market structure like our Smart Money Concepts indicator , fractal-based market structure can appear as more adaptive, however, it can also be more restrictive when it comes to returning swing points which can cause the indicator to miss reversals in some cases.
If enabled from within the settings, users can see support and resistance levels returned from the detected market structure with breakouts highlighted on the chart. Alongside this feature, an additional dashboard showing the structure to fractal structure percentage is also provided.
🔶 SETTINGS
Length: Length of the fractal patterns to detect.
🔹 Style
Bullish Structures: Show bullish structures.
Bearish Structures: Show bullish structures.
Support: Show support levels.
Resistance: Show resistance levels.
🔹 Dashboard
Show Dashboard: Show structure to fractal percentage dashboard on the chart.
Location: Location of the dashboard on the chart.
Size: Dashboard size.
🔶 USAGE
Market structure is commonly used to determine trend direction by using price positions relative to prior swing points. Using fractal patterns to determine market structure can allow users to obtain shorter, more frequent structure labels.
Market structure is commonly classified as follows:
Change of Character (CHoCH), also referred to as Market Structure Shift (MSS)
Break of Structure (BOS), also referred to as Market Structure Break (MSB)
Change of Characters indicate a shift in the market trend, confirming trend reversals. Break of Structures on the other hand occur once a trend is already determined, confirming new higher highs/lower lows.
Using higher length values allow users to detect longer-term fractals, thus highlighting longer-term market structures. The image above detects fractal patterns made of 7 candles, even if the increment is only of 2 bars this significantly reduces the amount of detected market structure labels.
The result obtained by utilizing fractals and higher settings can be a more dynamic view of market structure, however, as seen in the image above this can introduce very significant delay compared to utilizing pure swing points.
🔹 Support/Resistance
The indicator also returns support/resistance levels constructed from the market structure, these levels are obtained similarly to order blocks, finding the minimum on the interval of a bullish market structure and the maximum of a bearish market structure.
Price reaching a support/resistance level can be expected to bounce from it. Once a level is broken, the support/resistance level will no longer extend, and a circle will be displayed highlighting the break.
While utilizing this script for fractal-based market structure, these levels can be useful to ensure all swing points are still considered by the user with the possibility of the indicator missing reversals due to its calculation not being based on swing points themselves.
🔹 Dashboard
The dashboard reports the structure to fractal percentage, that is the amount of bullish/bearish market structures relative to the total amount of detected bullish/bearish fractal patterns.
This allows us to see how often a detected fractal pattern is used to display a market structure.
🔶 DETAILS
🔹 Fractals
In the context of technical analysis, Fractals refer to specific patterns that exhibit self-similarity at different scales or timeframes.
The most commonly known fractal pattern consists of a consecutive sequence of candles (more commonly 5), with the central candle being the lowest (in case of a bullish fractal) or highest (in case of a bearish fractal).
A bullish fractal has candles on the right side of the central candle with increasing lows, while candles on the left side have decreasing lows.
A bearish fractal has candles on the right side of the central candle with decreasing highs, while candles on the left side have increasing highs.
🔶 RELATED SCRIPTS
🔹 Smart Money Concepts
🔹 Market Structure Trailing Stop
🔹 ICT Concepts
