CHoCH + BOS + LQ Sweep v6.3.8 PRO+The CHoCH + BOS + LQ Sweep PRO indicator is a comprehensive Smart Money Concepts (SMC) tool designed to identify market structure shifts, liquidity sweeps, and key supply-demand zones across multiple timeframes. It helps traders visualize crucial price action patterns like Change of Character (CHoCH), Break of Structure (BOS), and liquidity grabs that often precede significant market reversals or continuations.
This tool is especially suited for traders applying multi-timeframe analysis and liquidity-based trading strategies on Forex, crypto, indices, or commodities.
1. Liquidity Sweeps (LQ Sweeps)
Identifies when price sweeps previous highs/lows (stop hunts/liquidity grabs).
Configurable strength setting to filter minor vs. major sweeps.
Optional stop at wick or stop at close logic for more precise entries.
Old sweeps can be displayed or hidden, with user-defined limits for historical sweeps.
2. Multi-Timeframe (HTF) Sweeps
Displays liquidity sweeps from higher timeframes (M15, H1, H4, D1, W1).
Individual checkboxes allow flexible combinations (e.g., show only H1 & H4 sweeps).
Unique colors for each timeframe to differentiate visually on the chart.
3. Supply/Demand Zones
Automatically plots zones around swing highs and lows.
Zones are dynamically updated and locked once price interacts with them.
Configurable view: Show both bullish/bearish zones or filter for one side only.
Option to display/hide old zones and limit the number of zones shown.
4. Historical Sweep Management
Stores up to 5000 sweeps internally, while adhering to TradingView’s rendering limits (max 500 drawn).
Ensures chart clarity by prioritizing the most recent sweeps.
Cari dalam skrip untuk "smart"

BullishSpotAI Smart Signals - EnhancedBullishSpotAI Smart Signals – Invite-Only Version
This script is a multi-layered technical analysis tool designed to help traders identify potential high-probability entry and exit zones based on a combination of trend, momentum, and volatility signals.
🔹 Key Features:
EMA Cross Logic: Detects momentum shifts using fast and slow exponential moving averages.
Multi-Indicator Confirmation: Combines conditions based on RSI, MACD, and ADX to validate trend strength and reduce false signals.
Auto-Generated Trade Levels: Automatically plots estimated entry, stop loss (SL), and multiple take profit (TP) levels on the chart for visual clarity.
Adaptive Parameters: Adjusts calculation settings based on the selected timeframe to better align with different trading styles.
🔹 Compatible With:
Scalping
Day Trading
Swing Trading
🔹 Additional Functionalities:
Built-in alerts for potential long and short opportunities.
Optional visualization of extended price zones to support trade planning.
📌 This invite-only script is closed-source. While the exact logic is not publicly disclosed, the description outlines its core mechanisms and the type of analysis it performs.
⚠️ This tool is not a guarantee of future results and should be used in conjunction with sound risk management and personal judgment. It is intended to support technical decision-making, not to replace it.

Adaptive Trend Cloud + Smart Reversal Zones [@darshakssc]This indicator combines a volatility-adjusted trend cloud with RSI- and volume-based reversal signals to help traders visually spot potential trend continuation or reversal zones.
It’s designed to look clean, colorful, and informative — great for both beginners and experienced traders looking for chart clarity and actionable insights.
🔍 How It Works
🔵 1. Trend Cloud
1. The cloud is created using a 34-period EMA as the base and adjusted with a 14-period ATR multiplier.
2. When price is above the EMA, the cloud turns green (bullish).
3. When price is below the EMA, it turns red (bearish).
4. A neutral gray tone shows when price is inside the cloud, signaling potential indecision.
🔁 2. Smart Reversal Signal Logic
1. Signals appear only when price enters the cloud zone, indicating a potential change in direction.
2. To confirm the reversal, the following conditions must also be met:
3. RSI is below 40 (for bullish reversals) or above 60 (for bearish reversals)
4. A volume spike occurs (1.8× the 20-bar volume average)
5. A cooldown of 10 bars between signals prevents overplotting
🎯 3. TP & SL Labels
1. When a valid buy or sell signal appears:
🎯 TP (Take Profit) is placed at 2× ATR distance
🛑 SL (Stop Loss) is placed at 1× ATR distance
These levels are shown via chart labels for visual reference
🛎️ 4. Alerts
1. Built-in alerts trigger on:
🟢 Buy reversal signals
🔴 Sell reversal signals
✅ How to Use
1. Apply the indicator to any chart (works best on 5min–4h timeframes)
2. Look for the 🟢 Buy / 🔴 Sell labels when price touches the cloud
3. Use the visual TP/SL markers as reference zones — not financial advice
4. Combine with your own risk management, price action or confluence tools
⚙️ Customization Options
1. EMA & ATR lengths and multipliers
2. RSI and volume thresholds
3. Signal cooldown to reduce noise
4. Toggle TP/SL zones on or off
⚠️ Disclaimer
This script is for educational purposes only and does not constitute financial advice. Always test on demo accounts and combine with your own trading system.

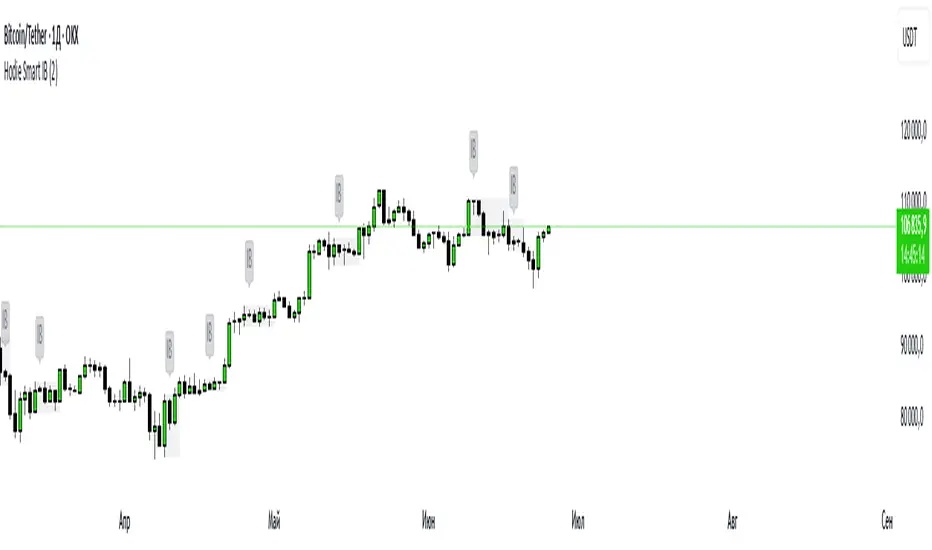
Hodie Smart Inside BarThe Hodie Smart Inside Bar indicator automatically detects and visually highlights inside bars — candles fully contained within the range of the previous (parent) candle.
How the indicator works:
Inside Bar Identification:
The indicator analyzes each candle and checks if its high is lower than the previous candle’s high, and its low is higher than the previous candle’s low. If this condition is met, the candle is considered an inside bar.
Size Filtering:
To filter out small and insignificant consolidations, the indicator compares the size of the parent candle’s range to the inside bar’s range. Only if the parent candle is significantly larger (2 times or more — adjustable parameter), the inside bar is considered significant.
Zone Drawing:
For each detected inside bar, the indicator draws a rectangular zone bounded by the parent candle’s high and low. This zone automatically extends to the right as new bars appear until the price moves outside the parent candle’s range.
Zone Completion:
Once the price closes above the parent candle’s high or below its low, the zone is considered complete and stops extending.
Visual Aids:
If enabled, the indicator can shade the background of the current inside bar for additional visual emphasis.
A label with the text "IB" appears above the inside bar candle on the chart for easier identification.
Alerts:
Supports alerts when a new inside bar forms.
Alerts help traders notice important signals promptly.
To activate, create an alert on the indicator with the condition “New Inside Bar”.
Benefits of the Indicator:
Inside bars often signal consolidation and potential liquidity accumulation, which may be followed by a strong impulsive breakout. This indicator helps traders quickly identify consolidation zones and prepare for possible price moves.
FVG Candle HighlighterThis indicator highlights only the true Fair Value Gap (FVG) creator candle — the middle candle in a 3-bar FVG formation — with zero clutter.
🔹 Bullish FVG: Candle is colored if price gaps above the high two bars back
🔹 Bearish FVG: Candle is colored if price gaps below the low two bars back
✨ No boxes. No zones. Just pure, visual price-action accuracy.
🔧 Powered by Pine Script v6
🧠 Based on institutional-style FVG logic
🎯 Ideal for Smart Money / ICT / Order Block strategies

IU Smart Flow SystemDESCRIPTION
The IU Smart Flow System is a powerful and dynamic order flow-based strategy designed to capture high-probability trades by analyzing bullish and bearish imbalances, trend direction, and RSI strength. It identifies trading opportunities by aligning order flow conditions with the prevailing trend and momentum, making it suitable for trend-following and momentum-based trading.
This system utilizes a unique combination of:
- Order flow score to gauge market imbalance
- Trend filter using SMA and ATR to confirm market direction
- RSI to ensure entry only during strong momentum
USER INPUTS:
- Imbalance Length: Defines the lookback period for calculating bullish and bearish imbalances. (Default: 10)
- Trend Length: Determines the length of the SMA to evaluate the trend direction. (Default: 50)
- RSI Length: Specifies the RSI period to assess momentum strength. (Default: 14)
LONG CONDITIONS:
Long entries are triggered when:
- Order flow score is positive, indicating bullish imbalance
- Price is above the bullish trend level (SMA + ATR), confirming an uptrend
- RSI is above 50, indicating bullish momentum
- No active short position is currently open
SHORT CONDITIONS:
Short entries are triggered when:
- Order flow score is negative, indicating bearish imbalance
- Price is below the bearish trend level (SMA - ATR), confirming a downtrend
- RSI is below 50, indicating bearish momentum
- No active long position is currently open
WHY IT IS UNIQUE:
- Imbalance-Based Approach: Unlike traditional strategies that rely solely on price action, this system evaluates bullish and bearish imbalances to anticipate order flow direction.
- Adaptive Trend Filter: The combination of SMA and ATR dynamically adjusts to market volatility, providing a reliable trend confirmation mechanism.
- Momentum Validation with RSI: Ensures that entries are taken only in the direction of strong momentum, reducing false signals.
HOW USERS CAN BENEFIT FROM IT:
- Enhanced Trade Accuracy: Aligning order flow, trend, and momentum reduces false signals and improves trade success rates.
- Versatile Application: Suitable for various markets and timeframes, making it adaptable to different trading styles.
- Clear Trade Signals: Provides clear entry labels and alerts, ensuring traders never miss a potential opportunity.
- Visual Clarity: The filled region between bullish and bearish trends highlights trend direction, enhancing decision-making.

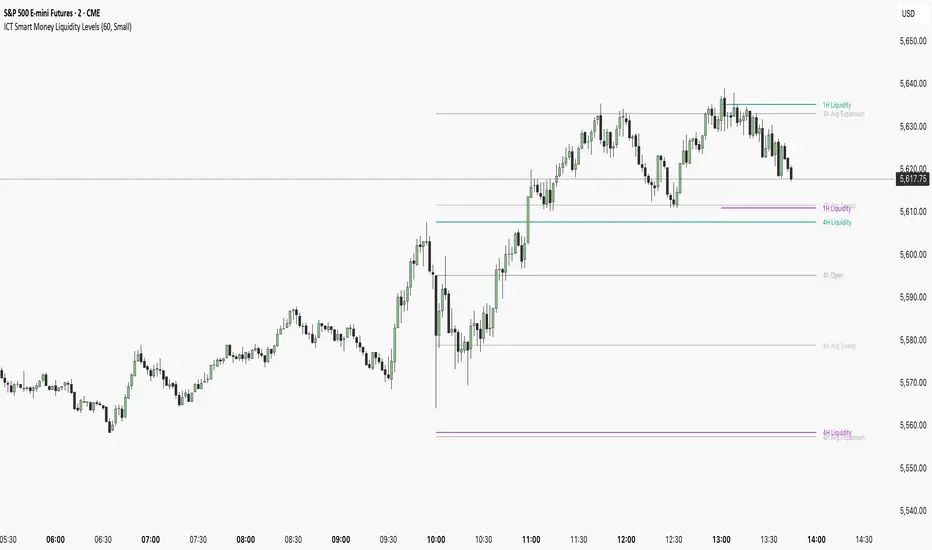
ICT Smart Money Liquidity LevelsThe ICT Smart Money Liquidity Levels indicator is designed to visualize key liquidity areas across multiple timeframes. Based on ICT concepts, this tool can help traders analyze price movement, liquidity sweeps, and expansion levels without switching between timeframes.
This indicator highlights liquidity levels at significant highs and lows, allowing users to track potential areas of interest where price may react. By also incorporating historical measurements, it also provides forecasted average sweep and expansion zones.
Features:
- Liquidity Levels
Plots previous HTF candle highs and lows. Available for 1H, 4H, Daily.
- Major Liquidity Levels
Highlights areas where price previously reached a significant high or low within 10 HTF candles. Available for 1H, 4H, Daily.
- Sweep and Expansion Forecast
Uses historical price data to forecast the average sweep and expansion levels for the next HTF candle. Available for 4H, Daily, Weekly, Monthly.
Why Is This Indicator Useful?
Based on ICT concepts, price seeks liquidity, often targeting trapped stops above highs and below lows before reversing or continuing its trend. High-timeframe (HTF) highs and lows, such as 1H, 4H, and Daily liquidity levels, act as natural draw points where price is likely to react. These levels represent areas where stop hunts, liquidity grabs, and institutional order flow often take place. By marking these zones, traders can anticipate where price may seek liquidity before making a significant move.
Additionally, historical liquidity sweeps and expansion zones provide insight into how price has behaved in similar situations in the past. According to ICT methodology, price often manipulates liquidity before expanding in the intended direction. By tracking average sweep and expansion levels, traders can forecast potential price movement, aligning their entries with areas where liquidity has historically been taken or distributed.
Disclaimer:
This indicator is for informational and educational purposes only. It does not provide financial, investment, or trading advice. No guarantees are made regarding accuracy, completeness, or profitability. Trading involves risk, and past performance does not indicate future results. Users are solely responsible for their trading decisions. By using this indicator, you acknowledge that the creator is not liable for any financial losses or decisions based on the information provided.
More Examples:
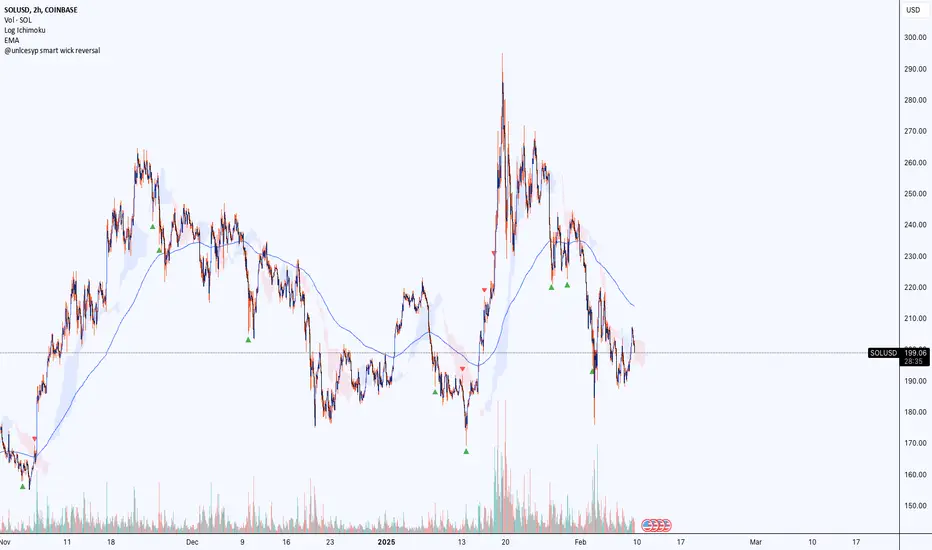
@unlcesyp smart wick reversal@unlcesyp smart wick reversal
This indicator helps you spot potential market reversals by highlighting abnormal wicks that often signal a turning point. It adapts to changing market volatility and volume, making it more reliable across different market conditions.
How It Works
1. Wick Analysis
- Measures upper and lower wicks over a chosen lookback period.
- Calculates the average and standard deviation of these wicks, then flags “abnormally long” wicks.
2. Adaptive Volatility
- Uses an ATR-based volatility factor to adjust the wick threshold.
- In high-volatility conditions, the threshold is higher, reducing false signals.
3. Trend Check
- Select either an SMA or EMA to determine if the market is in an uptrend or downtrend.
- A large upper wick in an uptrend can signal bullish exhaustion (potential reversal down).
- A large lower wick in a downtrend can signal bearish exhaustion (potential reversal up).
4. Optional Volume Confirmation
- Checks if volume is above its average to ensure strong participation in the move.
- Helps filter out weak, low-volume signals.
5. Signals
- Red ▼ (triangle down) = Potential Bearish Reversal
- Green ▲ (triangle up) = Potential Bullish Reversal
Why Use It?
- Adaptive: Automatically adjusts to changes in market volatility.
- Flexible Trend Basis: Choose SMA or EMA for calculating market trend.
- Volume Filter: Adds an extra layer of confirmation.
- Clear Visuals: Marks potential reversals with simple, unobtrusive shapes.
Inputs Explained
1. Lookback Period for Wick Analysis (`length`)
- Default: 20
- Number of bars used to calculate wick averages. Higher values = smoother signals; lower values = more reactive.
2. ATR Length for Volatility Filtering (`atr_length`)
- Default: 14
- Number of bars the ATR uses to gauge volatility.
3. Base Threshold Multiplier (`base_multiplier`)
- Default: 2.0
- Multiplier for standard deviation of wicks. Higher = fewer (but potentially stronger) signals.
4. Volatility Sensitivity Factor (`volatility_sensitivity`)
- Default: 1.5
- Adjusts how much volatility affects the threshold. Higher = more adaptive; lower = more stable.
5. Enable Volume Confirmation (`volume_filter`)
- Default: true
- When enabled, signals only appear if volume exceeds its average by a specified multiplier.
6. Volume Spike Multiplier (`vol_multiplier`)
- Default: 1.5
- Determines how much above average volume must be to confirm a signal.
7. Trend Calculation Method (`trendMethod`)
- Options: “SMA” or “EMA”
- Determines the type of moving average to evaluate the market trend for exhaustion signals.
Best Practices
- Combine with other price action or technical indicators to confirm signals.
- Use on multiple timeframes for a broader market perspective.
- Adjust parameters (`length`, `atr_length`, `base_multiplier`) for different assets or personal preference.
Introducing the "Smart Money Trap" (SMT) IndicatorThe "Smart Money Trap" (SMT) indicator is a powerful tool designed for simultaneous analysis of multiple currency pairs and their correlations. This indicator allows you to effortlessly visualize divergences and correlations between various currency pairs on a single chart, enhancing your ability to perform in-depth technical analysis.
Key Features:
Multi-Currency Comparison:
The SMT indicator enables you to view the following currency pairs simultaneously:
EUR/USD (Euro to US Dollar)
GBP/USD (British Pound to US Dollar)
USD/JPY (US Dollar to Japanese Yen)
DXY (US Dollar Index)
Correlation and Divergence Analysis:
By overlaying these currency pairs, the SMT indicator helps you identify correlations and divergences between them, which can signal potential trading opportunities.
Customizable Timeframes:
The indicator automatically adjusts to the current chart’s timeframe, ensuring that your analysis is always in sync with the selected period.
Enhanced Decision-Making:
With the ability to visualize multiple currency pairs and their relationships, you can make more informed trading decisions and better understand market dynamics.
The SMT indicator is a valuable tool for traders looking to track and analyze currency pair interactions and identify trading signals based on their correlations and divergences.

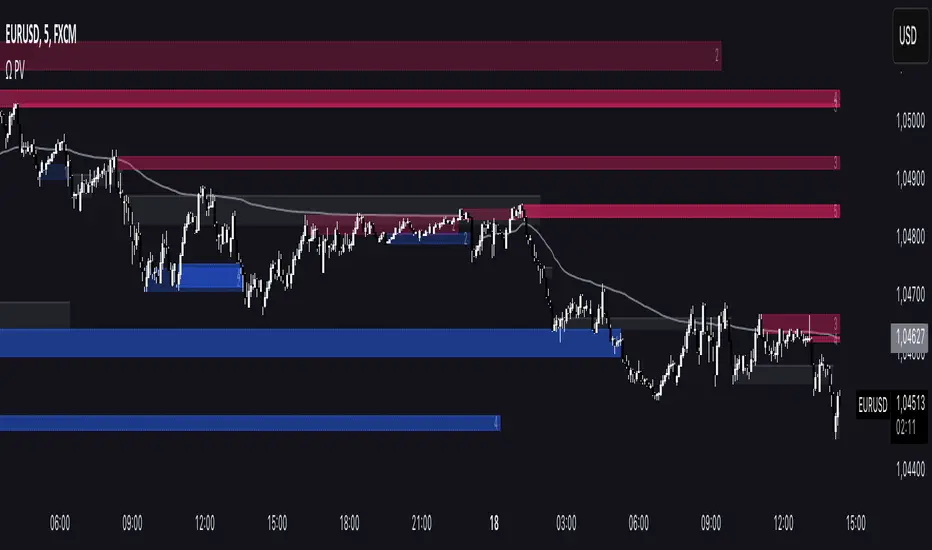
Omega Smart AnalystThe Omega Smart analyst is a tool designed to help traders visualize in a clearer way key price levels on the chart based on the price and the volume.
The indicator has some features, including:
- Option to customize the colors for all of the tools available to have common aesthetics
- Option to choose the length and the sensitivity for all of the tools
Volume clusters: display automatic volume clusters that can be used as support or resistance following the order block theory. These levels can be highlighted or extended in the settings.
Support and resistance: show automatic support and resistance levels based on volume.
Candle coloring: color candles based on volume and volatility, great to use as a signal confirmation.
Full levels: show previous high, low, and close levels on the chart, great to use to detect liquidity and breakouts
Bias target: a tool to enhance one of the low or high of the previous full levels according to the daily liquidity bias ICT method. As shown in the picture above you can also choose to display only these levels.
Market structure: show the current trend according to the market structure.
Structure origin: shows the main level of support and resistance with an area that gives also an indication of the current price volatility.
Risk Disclaimer:
All content and scripts provided are purely for informational & educational purposes only and do not constitute financial advice or a solicitation to buy or sell any securities of any type. Past performance does not guarantee future results. Trading can lead to a loss of the invested capital in the financial markets. I will not accept liability for any loss or damage, including without limitation any loss of profit, which may arise directly or indirectly from the use of or reliance on such information. All investments involve risk, and the past performance of a security, industry, sector, market, financial product, trading strategy, backtest, or individual's trading does not guarantee future results or returns. Investors are fully responsible for any investment decisions they make. Such decisions should be based solely on an evaluation of their financial circumstances, investment objectives, risk tolerance, and liquidity needs.
DB Support Resistance Levels + Smart Higher Highs and Lower LowsDB Support Resistance Levels + Smart Higher Highs and Lower Lows
The indicator plots historic lines for high, low and close prices shown in settings as "base levels". Users can control the lookback period that is plotted along with an optional multiplier. Traders will notice that the price bounces off these historic base levels. The base levels are shown as light gray by default (customizable in the settings). Users may choose to display base levels by a combination of historic high, low and close values.
On top of the historic base levels, the indicator display higher high and lower low levels from the current bar high/low. Higher highs are shown by default in pink and lower lows by default in yellow. The user can adjust the lookback period for displaying higher highs and the optional multiplier. Only historic values higher than the current bar high are displayed filtering out (by highlighting) the remaining levels for the current bar. Users may choose to use a combination of historic open, low and close values for displaying higher highs. The user can adjust the lookback period for displaying lower lows and the optional multiplier. Only historic values lower than the current bar low are displayed filtering out (by highlighting) the remaining levels for the current bar. Users may choose to use a combination of historic open, low and close values for displaying lower low.
The indicator includes two optional filters for filtering out higher highs and lower lows to focus (highlight) the most relevant levels. The filters include KC and a simple price multiplier filter. The latter is enabled by default and recommended.
The indicator aims to provide two things; first a simple plot of historic base levels and second as the price moves to highlight the most relevant levels for the current price action. While the indicator works on all timeframes, it was tested with the weekly. Please keep in mind adjusting the timeframe may require the lookback settings to be adjusted to ensure the bars are within range.
How should I use this indicator?
Traders may use this indicator to gain a visual reference of support and resistance levels from higher periods of time with the most likely levels highlighted in pink and yellow. Replaying the indicator gives a visual show of levels in action and just how very often price action bounces from these highlighted levels.
Additional Notes
This indicator does increase the max total lines allowed which may impact performance depending on device specs. No alerts or signals for now. Perhaps coming soon...

LNL Smart TICKLNL Smart TICK
This study is mostly beneficial for intraday traders. It is basically a user-friendly "colorful" representation of the $TICK chart with highlighted $TICK extremes. This indicator also includes: a simple trend gauge that can visualize the bias for the day, cumulative tick cloud which is showing the cumulative strength of either longs & shorts on the day.
$TICK Trend Gauge
Although it is just a exponential moving average. This average (default set on 20) works quite well as an overall gauge for the day. Whenever the gauge is green (above zero), any negative $TICK values below -500 can offer great pullback opportunities. Same applies for the red gauge. 20 EMA is below zero ? Great time to fade any +500 or +1000 tick readings. Obviously the gauge can be ajdusted to any number based on personal style.
$TICK Extremes (little triangles)
These little triangles are triggered anytime $TICK jumps above or below the pre-set values of +1000 or -1000. By just simply observing the $TICK triangles during the day can tell you how much volaility or pressure there is. Sometimes there will be 20 green triangles and only 2 red ones. That obviously mean there is a strong bearish pressure. But there will be days when you are not going to see any triangles at all which can mean there is either a low volatility or the price is stuck in the indecisive market.
Cumulative $TICK Cloud
Cumulative $TICK by itself is a great study for day traders. It is basically running "counting" $TICK that is adding the previous $TICK values from previous bars. Cumulative $TICK can create a direct picture of the current market sentiment. It is not just a simple green / red line but a cloud that can really show you the depth on the $TICK. Some days, the cloud will be quite wide which is a good sign for the strength to one side, but sometimes the cloud will be so narrow it will practically disappear. This would be telling you the exact opposite - not much conviction to any side. Of course the depth as well as the color of the cloud can change during the day.
$TICK & Cumulative $TICK Tables
By just looking at these tables. You can immidiately tell the state of the current $TICK. They both can be red or green. It all depends whether the values are positive or negative. The tables are just a little visual addition to the whole $TICK study.
Hope it helps.

Price Swing Detection - Smart Money ConceptSince my own style is Smart Money Concept and these days I have seen a lot of my friends who are having trouble identifying structures for their indicators and strategies. I wrote this code so they could use it in their strategy . In fact, this type of structure, as one of the strongest technical structures, can increase the success of your strategy according to your personalization.
The script detects swings (i.e. significant highs and lows) in a financial instrument's price action over a specified period. The user can set the lookback period (number of candles to consider) and the colors of the lines representing bullish and bearish trends.
The script has two functions: detectSwing and pivot high. The detectSwing function calculates the swing highs and lows for the specified number of candles. The function uses the ta.highest and ta.lowest functions to find the highest and lowest prices, respectively, over the lookback period. The function also determines the swing state (high or low) of the current candle and returns the calculated swing values.
The pivot high function calculates the pivot high, which is an important step in detecting bullish structures in the market. If a new top (i.e. swing high) is found, the script updates the pivot high values and creates a line from the recent top to the last bar. The script also updates the trailing maximum values, which are used to extend the top extension line.
For Strategy :
The variable "trendDirection" in the code is used to keep track of the trend state, either bullish (up trend) or bearish (down trend), in the market. The variable is initialized to 0 which represents a downtrend. The value of this variable is updated later in the code based on the calculations of swing highs and lows, pivot crosses, and the trailing maximum. If a bullish structure is detected, the value of "trendDirection" is set to 1, indicating an uptrend.

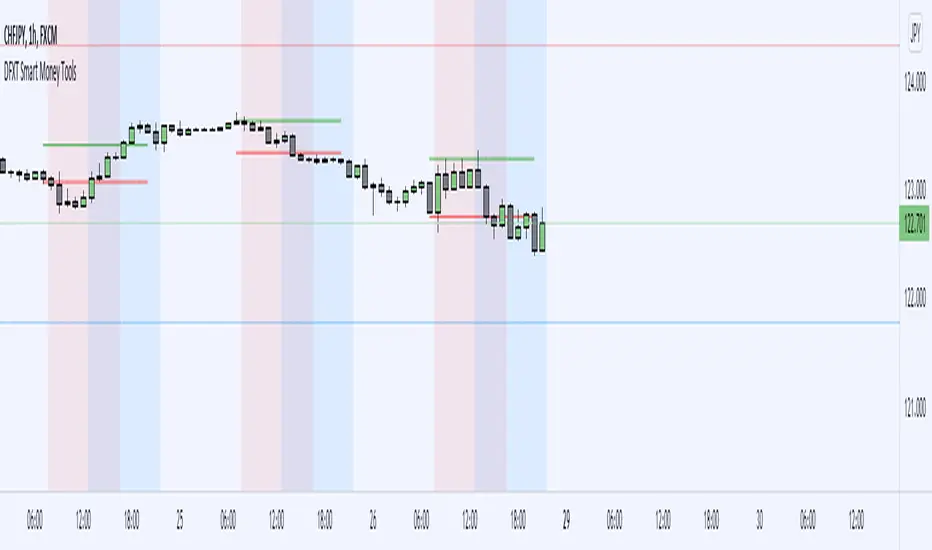
DFXT Smart Money ToolsAdded some additional features that may be useful for those trading smart money concepts.
~ Higher time frame candle Open, High, Low and close marker: for reference of where you are in price.
~ Asian Session High and Low marker: Can be used to clearly see runs on the Asian range.
~ Engulfing Candle detector: Marks engulfing candles in a colour of your choice.
~ Impulsive Candle detector: Marks Impulsive candles in a colour of your choice.
~ Quarter's Theory: Marks Quarter levels on the chart.
~ Doji Candle: Marks Doji candles in a colour of your choice.
~ Inside Bar detector: Marks Inside bars in a colour of your choice.
~ Imbalance detector: Marks Bullish and bearish imbalance in a colour of your choice.
~ Zig-Zag structure: Classic ZZ indicator that can be used to simplify the structure.
~ Liquidity Wicks: Wicks that take Liquidity then close back inside the range.
~ Session Marker: Markers the various trading sessions in a background colour of your choice.
MACD Alert [All MA in one] [Smart Crypto Trade (SCT)]This code is a gift from "Smart Crypto Trade (SCT)" group
MACD indicator contains 3 EMA, I think one of the best usage of MACD is trend detection and divergences.
In our indicator, you can select the type of Moving averages that used in macd.
You can using "MACD" based on several types of moving averages including:
Exponential Moving Average ( EMA )
Volume-Weighted Moving Average ( VWMA )
Simple Moving Average ( SMA )
Weighted Moving Average ( WMA )
Exponentially Weighted Moving Average (RMA) that used in RSI
Smoothed Moving Average ( SMMA )
Arnaud Legoux Moving Average ( ALMA )
Double EMA ( DEMA )
Double SMA (DSMA)
Double WMA (DWMA)
Double RMA (DRMA)
Triple EMA ( TEMA )
Triple SMA (TSMA)
Triple WMA (TWMA)
Triple RMA (TRMA)
Linear regression curve Moving Average ( LSMA )
Variable Index Dynamic Average ( VIDYA )
Fractal Adaptive Moving Average ( FRAMA )
In other words we tried to collect all the most popular MAs in our MACD indicator.
In addition, you can use four types of alert or alarm conditions for detection LONG or SHORT positions and trends. For this, you must set an alert in alert tab and set the condition based on four defaults conditions.
Enjoy

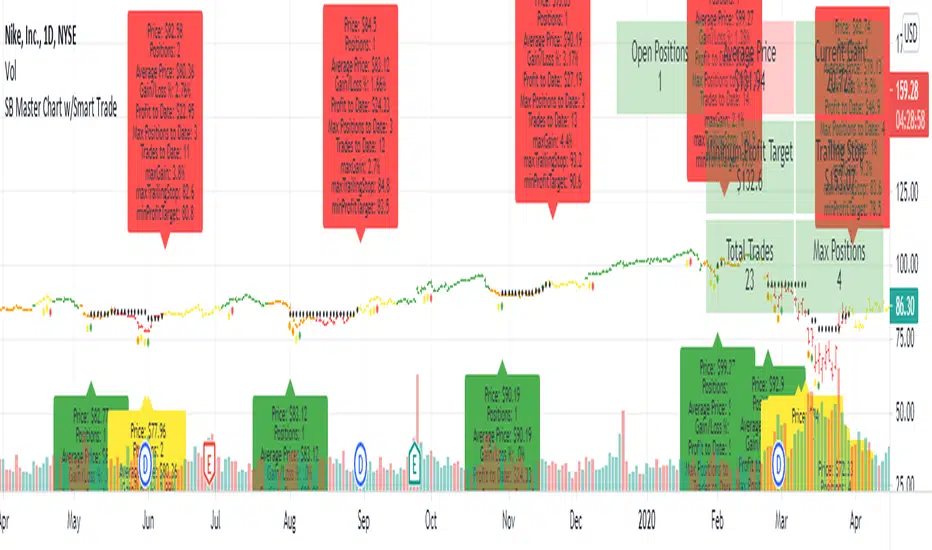
SB Master Chart w/Smart TradeThis is a follow up script to the original SB Master Chart.
SB Master Chart was created to be a simple chart that can be easily interpreted.
The prior version of SB Master Chart added additional multi time frame alerts, alerting to oversold/overbought and high volume on 5 time periods (30m,1h, 2h, 4h, and 1d).
V4 of SB Master Chart is NOT going away. It is not being REPLACED!... This is a separate script based on the same algorithm, but is significantly different enough to warrant its own script. Please review SB Master Chart v4 for more details about the algo.
This version of SB Master Chart w/Smart Trade has additional money management parameters to help you dollar cost average in and out of a trade.
It follows the following rules
Oversold with no positions - Buy and establish a cost basis.
Oversold with positions - Only buy if below cost basis and dca percentage set in options.
Sell - Only sell if above minimum take profit and crossbelow trailing stop loss.
The script assumes you are buying and selling in lots of 1 so cost basis and positions are based on that calculation. There is a position/profit/loss table at the top of the chart.
If you don't like making trading decisions based on SB Master Chart v4, this is the chart for you, it will tell you exactly when to buy and when to sell based on the options you set. When you created the alert.
Options available
Take Profit % - This lets you specify the minimum take profit you want to sell for.
Trailing Stop % - This is not your typical trailing stop. This trailing stop is a percentage of the maximum gain. If your stock went up 100% and you set it to 75%, it will stop loss you out at 75% gain based on your cost basis/open trades
DCA % - This will only open a trade if you are below your cost basis by DCA% and there is a buy signal.
Start Year/End Year - This will allow the graph to start displaying information from the date forward. This is useful for determining Max Positions so you can calculate how much exposure each positions should have.
Disable Trade History - This will disable the labels.
VT MCDX Smart MoneyVT MCDX Smart Money Indicator is an indicator use for detect Retailer, Hot Money and Banker momentum
Note: Advise to use this indicator with other indicator together, likes Victory Trend Indicator for maximize the winning rates)
Green - Retailer
Yellow - Hot money
Red - Banker
Red - Banker is >0 and initial buy (Daily chart).
Light Red - Banker, drop down from 20, and take profit
Green colour - Retailer's stuck position
Yellow color - Hot Money level
This indicator only open to subscribers.
For subscribe the Victory Trade System and please use below link to contact owner.
"Use the below link to contact Owner for subscribe to this indicator"

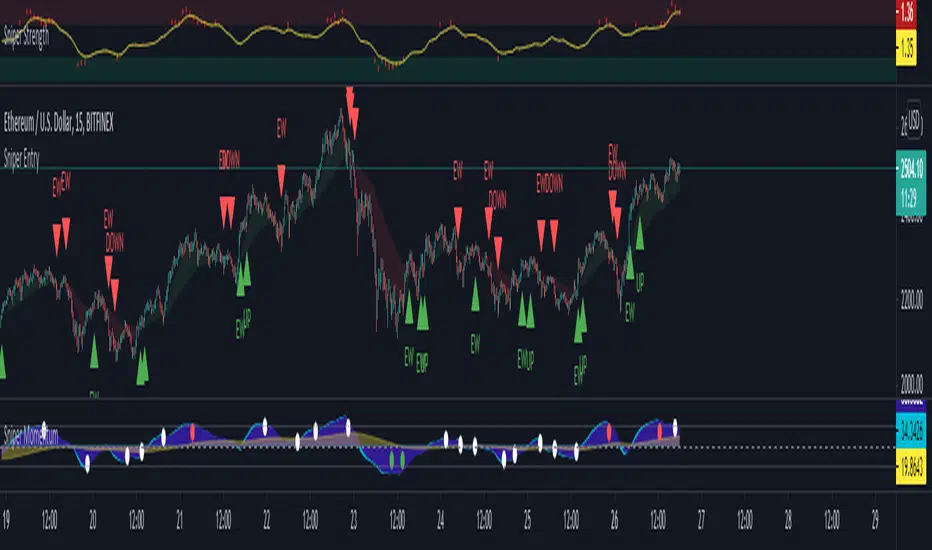
Crypto Smart VortexThe indicator is designed to work in conjunction with the Crypto Smart Scalper, it can identify potential retracement zones which will help you make a decision on whether to enter a trade or wait for a retest of the entry zone, it will also allow you to determine the best take profit points.
This is NOT a trading system and should be used with supporting information and data. It is not identifying or is meant to represent a standalone trading system.
If you would like to enquire about access to this invite only script please send me a private message on trading view and I will be happy to assist. Thank you.

Crypto Smart ScalperCrypto Smart Scalper V 1.0
Indicator designed to assist in trend identification utilising Open/Close Price for up and down moves.
This is NOT a trading system and should be used with supporting information and data. It is not identifying or is meant to represent a standalone trading system.
Open/Closed Price identified for potential trend direction once swings are complete.
If you would like to enquire about access to this invite only script please send me a private message on trading view and I will be happy to assist. Thank you.
[LunaOwl] 智慧型RSI (Smart RSI - a handy tool with less noise)Relative Strength Index is a common technical analysis tool, it is classified as a momentum oscillator, measuring the velocity and magnitude of directional price movements. it is most typically used on a 14-period timeframe, measured on a scale from 0 to 100, with high and low levels marked at 70 and 30.
相對強弱指標是常見的技術分析工具,它被歸類為動量振盪器,用於測量定向價格運動的速度和幅度,通常會使用14期數,擺盪範圍在0到100間,超買超賣分別標記成70、30。
after simple improvement and addition of logical judgment, it becomes a passive judge from subjective judgments, avoid the shortcomings of peoples in watching passivation, and the trade can be more consistent.
經過簡單的改良與添加邏輯判斷,能夠使RSI指標的使用,從主觀的判斷成為被動的確認指標,有效避免人們判斷指標鈍化的主觀缺失,並能夠使得交易更加一致。
--------------------------*
1) parameter
RSI period 1 - default is 14, same as general RSI.
RSI period 2 - default is 5, due to its own formula, the amplitude of the oscillator will become larger and more agile or fast. When the parameter is small.
exponential moving avg of RSI - using the result of RSI period 1 as the source of Ema's formula, the default length is 14, which can filter the excessive agility of RSI period 2 to reduce noise, and compared to using the baseline as the criterion for long and short judgments, The characteristics of exponential moving avg are more suitable to become flexible filtering standards.
Overbought - default is 70, you can set your overbought level.
Oversold - same as above, the default is 30.
2) Options
Open Candle color(開啟蠟燭線趨勢) - choose whether to start the color of the candle.
Open background color(開啟指標背景色) - the default is false, you can turn on.
--------------------------*
1. 設置參數
RSI期數1:預設值是14,是普通的RSI指標。
RSI期數2:預設值是5,由於RSI公式的算法,造成參數愈小擺盪幅度就會變大,反應比較快。
指數平均化的RSI期數1:將RSI期數1的結果帶入指數移動平均公式,預設值14,它能過濾RSI期數2過度敏捷的缺點,減少雜訊,相較於單純使用基準線作為多空判斷標準,用EMA的判斷標準更加因時制宜。
超買線:預設值是70,可以隨意調。
超賣線:預設值是30,一樣的。
2. 設定選項
開啟蠟燭線趨勢:顧名思義。已經幫您開好了。
開啟指標背景色:顏色太淺的話可以調深一點。
--------------------------*
ver.2- adjust new style design and create two options.
修改2: 調整新的樣式設計與建立兩個選項。
--------------------------*
ver.3- Create alert condition. maybe I should refer to the Alert Creation Framework,
there is also room for improvement.
修改3: 建立快訊選項。我應該參考警報創建框架,還有進步空間。
--------------------------*
Indicator Style - 指標樣式
The design uses casual light color style, light gray between overbought and oversold.
--------------------------*
Market Example - 市場範例
1. Bitcoin/Tether, Binance, 1 day
2. Bitcoin/USD, Coinbase, 4 hour
3. EUR/USD, Forex Market, 4 hour
4. GBP/USD, Forex Market, 30 min
5. TAIEX, Taiwan SE Weighted Index, 1 week
--------------------------*
postscript - 後記感想
The purpose of publishing Chinese Scripts is to make Pine close to more Chinese user.
I hope English skills enhancement...staggered writing makes me feel hard.
發布中文腳本的目的,是希望可以讓 Pine 親近更多中文圈的使用者。希望我的英語進步,中英文交錯撰寫有一些困難。
--------------------------*
If you find my works useful, you can give me encouragement. I can buy more books to sophisticated themselves.
如果您發現我的作品有用,可以給我鼓勵。讓我可以買更多書籍來精進自己。

Long Term Smart Money ExpertLong Term Smart Money Expert is quick guide indicator for long term trade or swing trade
It has used 35 moving average, 90 moving average and 200 moving average
Plotted lines are average value of 35 MA and 90 MA and 35 MA and 200 MA
Buy Signal generates on 35 MA crossover
Sell Signal Generates on 35 MA crossunder
This indicator needs Trend Lines +++ for better performance
Intraday Smart Money ExpertIntraday Masters Analogy is the tool where Buy and sell signals generates automatically according to the candles behavior.
It uses WD Gann Levels to calculate entry point with the help of VWAP .
Pivot points determines the recent support and resistance levels.
Trading rule for this indicator
This indicator is designed for Indian equity stocks
Best performance is expected on 5 minutes chart or 15 minutes chart
Order thumb rule
1. avoid any trade signal before 9:35 AM Indian time
2. signal and and related stop loss candle must be formed in the same day
3. if order placed in 5 minutes chart then don't go for a target of 15 minutes chart
4. if order placed in 15 minutes time frame and target is too far then check the target in 5 minutes time frame
5. if signal candle touches the target then avoid the signal.
6. Money management is most important for this indicator.
7. Take trade only if it satisfy risk reward ratio.
8. It has long target but need patience.
Signal
using vwap calculates gann square of 9 levels and if any smart money activity on that level then checks the confirmation of the trend by higherhigh or lowerlow formation
Buy Entry : entry price should be on the high of the candle before signal for buy and sl on bottom of flagged candle just before signal
SellEntry : entry price should be on the low of the candle before signal for sell and sl on top of flagged candle just before signal
Warning : Don't place any order without stop loss

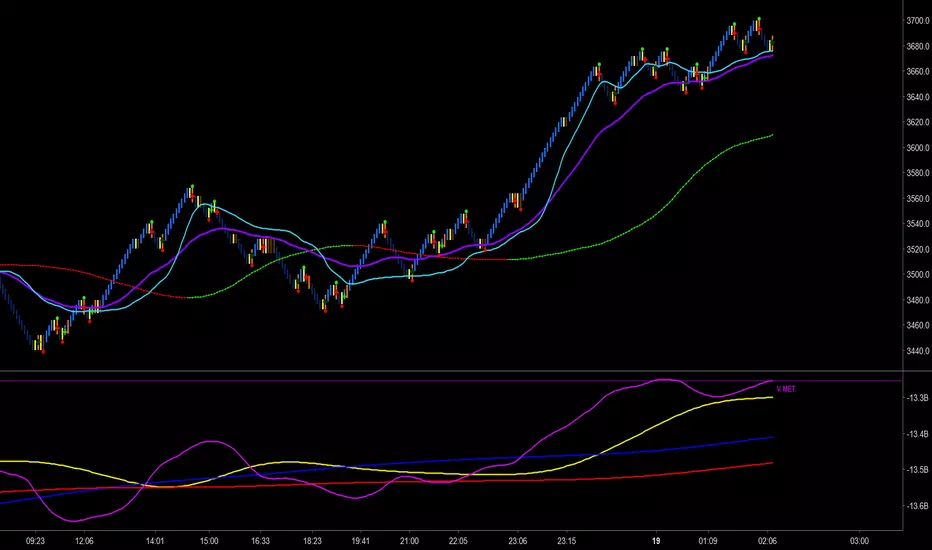
Trader Set - Volume MetricThe last tool in my methodology set, another one of those tools that has unique unpublished formulas, this one purely for following volume and reading smart money's hand, YES it's possible. This indicator has few Alerts built in that you can use, will update the rest of the scripts for additional alerts. You can easily set the alert to play a sound that is not disturbing in long run and check mark open ending and have easy time being alerted when some crossings are happening.
Please, don't ask for access, only my students from my classes will have access to this indicator. The English version of the website and learning material is under development and the moment they get ready I will announce it under each related script.