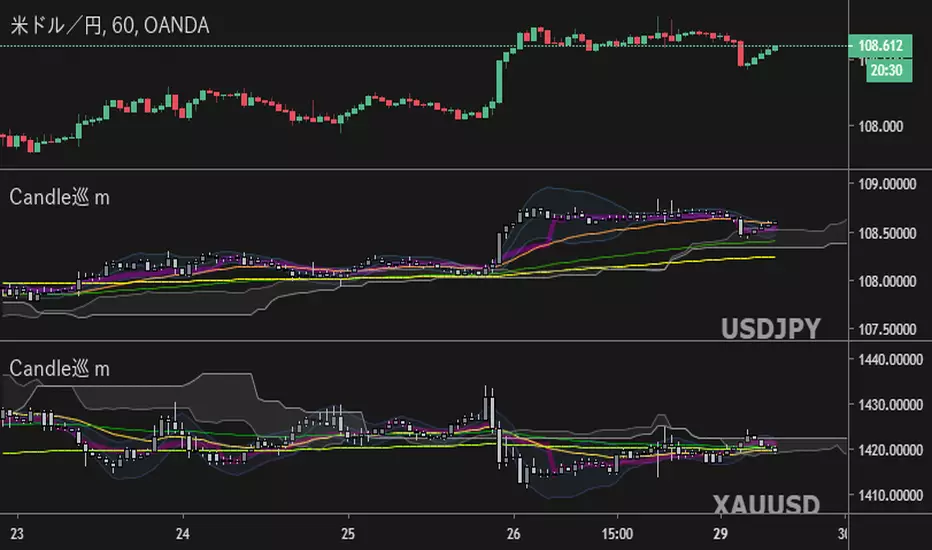
Candles [Meguru] MobileMulti-currency Indication For mobile "Candles[Meguru]Mobile"
The display of exchanges and major currencies has been made selective. (I thought about the use with a smartphone etc. and made it possible to omit the trouble of character input. It is also possible to enter manually.)
モバイル向け多通貨表示インジ『Candles[Meguru]Mobile』
取引所やメジャーな通貨の表示を選択式にしました。(移動時・スマホなどでの利用を考え、文字入力の手間を省略できるよう作成しました。手入力での設定も利用できます。)
反転チャート・時足の固定も可能です。
複数表示することで、多通貨を同時に表示・監視することもできます。
詳細、購入などはこちらにて
note.mu
Cari dalam skrip untuk "smart"
Explosive Signals Version 2.0 Power - Features:
+ Optimized trading methods for multiple time frames 5M 15M 1H 4H (including Margin and Exchange Trading).
+ EST_V2 can be used to track all financial markets (Crypto, Stock, Forex, ...)
+ EST_V2 can be used to track all altcoins trading pairs
+ The tool is based on the average formula, combined with trend-changing signal processing algorithms with calibrated parameters of the experienced team.
+ Real-time push alert system + Email + Popup on your desktop, laptop, tablet and smartphone => have time to enjoy trading live.
+ Our system runs 24/7.

Crypto Signal Warnings ( Margin/Exchange )Crypto Signal Alert is an intuitive and easy-to-use graphing buying tool that helps traders save time and maximize profits ^$$$^
- Features:
+ Optimized trading methods for multiple time frames 5M 15M 1H 4H (including Margin and Exchange Trading).
+ Build the rule of Stoploss / Takeprofit according to the risk management method according to the trader's strategy.
+ Real-time push alert system + Email + Popup on your desktop, laptop, tablet and smartphone => have time to enjoy trading live.
+ Our system runs 24/7.
*** Sign up for a 3-day trial here : goo.gl

BLACK OPS Pro Edition (White Knight) v1.0BLACK OPS Pro Edition (White Knight) v1.0
Author: Mayo – Black Ops (WBI) Whales Belly Investments
Version: 1.0
Pine Script: v6
Overlay: Yes
Product Description
The BLACK OPS Pro Edition (White Knight) is a professional-grade TradingView overlay designed for traders seeking clarity, actionable insights, and multi-timeframe precision. This dashboard combines ultra SuperTrend flips, dynamic Delta Zones, ATR-based volatility detection, EMA trend analysis, and real-time trust indicators into a single powerful interface.
It’s built for intraday and swing traders who want instant visual cues on bullish or bearish momentum, consolidation zones, and high-confidence entry points—without cluttering the chart.
Key Features
Multi-Timeframe EMA Trend – Monitor EMA alignment across multiple timeframes for accurate trend detection.
Ultra SuperTrend Flips – Intrabar first-bar arrows highlight potential trend reversals immediately.
Delta Zones Buy/Sell Pressure – Non-persistent labels indicate strong buying or selling pressure.
ATR-Based Guidance – Stop-loss, take-profit, and volatility context for trade decisions.
Fog Overlay – Visual fog between EMAs shows short-term trend momentum; green = bullish, red = bearish.
Professional Dashboard – Upper-right table displays overall trend, signals, volatility, chop/trend status, and multi-timeframe consensus.
Trust Indicators – “✅ TRUST BUY / SELL” alerts when multiple confirmations align.
Customizable Inputs – Adjust EMAs, ATR periods, risk/reward, SuperTrend sensitivity, and visual options.
Non-Persistent Signals – Arrows and labels only display intrabar, keeping historical data uncluttered.
Installation & Instructions
Add to TradingView:
Open TradingView → Pine Editor → Paste the script → Add to Chart.
Adjust Inputs (Optional):
EMA Lengths & Filters: Fine-tune trend detection settings.
ATR / Risk Settings: Configure stop-loss and take-profit multipliers.
SuperTrend Factors: Adjust sensitivity for trend flips.
Display Options: Toggle fog overlay, labels, and arrows.
Using Signals:
Bullish Signals (🚀BUY): Confirm dashboard trend and trust indicators.
Bearish Signals (💥SELL): Check volatility, Delta Zones, and multi-timeframe consensus.
Trust Indicators: ✅ TRUST BUY / SELL appears when conditions align across trend, volatility, and multi-timeframe checks.
Dashboard Overview
Row Content Description
Overall BULL 🟢 / BEAR 🔴 / MIXED ⚪ Current market trend based on EMA + SuperTrend.
20m Trend BULL 🟢 / BEAR 🔴 / NEUTRAL ⚪ Short-term EMA trend reference.
Signals 🚀LONG / 💥SHORT Active buy/sell triggers.
Volatility HIGH ⚡ / LOW 💤 Market activity indicator using ATR.
Chop / Trend CHOP 🟡 / TRENDING 🟢 Detects consolidation vs trending conditions on lower timeframes.
Delta Zones Labels
Strong Buy: ✅ White Knight (below candle, intrabar only)
Strong Sell: ⚡ Black OPS (above candle, intrabar only)
High-confidence zones indicate significant buying or selling pressure and appear only when conditions are met to keep charts clean.
Visual Elements
Fog Overlay: Green = bullish, Red = bearish (adjustable transparency)
EMAs: Short- and medium-term EMAs plotted for trend reference
SuperTrend Arrows: Green = bullish flip, Red = bearish flip
Trust Labels: ✅ TRUST BUY / SELL signals when confirmations align
Lower-Left Watermark
Text: “Property of Black Ops Trading Company”
Semi-transparent, non-intrusive, updates dynamically with chart movement.
Lower-Right Disclaimer
⚠️ For educational purposes only. NOT financial advice.
Trading involves risk. Test strategies in paper trading first. Users are fully responsible for trades.
Marketing Blurbs
Long-Form:
“Unlock the BLACK OPS Pro Edition – your all-in-one TradingView tool for multi-timeframe trend detection, intrabar SuperTrend flips, and high-confidence Delta Zone alerts. Perfect for traders who want professional insights and actionable guidance instantly.”
“Track trend, volatility, and high-probability trade zones in real time with intuitive arrows, fog overlays, and a full dashboard. Make informed decisions faster and trade smarter.”
Short-Form / One-Liners:
“Black Ops Pro Edition: Spot trends, flips, and high-probability trades instantly!”
“Trade smarter with EMA trends, SuperTrend flips, and Delta Zone alerts!”
“See the trend, catch the flips, and know when the pros buy and sell!”
Quick Reference – Colors & Labels
Element Color
Bullish Arrows / Trust Buy Green
Bearish Arrows / Trust Sell Red
Fog Bullish Green
Fog Bearish Red
Delta Strong Buy White
Delta Strong Sell Gray
Dashboard Text Bull Green
Dashboard Text Bear Red
Dashboard Neutral / Mixed Gray / White

Trend + Liquidity Master Trend & Liquidity Master
A Professional All-in-One Trading System combining Dynamic Trend Analysis with Smart Money Liquidity Zones
---
## 🎯 Overview
The Trend & Liquidity Master is a comprehensive trading indicator that merges institutional-grade trend detection with smart money liquidity mapping. Designed for traders who want to align with market structure while identifying high-probability entry zones, this system provides clear visual signals backed by multi-layered confirmation filters.
## ⚡ Core Features
### 📊 **Adaptive Trend Cloud**
- Multi-Algorithm Support: Choose between EMA, SMA, HMA, or RMA for trend calculation
- Volatility-Based Bands: Dynamic ATR bands that expand/contract with market conditions
- Anti-Chop Filter: Maintains trend state during consolidation to reduce false signals
- Visual Clarity: Color-coded cloud system (Green = Bullish, Red = Bearish - customisable)
### 🧱 **Smart Liquidity Zones**
- Supply & Demand Boxes: Automatically identifies institutional support/resistance levels
- Pivot-Based Detection: Uses swing high/low analysis to map liquidity pools
- Dynamic Mitigation: Zones auto-delete when price invalidates them
- Clean Visual Design: Semi-transparent boxes that don't clutter your chart
### 🎯 **Multi-Filter Signal System**
- Volume Confirmation: Optional filter to ensure signals occur on above-average volume
- RSI Screening: Avoid overbought buys and oversold sells (toggleable)
- Trend Alignment: Signals only trigger on confirmed trend changes
- Clear Entry Labels: BUY/SELL markers appear directly on the chart
### 🖥️ **Professional HUD Dashboard**
Real-time market intelligence display showing:
- Trend Bias: Current market direction (Bullish/Bearish)
- Momentum Status: Strength classification (Strong/Neutral/Weak)
- Volume State: Current volume relative to average (High/Low)
- Customizable Position & Styling: Place anywhere on your chart
---
## 🛠️ Customization Options
### **Trend Engine**
- Adjustable MA type and length
- Volatility multiplier for band sensitivity
- Source selection (Close, Open, HL2, etc.)
### **Liquidity Detection**
- Pivot lookback period (sensitivity control)
- Zone extension bars
- Toggle zones on/off independently
### **Signal Filters**
- Enable/disable volume filter
- Enable/disable RSI filter
- Fine-tune to match your trading style
### **Visual Design**
- Custom colors for bullish/bearish/neutral states
- Candle coloring option
- Dashboard styling and positioning
- Adjustable text and UI sizing
---
## 📈 How to Use
1. Identify the Trend: Wait for price to break above the upper band (Bullish) or below the lower band (Bearish)
2. Watch for Signals: BUY labels appear when trend turns bullish with confirmation; SELL labels for bearish turns
3. Confirm with Liquidity: Use Supply/Demand zones as potential entry refinement or profit targets
4. Monitor the HUD: Check momentum and volume states for additional confluence
5. Set Alerts: Built-in alert conditions for automated notifications
---
## 💡 Best Practices
- **Higher Timeframes**: Works best on 15m+ charts for reduced noise
- **Trend Following**: This is a trend-following system—avoid counter-trend trades
- **Multiple Confirmations**: Combine signals with liquidity zones for highest probability setups
- **Risk Management**: Always use proper position sizing and stop losses
---
## 🔔 Alert System
Pre-configured alerts for:
- Long entry signals (Apex Buy Alert)
- Short entry signals (Apex Sell Alert)
- Automatic ticker symbol insertion
---
## 📝 Notes
- Maximum 50 boxes and lines for optimal performance
- Liquidity zones automatically manage themselves (old zones removed)
- All components can be toggled independently
- Compatible with all markets (Forex, Crypto, Stocks, Indices)
---
## 🎨 What Makes This Different?
You get the best of both worlds: smart money zones that show where liquidity sits, combined with clear trend signals that tell you when to act.
---
Ready to trade with institutional-grade market intelligence? Add the Trend & Liquidity Master to your chart today.
---
*Disclaimer: This indicator is for educational and informational purposes only. Past performance does not guarantee future results. Always conduct your own analysis and practice proper risk management.*

UT3T Stratejisi (Ugur Tufan Trend ve Trade Takip Stratejisi)UT3T Strategy (Trend & Trade Tracking System)
UT3T Strategy is a comprehensive, hybrid trading system designed to capture both long-term trends and short-term trade opportunities. It combines smart cost averaging (DCA), dynamic profit-taking, and Fibonacci-based trade levels into a single, powerful indicator.
This script is ideal for traders looking for a structured approach to managing positions in both trending and ranging markets.
Key Features:
Dual Strategy Engine:
Strategy 1 (Trend Following): Uses EMA crossovers (EMA9/EMA50) to identify trend direction. It includes a smart DCA (Dollar Cost Averaging) mechanism labeled as ADD-LONG to optimize entry prices during corrections.
Strategy 2 (Trade Tracking): Utilizes custom Fibonacci channels to identify potential reversal zones (LONG / SHORT) based on price action and support/resistance levels.
Smart Position Management:
Dynamic Take Profit (TP): Offers an optional "Progressive TP" mode where profit targets increase by 50% after each successful hit (e.g., 10% -> 15% -> 22.5%), allowing you to ride strong trends.
Custom Exit Logic: The SHORT signal is triggered only if a minimum profit threshold (defined by the user) is met, preventing premature exits in small pullbacks.
Visual Clarity:
Clear Labels: Distinguishes between initial entries (LONG) and averaging entries (ADD-LONG) directly on the chart.
Alert System: Includes a fully customizable alert system for every signal type (Trend Entry, DCA, Stop Loss, Take Profit, and Fib Levels).
How to Use:
Symbol Settings: Input your preferred tickers and customize TP/Cost percentages in the settings menu.
Fib Levels: Define custom High/Low prices for Strategy 2 to generate Fib channels automatically.
Alerts: Set alerts based on your trading style (Per Bar Close for trends, Once Per Bar for TP levels).

Vector Trinity III: Flow [CVD]**1. Introduction: The Truth Serum**
This indicator is **Part 3** of the "Vector Trinity" trading system. It is the final validator in the decision-making process.
While Part I defines the *Structure* and Part II identifies the *Impulse*, **Part III (Flow)** answers the most critical question in trading: **"Is there real money behind this move?"**
It represents the **Energy Dimension**, analyzing the Cumulative Volume Delta (CVD) to spot true breakouts and expose traps.
* **I: Structure:** Spatial boundaries.
* **II: Impulse:** Momentum timing.
* **III: Flow:** **Capital validation & Divergence detection (Current Indicator).**
**2. Core Logic: CVD Estimation**
True "Delta" requires tick-by-tick data, which is often unavailable or premium-locked. **Vector Trinity III** uses a sophisticated **Intrabar Position Estimation** algorithm to mathematically approximate buying vs. selling pressure:
* **The Math:** It analyzes where the Close sits relative to the High and Low of the candle.
* Close near High = Dominant Aggressive Buying.
* Close near Low = Dominant Aggressive Selling.
* **The CVD:** It accumulates these delta values over time to create a continuous "Flow" line. This reveals the long-term intent of smart money.
**3. The Trend Line & Divergence**
The indicator features a **Grey Trend Line** (EMA of CVD) which serves as the baseline for "Net Flow."
* **Teal Zone (Above Trend):** Net Inflow. Capital is aggressively entering the market, supporting the price.
* **Maroon Zone (Below Trend):** Net Outflow. Capital is leaving the market, suggesting weakness.
**4. The "Trap" Detector (Divergence)**
The primary superpower of this indicator is spotting **Divergences**:
* **The Bull Trap (Fakeout):** Price makes a Higher High, but CVD makes a Lower High (or trends down).
* *Meaning:* The price is rising due to a lack of liquidity, not aggressive buying. **Smart money is selling into the rally.**
* **The Bear Trap (Shakeout):** Price makes a Lower Low, but CVD makes a Higher Low.
* *Meaning:* Smart money is absorbing the selling pressure (buying the dip).
**5. How to Use**
* **The "Trinity" Confirmation:** Before taking a trade based on Part I (Structure) and Part II (Impulse), look at Part III.
* **For a Long Setup:**
1. Price breaks the Structure (Part I).
2. Momentum fires Green/Cyan (Part II).
3. **Flow (Part III) MUST be Teal and rising.**
* **The Veto Rule:** If Price breaks up, but Flow is Maroon/Falling, **CANCEL the trade**. It is likely a trap.
**Settings:**
* **Trend Length:** 20 (Standard trend baseline to determine Net Inflow/Outflow).
---
### **中文说明**
**1. 简介:市场的“测谎仪”**
本指标是“矢量三位一体”交易系统的 **第三部分**。它是决策过程中最后的验证者。
第一部分 (Structure) 定义了结构,第二部分 (Impulse) 识别了脉冲,而 **第三部分 (Flow)** 则回答了交易中最关键的问题:**“这波行情背后有真钱吗?”**
它代表了系统的 **能量维度**,通过分析累积成交量 Delta (CVD) 来识别真正的突破并揭露市场陷阱。
* **I: Structure 结构:** 空间边界。
* **II: Impulse 脉冲:** 动能时机。
* **III: Flow 流向:** **资金验证与背离侦测(本指标)。**
**2. 核心逻辑:CVD 估算算法**
真正的“Delta”数据通常需要逐笔成交数据 (Tick Data),这往往需要付费数据源。**Vector Trinity III** 使用了一套精密的 **K线内相对位置估算 (Intrabar Position Estimation)** 算法,在数学上逼近真实的买卖压力:
* **算法原理:** 它分析收盘价在 K 线最高价和最低价之间的相对位置。
* 收盘接近最高价 = 主动买入主导。
* 收盘接近最低价 = 主动卖出主导。
* **CVD (累积值):** 它将这些 Delta 值随时间累积,形成一条连续的“资金流向”线。这揭示了主力资金的长期意图。
**3. 趋势线与背离**
指标包含一条 **灰色趋势线** (CVD 的均线),作为“净流量”的基准。
* **青色区域 (趋势线上方):** 净流入。资金正在积极入场,支撑价格上涨。
* **深红区域 (趋势线下方):** 净流出。资金正在撤离市场,暗示行情虚弱。
**4. “陷阱”侦测器 (背离)**
本指标的核心超能力是识别 **背离 (Divergence)**:
* **多头陷阱 (诱多/假突破):** 价格创出新高,但 CVD 却创出新低(或趋势向下)。
* *含义:* 价格上涨是因为缺乏流动性(空涨),而不是因为有主动买盘。**主力资金正在借反弹出货。**
* **空头陷阱 (诱空/洗盘):** 价格创出新低,但 CVD 却在抬高。
* *含义:* 主力资金正在吸收抛压(在此位置吸筹)。
**5. 使用方法**
* **“三位一体”共振验证:** 在根据第一部分 (结构) 和第二部分 (脉冲) 开单之前,必须查看第三部分。
* **做多设置:**
1. 价格突破结构 (Part I)。
2. 动能点火变绿/青色 (Part II)。
3. **资金流 (Part III) 必须呈现青色且向上攀升。**
* **一票否决权:** 如果价格向上突破,但资金流是深红色/下降的,**立即取消交易**。这极大概率是一个陷阱。
**参数设置:**
* **Trend Length (趋势周期):** 20 (用于确定净流入/流出的标准基准线)。
Kinetic Scalper [BULLBYTE]KINETIC SCALPER - ADVANCED MOMENTUM & CONFLUENCE TRADING SYSTEM
A SOPHISTICATED MULTI-FACTOR ANALYSIS INDICATOR FOR PRECISION ENTRIES
The Kinetic Scalper is a comprehensive trading analysis tool that combines volume-weighted momentum calculations, multi-oscillator divergence detection, and a proprietary 15-factor confluence scoring system to identify high-probability reversal setups across all timeframes.
WHAT MAKES THIS INDICATOR ORIGINAL
This is NOT a simple mashup of existing indicators.
The Kinetic Scalper features a completely custom momentum engine called the "Kinetic Pulse" - a volume-weighted momentum oscillator with Fisher Transform normalization that fundamentally differs from standard RSI or other momentum indicators. Every component feeds into a unified algorithmic framework designed specifically for this system.
KEY INNOVATIONS:
KINETIC PULSE ENGINE
Unlike standard RSI which uses simple price changes, the Kinetic Pulse applies:
→ Volume weighting to price movements (high-volume moves carry more weight)
→ EMA smoothing instead of traditional SMA (faster response to changes)
→ Fisher Transform normalization for improved signal clarity
→ Adaptive period adjustment based on current volatility regime
→ Result: A momentum oscillator that responds to conviction, not just price noise
15-FACTOR CONFLUENCE SCORING SYSTEM
Every signal is graded based on the number of confirming factors present:
→ Momentum position (oversold/overbought extremes)
→ Momentum velocity (direction change confirmation)
→ Momentum acceleration (strength of reversal)
→ Multi-oscillator divergence (price vs. 3 oscillators)
→ Volume confirmation (above-average participation)
→ Volume delta analysis (buying vs. selling pressure)
→ Higher timeframe alignment (trend confirmation from larger timeframe)
→ Session timing (major forex session awareness)
→ Structure clearance (clear path to profit targets)
→ Support/resistance proximity (confluence with key levels)
→ Market regime filtering (trending vs. choppy conditions)
Signals are graded A+, A, or B based on how many factors align:
• CONSERVATIVE MODE: A+ requires 12+ factors, A requires 9+, B requires 7+
• BALANCED MODE: A+ requires 10+ factors, A requires 7+, B requires 5+
• AGGRESSIVE MODE: A+ requires 8+ factors, A requires 5+, B requires 3+
TRADE ANALYSIS STATE MACHINE
A sophisticated monitoring system that tracks trade conditions in real-time using:
→ 5-state analysis framework (Factors Aligned / Positive Bias / Mixed Signals / Factors Weakening / Negative Bias)
→ Hysteresis-based transitions (different thresholds to enter vs. exit states)
→ Confidence smoothing with EMA (reduces noise, prevents flip-flopping)
→ Minimum commitment periods before state changes
→ Override logic for significant events (near TP/SL, momentum reversals)
→ Result: Stable, actionable guidance that doesn't change on every bar
INSTRUMENT-AWARE CALIBRATION
Automatically detects what you're trading and applies optimized parameters:
→ Forex Majors: Standard ATR, high session weight
→ Forex Crosses: Tighter stops, moderate session weight
→ Crypto: Wider stops (1.8x multiplier), reduced session weight (24/7 markets)
→ Indices: Moderate-wide stops, high session weight
→ Commodities: Moderate stops, moderate session weight
WHAT THIS INDICATOR DOES
The Kinetic Scalper is designed to identify high-confluence reversal opportunities by analyzing multiple dimensions of market behavior simultaneously.
CORE FUNCTIONS:
1. SIGNAL GENERATION
→ Identifies potential reversal points at oversold/overbought extremes
→ Confirms with multi-oscillator divergence detection
→ Validates with volume, higher timeframe, and structural analysis
→ Filters out low-probability setups automatically
→ Grades signals based on total confluence factors present
2. AUTOMATED TRADE TRACKING
→ Calculates structure-based or ATR-based stop loss levels
→ Projects take profit targets using risk-to-reward ratios
→ Monitors live position status (P/L, distance to targets, R-multiple)
→ Tracks TP1 and TP2 hits automatically
→ Displays outcome markers (TP HIT, PARTIAL WIN, STOPPED)
3. REAL-TIME CONDITION MONITORING
→ Analyzes 6 factor categories during active trades
→ Provides confidence scoring (0-100 scale)
→ Generates actionable guidance based on current market state
→ Alerts when conditions deteriorate or improve
→ Helps with trade management decisions
4. COMPREHENSIVE MARKET ANALYSIS
→ Session detection (Asian, London, New York, Overlap)
→ Volatility regime identification (Low, Normal, High, Extreme)
→ Trend state classification (Trending Up/Down, Ranging, Transitioning)
→ Volume analysis (relative volume and delta approximation)
→ Choppiness filtering (blocks signals in ranging markets)
WHY USE THIS INDICATOR
PROBLEM: Most momentum indicators generate too many false signals at extremes.
SOLUTION: The Kinetic Scalper requires MULTIPLE confirming factors before generating a signal, dramatically reducing noise and focusing on high-confluence setups.
ADVANTAGES:
✓ QUALITY OVER QUANTITY
→ Signal grading ensures you can filter for only the highest-quality setups
→ A+ signals have 10-12+ confirming factors aligned
→ Cooldown periods prevent over-trading the same move
✓ COMPLETE TRADE FRAMEWORK
→ Entry signals with confluence justification
→ Calculated stop loss based on market structure or ATR
→ Two profit targets with clear risk-to-reward ratios
→ Live trade monitoring with factor analysis
→ Outcome tracking and visual markers
✓ ADAPTIVE TO MARKET CONDITIONS
→ Volatility-based period adjustment for momentum calculations
→ Instrument-specific ATR multipliers
→ Session awareness for forex traders
→ Higher timeframe trend filtering
→ Automatic regime detection (trending vs. choppy)
✓ TRANSPARENT METHODOLOGY
→ Every input has detailed tooltips explaining its purpose
→ Signal tooltips show exactly why a signal was generated
→ Dashboard displays all relevant market conditions
→ Factor scores are visible during trades
→ No "black box" mystery calculations
✓ NON-REPAINTING & RELIABLE
→ All signals use barstate.isconfirmed (only on closed bars)
→ Higher timeframe data uses lookahead_off with historical offset
→ No future data access or repainting behavior
→ What you see is what you get - signals don't disappear or move
HOW THE INDICATOR WORKS
SIGNAL GENERATION PROCESS:
STEP 1: MOMENTUM ANALYSIS
The Kinetic Pulse engine calculates volume-weighted momentum:
→ Price changes are weighted by volume ratio vs. 20-bar average
→ High-volume moves have more influence on the oscillator
→ Gains and losses are smoothed using EMA (not SMA like RSI)
→ Fisher Transform is applied for normalization to 0-100 scale
→ Result: Momentum reading that emphasizes conviction, not noise
STEP 2: REVERSAL DETECTION
The indicator looks for potential reversal conditions:
→ Kinetic Pulse reaching oversold zone (below dynamic lower threshold)
→ Momentum velocity turning positive after being negative (for longs)
→ OR bullish divergence detected on multiple oscillators
→ Price making lower lows while oscillators make higher lows = divergence
STEP 3: MULTI-OSCILLATOR DIVERGENCE CONFIRMATION
Divergence is validated across three sources:
→ Kinetic Pulse divergence
→ CCI divergence
→ Stochastic divergence
→ Multiple oscillators confirming divergence increases signal reliability
STEP 4: CONFLUENCE FACTOR SCORING
The system evaluates all 15 possible confirming factors:
→ Momentum position: Is pulse oversold/overbought? (+0 to +2 points)
→ Momentum direction: Is velocity reversing? (+0 to +2 points)
→ Momentum acceleration: Is reversal strengthening? (+0 to +1 point)
→ Divergence count: How many oscillators show divergence? (+0 to +2 points)
→ Volume strength: Is volume above 1.3x average? (+0 to +1 point)
→ Volume delta: Is cumulative delta positive/negative? (+0 to +1 point)
→ HTF alignment: Does higher timeframe support direction? (+0 to +2 points)
→ Session timing: Is it a prime trading session? (+0 to +1 point)
→ Clear air: Is path to targets clear of obstacles? (+0 to +1 point)
→ Structure confluence: Are we near support/resistance? (+0 to +1 point)
→ Market regime: Is market trending, not choppy? (+0 to +1 point)
Total possible score: 15 points
Minimum for signal: 3-12 points depending on sensitivity mode
STEP 5: FILTER VALIDATION
Before generating a signal, additional checks are performed:
→ Volume must be above minimum threshold (if filter enabled)
→ Higher timeframe must not oppose the signal direction (if filter enabled)
→ Target path must be clear of major resistance/support (if filter enabled)
→ Volatility must not be EXTREME (blocks signals in chaos)
→ Risk-to-reward ratio must meet minimum requirement
→ Cooldown period must have elapsed since last signal
STEP 6: SIGNAL GRADING
If all filters pass, the signal is graded based on score:
→ A+ Grade: Highest confluence (8-12+ factors depending on sensitivity)
→ A Grade: High confluence (5-9+ factors)
→ B Grade: Moderate confluence (3-7+ factors)
Only graded signals (A+, A, or B) are displayed.
STEP 7: TRADE LEVEL CALCULATION
Stop loss and targets are calculated automatically:
STOP LOSS METHODS:
• Structure-Based: Uses recent swing low/high with ATR buffer, constrained by min/max ATR limits
• ATR-Based: Pure ATR multiplier with min/max constraints
• Fixed ATR: Simple ATR multiplier, no adjustments
TARGET CALCULATION:
• TP1: Entry ± (Stop Distance × Target 1 R:R)
• TP2: Entry ± (Stop Distance × Target 2 R:R)
• Default: TP1 at 1.0 R:R (1:1), TP2 at 2.0 R:R (1:2)
STEP 8: TRADE MONITORING
Once a signal is taken, the indicator tracks:
→ Current P/L in ticks and R-multiples
→ Distance to each target in ATR units
→ Distance to stop loss in ATR units
→ TP1 hit detection (marks with label, updates lines)
→ TP2 hit detection (closes trade, marks outcome)
→ Stop loss hit detection (closes trade, differentiates partial vs. full loss)
STEP 9: FACTOR ANALYSIS (DURING TRADES)
The Trade Analysis Panel monitors 6 key factor categories:
→ Momentum: Is momentum still aligned with trade direction? (-15 to +15 pts)
→ Position: Current R-multiple position (-12 to +12 pts)
→ Volume: Is volume still supportive? (-6 to +6 pts)
→ HTF Alignment: Does HTF still support trade? (-6 to +8 pts)
→ Target Proximity: How close are we to targets? (0 to +10 pts)
→ Stop Proximity: Are we dangerously close to stop? (-15 to +3 pts)
Raw scores are summed and smoothed using 5-bar EMA to create Confidence Score (0-100).
STEP 10: STATE MACHINE TRANSITIONS
Based on smoothed confidence, the system transitions between 5 states:
→ FACTORS ALIGNED (72+): Everything looks good
→ POSITIVE BIAS (58-72): Conditions favorable
→ MIXED SIGNALS (48-58): Neutral conditions
→ FACTORS WEAKENING (22-48): Concerning signals
→ NEGATIVE BIAS (<22): Poor conditions
Hysteresis prevents rapid flipping between states (different entry/exit thresholds).
RECOMMENDED TIMEFRAMES & INSTRUMENTS
TIMEFRAME VERSATILITY:
Despite the name "Scalper," this indicator works on ALL timeframes:
✓ LOWER TIMEFRAMES (1m - 15m)
→ Ideal for: Scalping and very short-term trades
→ Expect: More signals, faster trades, requires active monitoring
→ Best for: Forex majors, liquid crypto pairs
→ Tip: Use Conservative sensitivity to reduce noise
✓ MID TIMEFRAMES (15m - 1H)
→ Ideal for: Intraday trading and day trading
→ Expect: Moderate signal frequency, 1-4 hour trade duration
→ Best for: Forex, indices, major crypto
→ Tip: Balanced sensitivity works well here
✓ HIGHER TIMEFRAMES (4H - Daily)
→ Ideal for: Swing trading and position trading
→ Expect: Fewer signals, higher-quality setups, multi-day trades
→ Best for: All instruments
→ Tip: Can use Aggressive sensitivity for more opportunities
INSTRUMENT COMPATIBILITY:
✓ FOREX MAJORS (EUR/USD, GBP/USD, USD/JPY, etc.)
→ Auto-detected or manually select "Forex Major"
→ Session filtering is highly valuable here
→ London/NY overlap generates best signals
✓ FOREX CROSSES (EUR/GBP, AUD/NZD, etc.)
→ Auto-detected or manually select "Forex Cross"
→ Slightly tighter stops applied automatically
→ Session weight reduced vs. majors
✓ CRYPTOCURRENCIES (BTC, ETH, SOL, etc.)
→ Auto-detected or manually select "Crypto"
→ Wider stops (1.8x multiplier) due to volatility
→ Session filtering less relevant (24/7 markets)
→ Works well on both spot and perpetual futures
✓ INDICES (S&P 500, NASDAQ, DAX, etc.)
→ Auto-detected or manually select "Index"
→ Session opens (NY, London) are important
→ Moderate stop widths applied
✓ COMMODITIES (Gold, Silver, Oil, etc.)
→ Auto-detected or manually select "Commodity"
→ Moderate stops and session awareness
→ Works well on both spot and futures
VISUAL ELEMENTS EXPLAINED
SIGNAL MARKERS:
The indicator offers 3 display styles (choose in settings):
• PREMIUM STYLE (Default)
→ Signal appears below/above candles with connecting line
→ Background panel with grade badge (LONG , SHORT , etc.)
→ Entry price displayed
→ Direction arrow pointing to entry candle
→ Most informative, best for detailed analysis
• MINIMAL STYLE
→ Simple dot marker with grade text next to it
→ Clean, unobtrusive design
→ Best for mobile devices or cluttered charts
→ Less visual noise
• CLASSIC STYLE
→ Diamond marker with grade badge below/above
→ Traditional indicator aesthetic
→ Good balance between info and simplicity
ALL STYLES INCLUDE:
→ Signal tooltips with complete trade plan details
→ Grade display (A+, A, or B)
→ Color coding (bright colors for A+, standard for A/B)
SIGNAL TOOLTIP CONTENTS:
When you hover over any signal marker, you'll see:
→ Signal direction and grade
→ Confluence score (actual points vs. required)
→ Reason for signal (divergence type, reversal pattern)
→ Complete trade plan (Entry, Stop, TP1, TP2)
→ Risk in ticks
→ Risk-to-reward ratios
→ Market conditions at signal (Pulse value, HTF status, Volume, Session)
TRADE LEVEL LINES:
When Trade Tracking is enabled:
• ENTRY LINE (Yellow/Gold)
→ Solid horizontal line at entry price
→ Shaded zone around entry (±ATR buffer)
→ Label showing entry price
→ Extends 20-25 bars into future
• STOP LOSS LINE (Orange/Red)
→ Dashed line at stop level
→ Label showing stop price and distance in ticks
→ Turns dotted and changes color after TP1 hit (breakeven implied)
→ Deleted when trade closes
• TAKE PROFIT 1 LINE (Blue)
→ Dotted line at TP1 level
→ Label showing price and R:R ratio (e.g., "1:1.0")
→ Turns solid and changes to green when hit
→ Deleted after TP1 hit
• TAKE PROFIT 2 LINE (Blue)
→ Solid line at TP2 level
→ Label showing price and R:R ratio (e.g., "1:2.0")
→ This is the "full win" target
→ Deleted when trade closes
OUTCOME MARKERS:
When trade milestones are reached:
• - Green label appears when first target is touched
• - Green label when second target is touched (trade complete)
• - Red label if stop loss hit before any target
• - Orange label if TP1 hit but then stopped out
PREVIOUS DAY LEVELS:
If enabled (Show Previous Day Levels):
• PDH (Previous Day High) - Solid red/orange line
→ Label shows "PDH: "
→ Useful resistance reference for intraday trading
• PDL (Previous Day Low) - Solid green line
→ Label shows "PDL: "
→ Useful support reference for intraday trading
BACKGROUND TINTS:
Subtle background colors indicate states:
→ Light green tint: Active long position being tracked
→ Light red tint: Active short position being tracked
→ Light orange tint: Extreme volatility warning (signals blocked)
DASHBOARD GUIDE
The indicator features TWO dashboard panels:
━━━━━━━━━━━━━━━━━━━━━━━━━━━━━━━━━━━━━━━━━━━━━━━━━━━━━━━━━━━━━━━━━━━━━━━━━━━━━
MAIN DASHBOARD (Top Right by default)
━━━━━━━━━━━━━━━━━━━━━━━━━━━━━━━━━━━━━━━━━━━━━━━━━━━━━━━━━━━━━━━━━━━━━━━━━━━━━
WHEN NO TRADE IS ACTIVE:
→ Bias: Current market bias (BULLISH, BEARISH, NEUTRAL, LEAN LONG/SHORT)
→ Based on Kinetic Pulse position and velocity
→ Helps you understand overall momentum direction
→ Pulse: Current Kinetic Pulse value (0-100 scale)
→ <30 = Oversold (potential long setups developing)
→ >70 = Overbought (potential short setups developing)
→ 40-60 = Neutral zone
→ Volatility: Current volatility regime (LOW, NORMAL, HIGH, EXTREME)
→ Calculated from ATR ratio vs. 100-period average
→ EXTREME volatility blocks all signals (too chaotic)
→ Trend: Market state classification
→ TREND UP / TREND DOWN: ADX > 25, directional movement clear
→ RANGING: ADX < 20, choppy conditions
→ TRANSITIONING: ADX 20-25, developing conditions
→ VOLATILE: Extreme ATR regime
→ Session: Current forex session
→ ASIAN (00:00-08:00 UTC)
→ LONDON (07:00-16:00 UTC)
→ NEW YORK (13:00-22:00 UTC)
→ LDN/NY (13:00-16:00 UTC) - Overlap period, highest volatility
→ OFF-HOURS: Outside major sessions
→ Volume: Current volume vs. 20-bar average
→ Displayed as multiplier (e.g., "1.45x" = 45% above average)
→ Green if >1.3x (high volume, bullish for signal quality)
→ Red if <0.8x (low volume, bearish for signal quality)
→ HTF: Higher timeframe analysis status
→ BULLISH: HTF momentum supports longs
→ BEARISH: HTF momentum supports shorts
→ NEUTRAL: No clear HTF direction
→ Best Score: Highest confluence score currently available
→ Shows both long and short scores
→ Format: " / "
→ Example: "8/7 " means long score is 8, threshold is 7, long is leading
→ Helps you anticipate which direction might signal next
→ PDH/PDL: Previous day high and low prices
→ Quick reference for intraday support/resistance
WHEN TRADE IS ACTIVE:
→ Trade: Direction and grade (e.g., "LONG ")
→ Entry: Entry price of current trade
→ P/L: Current profit/loss
→ Shown in ticks and R-multiples
→ Format: "+45 | +0.75R" or "-20 | -0.35R"
→ Green when positive, red when negative
→ TP1: First target status
→ Shows price and distance if not hit
→ Shows "HIT" in green if reached
→ TP2: Second target price and distance
→ Stop: Stop loss price and current distance from stop
→ Bars: Number of bars since entry (trade duration)
━━━━━━━━━━━━━━━━━━━━━━━━━━━━━━━━━━━━━━━━━━━━━━━━━━━━━━━━━━━━━━━━━━━━━━━━━━━━━
TRADE ANALYSIS PANEL (Bottom Left by default)
━━━━━━━━━━━━━━━━━━━━━━━━━━━━━━━━━━━━━━━━━━━━━━━━━━━━━━━━━━━━━━━━━━━━━━━━━━━━━
This panel provides algorithmic analysis of market conditions. It does NOT provide investment advice or recommendations.
WHEN NO TRADE IS ACTIVE:
Shows scanning status and signal readiness:
→ Long/Short Readiness Gauges
→ Visual bar showing proximity to signal threshold
→ Score display (e.g., "8/7" means 8 points scored, 7 needed)
→ "RDY" indicator when threshold reached
→ Status Messages
→ "Scanning for setups..." - Normal scanning mode
→ "Long setup ready - cooldown: X bars" - Signal qualified but in cooldown
→ "Oversold conditions - watch for reversal" - Setup developing
→ "Choppy conditions detected" - Warning about market state
→ "Extreme volatility - signals blocked" - Safety filter active
WHEN TRADE IS ACTIVE:
Header shows current analysis state:
→ FACTORS ALIGNED (Green) - Everything looks good, confidence 72+
→ POSITIVE BIAS (Light Green) - Conditions favorable, confidence 58-72
→ MIXED SIGNALS (Blue) - Neutral conditions, confidence 48-58
→ FACTORS WEAKENING (Orange) - Concerning signals, confidence 22-48
→ NEGATIVE BIAS (Red) - Poor conditions, confidence <22
Confidence Score:
→ Displayed as percentage (0-100%)
→ Visual gauge (|||||.....)
→ Trend indicator (Rising, Falling, Stable)
→ Shows momentum of confidence change
Factor Breakdown (if enabled):
Shows 6 factor categories with individual scores:
→ Momentum: Is momentum aligned with trade? (-15 to +15 points)
→ Positive if velocity matches trade direction
→ Negative if momentum opposes trade
→ Position: Current R-multiple analysis (-12 to +12 points)
→ Positive if trade is in profit
→ Negative if underwater
→ Score increases as profit grows
→ Volume: Is volume supportive? (-6 to +6 points)
→ Positive if volume above average
→ Negative if volume weak
→ HTF Align: Higher timeframe status (-6 to +8 points)
→ Positive if HTF still supports trade direction
→ Negative if HTF turned against trade
→ Target: Proximity to profit targets (0 to +10 points)
→ Higher score when approaching targets
→ Bonus if TP1 already hit and near TP2
→ Stop Dist: Distance from stop loss (-15 to +3 points)
→ Negative if dangerously close to stop (<0.3 ATR)
→ Positive if well away from stop (>1.5 ATR)
Each factor shows:
• Score value with +/- indicator
• Trend symbol: + (improving), - (deteriorating), = (stable)
• Visual gauge
Guidance Messages:
→ "TARGET 2 APPROACHING" - TP2 within 0.3 ATR
→ "TARGET 1 APPROACHING" - TP1 within 0.3 ATR
→ "STOP PROXIMITY WARNING" - Stop within 0.3 ATR
→ "Factors aligned - Holding" - Positive state, stay in trade
→ "Conditions favorable" - Still looking good
→ "Conditions mixed - " - Neutral assessment
→ "Factors deteriorating" - Warning of weakening setup
→ "Confluence weakening - secure gains" - Consider exit if profitable
COMPACT MODE (Mobile-Friendly):
→ Reduces panel size by showing only essential info
→ Factor icons instead of full breakdowns
→ Simplified guidance messages
→ Perfect for smaller screens
SETTINGS GUIDE
MASTER SETTINGS:
Instrument Type
→ Purpose: Optimizes ATR multipliers and session weights for your asset
→ Options: Auto-Detect (recommended), Forex Major, Forex Cross, Crypto, Index, Commodity
→ Default: Auto-Detect
→ When to change: If auto-detection is incorrect for your symbol
Signal Sensitivity
→ Purpose: Controls how many factors required before generating signals
→ Options:
• Conservative: Requires 12+ for A+, 9+ for A, 7+ for B (fewer, highest quality)
• Balanced: Requires 10+ for A+, 7+ for A, 5+ for B (recommended)
• Aggressive: Requires 8+ for A+, 5+ for A, 3+ for B (more frequent)
→ Default: Balanced
→ When to change: If you want fewer signals (Conservative) or more opportunities (Aggressive)
Enable Trade Signals
→ Purpose: Master on/off switch for signal generation
→ Default: ON
→ When to disable: If you only want to use the analysis dashboards without signals
Enable Trade Tracking
→ Purpose: Tracks active trades and monitors conditions until TP/SL hit
→ Default: ON
→ When to disable: If you manage trades manually and don't want automatic tracking
Show Entry/Stop/Target Levels
→ Purpose: Displays trade plan lines and labels on chart
→ Default: ON
→ When to disable: If you prefer clean charts or manage levels yourself
DISPLAY SETTINGS:
Color Theme
→ Purpose: Optimizes colors for your chart background
→ Options: Dark (for dark charts), Light (for light charts)
→ Default: Dark
Signal Display Style
→ Purpose: Visual style of signal markers
→ Options:
• Premium: Badge with line and background panel (most detailed)
• Minimal: Simple dot with grade text (cleanest)
• Classic: Diamond marker with badge (traditional)
→ Default: Premium
Signal Distance
→ Purpose: How far signal labels appear from price bars (in ATR units)
→ Range: 0.5 to 10.0
→ Default: 2.0
→ When to adjust: Increase to 3.0-4.0 if signals hide behind candle wicks
TP/SL Label Distance
→ Purpose: Spacing of price labels to prevent overlap
→ Range: 0.5 to 5.0
→ Default: 1.5
Show Previous Day Levels
→ Purpose: Display PDH/PDL reference lines
→ Default: ON
→ Best for: Intraday traders who respect previous day levels
MAIN DASHBOARD:
Show Main Dashboard
→ Purpose: Toggle visibility of market conditions table
→ Default: ON
Main Dashboard Position
→ Options: Top Right, Top Left, Bottom Right, Bottom Left
→ Default: Top Right
→ When to change: To avoid overlap with TradingView's built-in panels
TRADE ANALYSIS PANEL:
Show Trade Analysis Panel
→ Purpose: Toggle factor analysis dashboard
→ Default: ON
Analysis Panel Position
→ Options: Top Right, Top Left, Bottom Right, Bottom Left, Middle Right, Middle Left
→ Default: Bottom Left
→ Recommended: Bottom Right or Middle Right to avoid overlap with Main Dashboard
Compact Mode
→ Purpose: Reduces panel size for mobile or smaller screens
→ Default: OFF
→ When to enable: Mobile trading, small screens, or minimalist preference
Show Factor Details
→ Purpose: Displays individual factor scores vs. overall confidence only
→ Default: ON
→ When to disable: For more compact view showing only state and confidence
RISK MANAGEMENT:
Stop Loss Method
→ Purpose: How stop loss distance is calculated
→ Options:
• Structure-Based: Uses swing highs/lows with ATR buffer (recommended)
• ATR-Based: Pure ATR multiplier with min/max constraints
• Fixed ATR: Simple multiplier, no adjustments
→ Default: Structure-Based
→ Impact: Structure-Based respects market geometry but constrains within safe limits
ATR Stop Multiplier
→ Purpose: Multiplier for ATR-based stop calculation
→ Range: 0.5 to 3.0
→ Default: 1.5
→ When to adjust:
• Increase to 2.0-2.5 for more breathing room (fewer false stops)
• Decrease to 1.0-1.2 for tighter stops (but more stop-outs)
Maximum Stop Distance (ATR)
→ Purpose: Cap on stop width to prevent excessive risk
→ Range: 1.0 to 5.0
→ Default: 2.5
→ Impact: If structure-based stop exceeds this, ATR-based stop is used instead
Minimum Stop Distance (ATR)
→ Purpose: Floor on stop width to avoid noise-induced stops
→ Range: 0.2 to 1.0
→ Default: 0.5
→ Impact: Prevents stops too tight to survive normal volatility
Target 1 Risk/Reward Ratio
→ Purpose: R:R for first profit target
→ Range: 0.5 to 2.0
→ Default: 1.0 (1:1 ratio)
→ Common values: 1.0 for quick profit taking, 1.5 for patient trading
Target 2 Risk/Reward Ratio
→ Purpose: R:R for second profit target (full win)
→ Range: 1.0 to 4.0
→ Default: 2.0 (1:2 ratio)
→ Common values: 2.0-3.0 for balanced risk/reward
Minimum R:R Required
→ Purpose: Filters out signals with poor risk/reward
→ Range: 0.5 to 2.0
→ Default: 1.0
→ Impact: Signals where potential reward doesn't meet this ratio are rejected
→ WARNING: Always ensure your position sizing means a stop loss = no more than 1-2% of your account, regardless of R:R ratio
SIGNAL FILTERS:
Session Awareness
→ Purpose: Weights signals higher during major forex sessions
→ Default: ON
→ Impact: Doesn't block signals, but session quality factors into scoring
→ Best for: Forex traders
Session Timezone
→ Purpose: Timezone for session calculations
→ Options: UTC, America/New_York, Europe/London, Asia/Tokyo, Asia/Hong_Kong
→ Default: UTC
→ When to change: Match your broker's server time
Higher Timeframe Alignment
→ Purpose: Checks HTF momentum before generating signals
→ Default: ON
→ Impact: Filters counter-trend signals, improves quality
→ Recommended: Keep enabled
HTF Timeframe
→ Purpose: Which higher timeframe to check
→ Default: Auto (blank field)
→ Auto selection:
• 1m chart → 5m HTF
• 5m chart → 15m HTF
• 15m chart → 1H HTF
• 1H chart → 4H HTF
• 4H+ chart → Daily HTF
→ Manual override: Enter any timeframe (e.g., "60" for 1-hour)
Volume Confirmation
→ Purpose: Requires above-average volume for signals
→ Default: ON
→ Impact: Filters low-liquidity false signals
→ Recommended: Keep enabled
Minimum Volume Ratio
→ Purpose: Volume threshold vs. 20-bar average
→ Range: 0.3 to 2.0
→ Default: 0.8 (80% of average)
→ When to adjust:
• Increase to 1.2-1.5 for only high-volume signals
• Decrease to 0.5-0.7 for more permissive filtering
Structure Clearance Check
→ Purpose: Ensures clear path to targets (no nearby resistance/support)
→ Default: ON
→ Impact: Prevents trades with immediate obstacles
→ Recommended: Keep enabled
Minimum Bars Between Signals
→ Purpose: Cooldown period after each signal
→ Range: 1 to 10
→ Default: 3
→ Impact: After a signal, this many bars must pass before another in same direction
→ When to adjust:
• Increase to 5-7 to prevent over-trading
• Decrease to 1-2 for faster re-entries
ADVANCED TUNING:
Momentum Period
→ Purpose: Base period for Kinetic Pulse calculation
→ Range: 5 to 30
→ Default: 14
→ When to adjust:
• Lower (8-10): More responsive, noisier
• Higher (18-21): Smoother, slower to react
→ Note: If Adaptive Period enabled, this is adjusted automatically
Adaptive Period
→ Purpose: Auto-adjusts momentum period based on volatility
→ Default: ON
→ Impact: Shortens period in high volatility, lengthens in low volatility
→ Recommended: Keep enabled for automatic optimization
Divergence Lookback
→ Purpose: How far back to search for divergence patterns
→ Range: 10 to 60
→ Default: 30
→ When to adjust:
• Shorter (15-20): Only recent divergences
• Longer (40-50): Catches older divergences (may be less relevant)
Swing Detection Bars
→ Purpose: Bars required on each side to confirm swing high/low
→ Range: 2 to 7
→ Default: 3
→ Impact on stops:
• Lower (2-3): More swing points, potentially tighter stops
• Higher (5-7): Only major swings, wider stops
Choppiness Index Threshold
→ Purpose: Threshold above which market considered choppy
→ Range: 38.2 to 80.0
→ Default: 61.8
→ Impact:
• Lower (50-55): Stricter quality filter (fewer signals in ranging markets)
• Higher (65-70): More permissive (allows signals in choppier conditions)
HOW TO READ SIGNALS
SIGNAL ANATOMY:
When a signal appears, you'll see:
1. DIRECTIONAL MARKER
→ Arrow, dot, or diamond pointing to entry candle (depends on style)
→ Positioned below price for LONG, above price for SHORT
→ Connected to price with line (Premium style)
2. GRADE BADGE
→ Displays signal quality: LONG , SHORT , etc.
→ Color coding:
• Bright green/cyan for A+ longs
• Standard green for A/B longs
• Bright pink/magenta for A+ shorts
• Standard red for A/B shorts
3. ENTRY PRICE (Premium style only)
→ Shows exact entry price at signal generation
4. TOOLTIP (all styles)
→ Hover over signal to see complete trade plan
→ Includes: Entry, Stop, TP1, TP2, Risk, R:R ratios, market conditions, signal reason, confluence score
INTERPRETING GRADES:
→ A+ SIGNALS (Highest Quality)
• 8-12+ confirming factors aligned
• Multiple divergences OR strong momentum reversal
• HTF alignment + volume + session timing + clear structure
• These are your highest-probability setups
• Recommended action: Give these priority, consider larger position size
→ A SIGNALS (High Quality)
• 5-9+ confirming factors aligned
• Good confluence, most key factors present
• Missing 1-2 optimal conditions
• These are still quality trades
• Recommended action: Standard position size, solid setups
→ B SIGNALS (Moderate Quality)
• 3-7+ confirming factors aligned
• Minimum viable confluence
• May be missing HTF alignment, volume, or session timing
• Higher variance outcomes
• Recommended action: Smaller position size or skip if conservative
SIGNAL NARRATIVE:
Each signal tooltip includes a narrative explaining WHY it was generated:
→ "Multi-divergence at oversold extreme"
• Multiple oscillators showing bullish divergence
• Kinetic Pulse in oversold zone
• High-quality reversal setup
→ "Bullish divergence near support"
• Divergence detected
• Price near key support level (swing low or PDL)
• Structure confluence
→ "Momentum reversal with HTF alignment"
• Kinetic Pulse velocity reversing
• Higher timeframe supports direction
• Strong trend-following setup
→ "Oversold momentum reversal"
• Extreme Kinetic Pulse reading reversing
• May not have divergence but strong momentum shift
READING THE TRADE PLAN:
Every signal comes with a complete trade plan:
→ ENTRY: The close price of the signal candle
• This is where the signal triggered
• If using limit orders, you might improve on this price
→ STOP: Calculated stop loss level
• Based on your Stop Loss Method setting
• Distance shown in ticks
• Risk tolerance: Ensure this represents ≤1-2% of your account
→ TP1: First profit target
• Default: 1:1 risk-reward
• This is your partial profit or first exit
• Consider taking 50% off at TP1
→ TP2: Second profit target
• Default: 1:2 risk-reward
• This is your "full win" target
• Hold remaining position for this level
SIGNAL FREQUENCY EXPECTATIONS:
Frequency varies by timeframe, sensitivity, and market conditions:
→ AGGRESSIVE MODE
• Lower timeframes (1m-5m): 5-15 signals per day
• Mid timeframes (15m-1H): 2-5 signals per day
• Higher timeframes (4H-D): 1-3 signals per week
→ BALANCED MODE (Default)
• Lower timeframes: 3-8 signals per day
• Mid timeframes: 1-3 signals per day
• Higher timeframes: 2-5 signals per week
→ CONSERVATIVE MODE
• Lower timeframes: 1-4 signals per day
• Mid timeframes: 0-2 signals per day
• Higher timeframes: 1-3 signals per week
Note: Frequency also depends on market volatility and trending vs. ranging conditions.
Example - Kinetic Scalper Trade Sequence
Here's an example showing the complete trade lifecycle with all dashboard transitions, annotations, and descriptions.
INSTRUMENT & TIMEFRAME DETAILS
Symbol: Nifty 50 Index (NSE)
Date: December 15, 2025
Session: London session (active trading hours)
Instrument Type: Index (auto-detected)
TRADE SEQUENCE BREAKDOWN
SCREENSHOT 1: Pre-Signal Setup Building (Image 1)
Time: ~12:00-14:30 UTC+5:30(approx.)
Price Action: Uptrend showing signs of exhaustion near 26,200
Market State: Price at session highs
Main Dashboard (Top Right):
- Bias: LEAN SHORT
- Pulse: 58.9 (approaching overbought)
- Volatility: NORMAL
- Trend: TRANSITIONING
- Session: LONDON (favorable timing)
- Volume: 0.98x (slightly below average)
- HTF: BULLISH (caution for counter-trend)
- Best Score: 9/5 (Short score building)
- PDH/PDL: 26098.25 / 25938.95
Trade Analysis Panel (Bottom Left):
- Status: NO ACTIVE TRADE
- Long Score: 5/5 (RDY)
- Short Score: 9/5 (RDY)
- Panel Message: "Short pattern developing - score: 9"
Description :
Setup Development Phase: The indicator identifies a potential short opportunity as price reaches the previous day's high. The short confluence score has climbed to 9/15 points, meeting the 'Balanced' sensitivity threshold for a Grade B signal. Notice the 'LEAN SHORT' bias and the Kinetic Pulse reading of 58.9 approaching overbought territory. The Trade Analysis panel shows 'Short pattern developing' with 9/5 factors aligned. Key factors: momentum approaching reversal zone, price at resistance (PDH), and London session providing favorable conditions.
SCREENSHOT 2: Signal Generated & Trade Entered (Image 2)
Time: ~13:00 UTC+5:30 (signal bar)
Entry Price: 26,184.65
Signal Grade: Grade
Main Dashboard (Top Right):
- Trade: SHORT
- Entry: 26184.65
- P/L: 5.95 pts | +0.2R (early positive movement)
- TP1: 26157.00 (33.2 pts away)
- TP2: 26129.35 (60.84 pts away)
- Stop: 26212.30 (22.1 pts away)
- Bars: 1 (just entered)
Trade Analysis Panel (Bottom Left):
- Header: TRADE ANALYSIS
- Status Bar: "Conditions mixed - improving 57%"
- Confidence: 57% RISING
- Factor Breakdown:
- Momentum: -4 (velocity not yet aligned)
- Position: +4 (slight profit)
- Volume: +2 = (volume present)
- HTF Align: +2 = (not strongly aligned)
- Target: +0 - (far from TP)
- Stop Dist: +3 - (good distance)
- Bottom Status: "Conditions mixed - Monitoring"
- Disclaimer: "Analysis only - Not financial advice"
Description:
Signal Activation: A Grade A short signal triggers at 26,184.65 after the short confluence score reached qualifying levels. The indicator places a structure-based stop loss at 26,212.30 (27.65 points risk) with dual targets at 1:1 and 1:2 risk-reward ratios.
The Trade Analysis Panel immediately begins monitoring with an initial confidence score of 57% - classified as 'MIXED SIGNALS' but showing a 'RISING' trend. Factor analysis reveals: momentum not yet aligned (-4 points as price just reversed), position slightly favorable (+4 points already +0.2R), volume adequate (+2), HTF showing weak alignment (+2 as we're counter-trend), stop well-placed (+3), but targets still distant (0 points).
Notice how the Main Dashboard switches from market scanning mode to active trade tracking, now displaying entry price, live P/L in both points (5.95 pts) and R-multiples (+0.2R), and distances to all key levels. The analysis panel provides real-time factor scoring to help monitor trade health.
SCREENSHOT 3: TP1 Hit - Trade Performing Well (Image 3)
Time: ~14:20 UTC+5:30(approx)
Price: ~26,154 (TP1 zone)
Bars in Trade: 29
Main Dashboard (Top Right):
- Trade: SHORT
- Entry: 26184.65
- P/L: 30.85 pts | +1.12R (excellent progress)
- TP1: HIT (displayed in green)
- TP2: 26129.35 (24.44 pts away)
- Stop: 26212.30 (58.5 pts away - well protected)
- Bars: 29
Trade Analysis Panel (Bottom Left):
- Header: TRADE ANALYSIS
- Status Bar: "Multiple factors positive"
- Confidence: 78% RISING
- Factor Breakdown:
- Momentum: +8 = (ALIGNED)
- Position: +8 + (strong profit zone)
- Volume: +2 + (continued support)
- HTF Align: +8 = (now strongly aligned)
- Target: +10 + (TP1 achieved, approaching TP2)
- Stop Dist: +3 + (excellent cushion)
- Bottom Status: "Multiple factors positive"
- Visual State: Green background (FACTORS ALIGNED state)
Description:
Trade Execution Phase - First Target Achieved: After 29 bars , price reaches the first take-profit target at 26,157.00. The ' ' marker confirms partial profit taking. Current P/L shows +30.85 points (+1.12R), exceeding the initial 1:1 risk-reward.
The Trade Analysis Panel shows dramatic improvement - confidence has surged to 78% (FACTORS ALIGNED state) with most factors now positive:
- Momentum factor improved to +8 (velocity aligned with trade direction)
- Position factor at +8 (over +1R profit zone)
- HTF Align jumped to +8 (higher timeframe now confirming the move)
- Target factor maxed at +10 (TP1 achieved, TP2 within reach)
- Stop Distance at +3 (58.5 points cushion providing safety)
Notice the panel status displays 'Multiple factors positive' with a green-tinted background, indicating optimal trade conditions. The confidence trend shows 'RISING' suggesting continued momentum. With TP1 secured and only 24.44 points to TP2, the trade is well-positioned for a full 1:2R win.
SCREENSHOT 4: TP2 Reached - Trade Complete (Image 4)
Time: ~15:00+ UTC+5:30
Final Exit: 26,129.35 (TP2)
Final Result: Full TP2 win
Main Dashboard (Top Right):
- Bias: NEUTRAL (reverted to scanning mode)
- Pulse: 45.2 (returned to neutral zone)
- Volatility: NORMAL
- Trend: TREND DOWN (confirmed the move)
- Session: LONDON
- Volume: 1.26x (increased as move developed)
- HTF: BEARISH (fully aligned post-trade)
- Best Score: 5/5 (neutral after completion)
Trade Analysis Panel (Bottom Left):
- Status: NO ACTIVE TRADE (reverted)
- Long Score: 5/5 (RDY)
- Short Score: 5/5 (RDY)
- Panel Message: "Scanning - prime session active"
- Light blue/cyan background (back to scanning mode)
Description:
Trade Completion - Full Target Achieved: The short trade reaches its second take-profit target at 26,129.35, securing a complete 1:2 risk-reward win. The ' ' marker confirms the exit. Final results:
- Entry: 26,184.65
- Exit: 26,129.35
- Profit: 55.30 points (approximately +2.0R)
- Outcome: Full TP2 success
Post-Trade Analysis: After trade closure, the indicator automatically returns to market scanning mode. The Main Dashboard reverts to showing market conditions rather than trade metrics. Notice how the 'Trend' now displays 'TREND DOWN' - confirming the move we captured. Volume increased to 1.26x during the winning move, validating the signal quality.
The Trade Analysis Panel switches back to 'NO ACTIVE TRADE' status and resumes displaying long/short setup scores. The confidence-based factor monitoring was instrumental throughout the trade:
- Initial entry at 57% confidence (MIXED SIGNALS)
- Peak confidence of 78% at TP1 (FACTORS ALIGNED)
- Real-time factor updates helped confirm trade validity
This example demonstrates the indicator's complete workflow: setup identification → signal generation → entry execution → live trade monitoring → systematic exit at targets.
KEY FEATURES DEMONSTRATED
1. Dual Dashboard System
- Main Dashboard: Market conditions (scanning) → Trade metrics (active position)
- Analysis Panel: Setup scores (scanning) → Factor-based confidence (in-trade)
2. Visual Trade Management
- Color-coded entry zones (yellow)
- Risk levels clearly marked (red dashed stop)
- Profit targets with R:R ratios labeled
- Achievement markers ( , )
3. Real-Time Factor Analysis
- 6-factor scoring system (Momentum, Position, Volume, HTF, Target, Stop Dist)
- Confidence percentage with trend indicators
- State machine (MIXED → FACTORS ALIGNED)
- Hysteresis prevents false state changes
4. Risk Management
- Structure-based stop placement (respects swing highs)
- Multiple take-profit levels (1:1 and 1:2 R:R)
- Live P/L tracking in points and R-multiples
- Distance monitoring to all key levels
This complete example showcases the indicator's progression from setup identification through trade completion, demonstrating how the dual-dashboard system and factor-based analysis provide continuous trade guidance. The structured stop-loss and dual-target approach delivered the planned 1:2 risk-reward ratio with systematic, rule-based execution.
ALERT SYSTEM
The indicator includes 9 built-in alert conditions:
SIGNAL ALERTS:
→ High-Grade Long Signal (A+)
• Triggers only on A+ long signals
• For traders who want only the highest-quality longs
• Message: "KINETIC SCALPER: LONG @ "
→ High-Grade Short Signal (A+)
• Triggers only on A+ short signals
• For traders who want only the highest-quality shorts
• Message: "KINETIC SCALPER: SHORT @ "
→ Long Signal
• Triggers on ANY qualified long signal (A+, A, or B)
• For traders who want all long opportunities
• Message: "KINETIC SCALPER: LONG @ "
→ Short Signal
• Triggers on ANY qualified short signal
• For traders who want all short opportunities
• Message: "KINETIC SCALPER: SHORT @ "
TRADE MANAGEMENT ALERTS:
→ TP1 Hit
• Triggers when first profit target is reached
• Useful for partial profit taking notifications
• Message: "KINETIC SCALPER: TP1 REACHED"
→ TP2 Reached
• Triggers when second profit target is reached
• Trade is complete, full win achieved
• Message: "KINETIC SCALPER: TP2 REACHED"
→ Stop Loss Hit
• Triggers when stop loss is reached
• Important for trade management and risk tracking
• Message: "KINETIC SCALPER: STOP LOSS"
ANALYSIS STATE ALERTS:
→ Analysis State: Negative Bias
• Triggers when factor analysis enters "Negative Bias" state
• Warning that trade conditions are deteriorating
• Consider reducing position or preparing to exit
• Message: "KINETIC SCALPER: Analysis state changed to NEGATIVE BIAS"
→ Analysis State: Factors Weakening
• Triggers when factor analysis enters "Factors Weakening" state
• Caution that confluence is diminishing
• Monitor trade closely
• Message: "KINETIC SCALPER: Analysis state changed to FACTORS WEAKENING"
HOW TO SET UP ALERTS:
1. Click the "Create Alert" button in TradingView
2. Condition: Select "Kinetic Scalper "
3. Choose your desired alert from the dropdown
4. Configure your alert options:
→ Once Per Bar Close (recommended for non-repainting)
→ Frequency: Once Per Bar Close or Only Once
5. Set expiration and notification methods (popup, email, webhook, etc.)
6. Create alert
RECOMMENDED ALERT STRATEGY:
For active traders:
→ Set "Long Signal" and "Short Signal" alerts for all opportunities
→ Set "TP1 Hit", "TP2 Reached", and "Stop Loss Hit" for trade management
→ Consider "Analysis State: Negative Bias" for trade monitoring
For selective traders:
→ Set only "High-Grade Long Signal (A+)" and "High-Grade Short Signal (A+)"
→ Focus on the absolute highest-quality setups
→ Set TP/SL alerts for position management
USAGE TIPS & BEST PRACTICES
SIGNAL SELECTION:
✓ GRADE MATTERS
→ A+ signals have statistically more confluence factors
→ If you're conservative, trade only A+ signals
→ B signals can work but require more discretion
✓ CONFLUENCE WITH YOUR ANALYSIS
→ Use this indicator as CONFIRMATION, not sole decision criteria
→ Combine with your own support/resistance analysis
→ Check for fundamental events (news, economic data)
→ Respect major round numbers and psychological levels
✓ SESSION TIMING (Forex)
→ Best signals often occur during London/NY overlap
→ Avoid signals 10 minutes before major news releases
→ Asian session signals can be valid but lower liquidity
✓ TIMEFRAME CONFLUENCE
→ If you get an A+ signal on 15m, check if 1H chart agrees
→ Higher timeframe confirmation adds conviction
→ Avoid signals that oppose the daily/4H trend
TRADE MANAGEMENT:
✓ POSITION SIZING
→ ALWAYS size positions so stop loss = 1-2% of account
→ Never risk more than you can afford to lose
→ Smaller position on B signals, standard on A, larger on A+ (within limits)
✓ PARTIAL PROFIT TAKING
→ Consider taking 50% off at TP1
→ Move stop to breakeven after TP1 hit
→ Let remaining position run to TP2
✓ TRAILING STOPS
→ The indicator doesn't auto-trail stops (manual decision)
→ After TP1, you might manually move stop to entry (breakeven)
→ Consider ATR-based trailing stop for runners
✓ WATCH THE ANALYSIS PANEL
→ If state changes to "Factors Weakening" while in profit, consider exit
→ "Negative Bias" during a trade is a strong warning
→ "Factors Aligned" confirms your trade thesis is still valid
RISK MANAGEMENT:
✓ NEVER IGNORE STOPS
→ The calculated stop is there for a reason
→ Moving stop further away increases risk exponentially
→ If stopped out, accept it and wait for next setup
✓ AVOID REVENGE TRADING
→ If you get stopped out, resist urge to immediately re-enter
→ Signal cooldown helps with this
→ Wait for next qualified signal
✓ RESPECT VOLATILITY WARNINGS
→ If indicator shows "EXTREME" volatility, signals are blocked for a reason
→ Don't force trades in chaotic conditions
→ Wait for regime to normalize
✓ CORRELATION RISK
→ Be aware of correlation if trading multiple pairs
→ EUR/USD and GBP/USD are highly correlated
→ Don't stack risk on correlated instruments
OPTIMIZATION:
✓ START WITH DEFAULTS
→ Default settings are well-tested
→ Don't over-optimize for recent market behavior
→ Give settings at least 20-30 trades before judging
✓ TIMEFRAME-SPECIFIC ADJUSTMENTS
→ Lower timeframes: Consider increasing Signal Distance to 3.0-4.0
→ Higher timeframes: ATR Stop Multiplier might go to 2.0-2.5
→ Crypto: Ensure Instrument Type is set to "Crypto" for proper stops
✓ SENSITIVITY CALIBRATION
→ Too many signals? Switch to Conservative
→ Missing good setups? Try Balanced or Aggressive
→ Quality > Quantity always
✓ KEEP A JOURNAL
→ Track which signal grades work best for you
→ Note which sessions produce best results
→ Review stopped trades for patterns
THINGS TO AVOID:
✗ DON'T chase signals after several bars have passed
✗ DON'T ignore the stop loss or move it further away
✗ DON'T overtrade by taking every B-grade signal
✗ DON'T trade during major news if you're not experienced
✗ DON'T use this as your only analysis tool
✗ DON'T expect 100% win rate (no indicator has this)
✗ DON'T risk more than 1-2% per trade regardless of signal grade
UNDERSTANDING THE METHODOLOGY
WHY VOLUME WEIGHTING?
Traditional momentum oscillators treat all price moves equally. A 10-point move on low volume is weighted the same as a 10-point move on high volume.
The Kinetic Pulse corrects this by:
→ Calculating volume ratio vs. 20-bar average
→ Applying square root transformation to volume ratio (prevents extreme weights)
→ Multiplying price changes by volume weight
→ Result: High-volume moves influence the oscillator more than low-volume noise
This helps filter false breakouts and emphasizes moves with participation.
WHY FISHER TRANSFORM?
Fisher Transform is a mathematical transformation that:
→ Normalizes probability distributions
→ Creates sharper turning points
→ Amplifies extremes while compressing the middle
→ Makes overbought/oversold levels more distinct
Applied to the Kinetic Pulse, it helps identify genuine extremes vs. noise.
WHY MULTI-OSCILLATOR DIVERGENCE?
Single-source divergence can give false signals. By requiring divergence confirmation across multiple oscillators (Kinetic Pulse, CCI, Stochastic), the system filters out:
→ Divergences caused by calculation quirks in one oscillator
→ Temporary momentum anomalies
→ False divergence on noisy, low-timeframe charts
Multiple sources confirming the same pattern increases reliability.
WHY ADAPTIVE PERIODS?
Fixed periods can be:
→ Too slow during high volatility (miss fast reversals)
→ Too fast during low volatility (generate noise)
The adaptive system:
→ Shortens period when ATR ratio > 1.3 (high volatility = need faster response)
→ Lengthens period when ATR ratio < 0.7 (low volatility = need noise filtering)
→ Keeps period in reasonable range (60% to 140% of base period)
→ Result: Oscillator adjusts to current market pace automatically
WHY HYSTERESIS IN STATE MACHINE?
Without hysteresis, the analysis state would flip-flop on every bar, creating:
→ Confusing, contradictory guidance
→ Analysis paralysis
→ Lack of actionable information
Hysteresis solves this by:
→ Using different thresholds to ENTER vs. EXIT a state
→ Example: Enter "Factors Aligned" at 72+ confidence, but don't exit until <62
→ This creates stable states that persist through minor fluctuations
→ Requires minimum commitment period (3 bars) before state changes
→ Overrides commitment for significant events (near TP/SL)
→ Result: Stable, trustworthy analysis that changes only when truly warranted
WHY CONFIDENCE SMOOTHING?
Raw factor scores fluctuate bar-by-bar based on momentary conditions. Smoothing:
→ Uses 5-period EMA on raw confidence scores
→ Filters out single-bar anomalies
→ Preserves genuine trends in confidence
→ Prevents false state transitions
→ Result: More reliable assessment of actual trade health
WHY INSTRUMENT-SPECIFIC PARAMETERS?
Different instruments have different characteristics:
→ Forex is highly liquid, respects technical levels well, standard ATR works
→ Crypto is extremely volatile, needs wider stops (1.8x) to avoid false stops
→ Indices respect session opens strongly, session weighting is important
→ Commodities fall in between
Auto-detection applies research-based multipliers automatically.
WHY STRUCTURE-BASED STOPS?
ATR-based stops can:
→ Place stop in middle of consolidation (easily hit)
→ Ignore obvious invalidation levels
→ Be too tight during expansion or too wide during contraction
Structure-based stops:
→ Use actual swing highs/lows (where traders actually place stops)
→ Add small ATR buffer to avoid stop hunting
→ Constrain within min/max ATR limits for safety
→ Result: Stops that respect market geometry while managing risk
DISCLAIMER & RISK WARNING
READ THIS CAREFULLY BEFORE USING THIS INDICATOR
This indicator is provided for EDUCATIONAL and INFORMATIONAL purposes only.
❌ NOT FINANCIAL ADVICE
This indicator does NOT constitute financial advice, investment recommendations, or solicitation to buy or sell any financial instrument. All information is for educational purposes only.
❌ NO GUARANTEES
→ Past performance does NOT guarantee future results
→ No indicator can predict future price movements with certainty
→ Signal grades represent confluence, NOT win probability
→ A+ signals can lose, B signals can win - markets are probabilistic
❌ SUBSTANTIAL RISK
Trading financial instruments involves SUBSTANTIAL RISK of loss:
→ You can lose your entire investment
→ Leveraged trading amplifies both gains AND losses
→ Never trade with money you cannot afford to lose
→ Never risk more than 1-2% of your account per trade
❌ YOUR RESPONSIBILITY
→ All trading decisions are YOUR responsibility
→ You must conduct your own analysis before entering trades
→ Consult a licensed financial advisor before trading
→ Understand the risks specific to your jurisdiction and situation
→ Only trade with capital you can afford to lose completely
❌ NO HOLY GRAIL
→ This indicator is a TOOL, not a complete trading system
→ It should be used as part of a broader analysis framework
→ Combine with your own technical analysis, risk management, and judgment
→ No indicator works 100% of the time in all market conditions
❌ ANALYSIS PANEL DISCLAIMER
The "Trade Analysis Panel" provides ALGORITHMIC ANALYSIS of market factors.
→ It does NOT provide investment advice or recommendations
→ Factor scores are mathematical calculations, not predictions
→ Guidance messages are informational, not directives
→ All trading decisions remain your responsibility
❌ BACKTESTING LIMITATIONS
→ This is an indicator, not a strategy, so no backtesting results are provided
→ Any backtesting you perform includes hindsight bias and optimization bias
→ Historical performance does not indicate future performance
→ Slippage, commissions, and real-world execution differ from backtests
❌ MARKET CONDITIONS
→ This indicator performs differently in trending vs. ranging markets
→ Extreme volatility can produce false signals or whipsaws
→ Low liquidity periods increase execution risk
→ Major news events can invalidate technical analysis
BY USING THIS INDICATOR, YOU ACKNOWLEDGE:
→ You have read and understood this disclaimer
→ You accept full responsibility for your trading decisions
→ You understand the substantial risks involved in trading
→ You will not hold the author liable for any losses incurred
→ You are using this tool as part of your own due diligence process
KEY FEATURES SUMMARY
✅ Volume-Weighted Kinetic Pulse Engine (proprietary momentum calculation)
✅ 15-Factor Confluence Scoring System (graded signals: A+, A, B)
✅ Multi-Oscillator Divergence Detection (Pulse + CCI + Stochastic)
✅ Higher Timeframe Trend Alignment Filter
✅ Adaptive Period Adjustment (volatility-responsive)
✅ Instrument-Aware Calibration (Forex, Crypto, Indices, Commodities)
✅ Structure-Based Stop Loss Calculation (respects swing highs/lows)
✅ Automated Trade Tracking (entry, stop, TP1, TP2, P/L)
✅ Real-Time Factor Analysis State Machine (5-state system with hysteresis)
✅ Session Awareness (Asian, London, New York, Overlap)
✅ Volatility Regime Detection (blocks signals in extreme conditions)
✅ Choppiness Filter (reduces signals in ranging markets)
✅ Volume Confirmation (relative volume and delta analysis)
✅ Clean Air Check (validates clear path to targets)
✅ Comprehensive Dashboards (market conditions + trade analysis)
✅ Customizable Display (3 signal styles, color themes, positioning)
✅ 9 Built-In Alert Conditions (signals, TP/SL hits, state changes)
✅ Fully Non-Repainting (barstate.isconfirmed, lookahead_off)
✅ Previous Day Levels (PDH/PDL reference lines)
✅ Mobile-Friendly Compact Mode (for smaller screens)
TECHNICAL SPECIFICATIONS
→ Pine Script Version: v6
→ Indicator Type: Overlay (displays on price chart)
→ License: Mozilla Public License 2.0
→ Copyright: BULLBYTE
→ Object Limits: 300 labels, 100 lines, 50 boxes
→ Memory Management: Automatic cleanup system (FIFO queue)
→ Repainting: Non-repainting (signals confirmed on bar close)
→ Timeframe Support: All timeframes (1s to Monthly)
→ Instrument Support: Forex, Crypto, Indices, Commodities, Stocks
→ HTF Data Handling: lookahead_off with historical offset
VERSION HISTORY
v1.0 - Initial Release
→ Kinetic Pulse engine with volume weighting and Fisher Transform
→ 15-factor confluence scoring system
→ Trade analysis state machine with hysteresis
→ Automated trade tracking and monitoring
→ Dual dashboard system (market conditions + factor analysis)
→ 9 alert conditions
→ 3 signal display styles
→ Instrument-aware calibration
→ Full risk management framework
WHO IS THIS INDICATOR FOR?
IDEAL FOR:
✓ Scalpers and day traders seeking high-confluence reversal entries
✓ Swing traders who want quality over quantity
✓ Traders who appreciate systematic, rules-based analysis
✓ Multi-timeframe traders who value HTF confirmation
✓ Forex traders who respect session timing
✓ Crypto traders needing volatility-adjusted parameters
✓ Traders who want complete trade management (entry, stop, targets)
✓ Analytical traders who want transparency in signal generation
NOT IDEAL FOR:
✗ Traders seeking a "set and forget" holy grail system
✗ Traders who don't want to learn the methodology
✗ Traders unwilling to accept losing trades as part of the process
✗ Traders who need constant signals (this is a quality-focused system)
✗ Traders who ignore risk management
FINAL THOUGHTS
The Kinetic Scalper is the result of extensive research into momentum behavior, volume confirmation, and multi-factor confluence analysis. It's designed to identify high-probability reversal setups while maintaining strict risk management and providing complete transparency.
This is NOT a magic solution. It's a sophisticated TOOL that requires:
→ Understanding of the methodology
→ Proper risk management discipline
→ Patience to wait for quality setups
→ Willingness to accept losses as part of trading
→ Integration with your own analysis and judgment
Used properly as part of a complete trading plan, the Kinetic Scalper can help you identify high-confluence opportunities and manage trades systematically.
Remember: Quality over quantity. Discipline over emotion. Risk management over everything.
Trade smart. Trade safe.
© 2025 BULLBYTE | Kinetic Scalper v1.0 | For Educational Purposes Only

RMI Valid FVG & IFVGRMI • Valid FVG & iFVG (Smart Money Concept)
RMI • Valid FVG & iFVG is a precision-focused Fair Value Gap indicator designed for traders who follow Smart Money Concepts (SMC) / ICT logic and want to filter out low-quality, random gaps.
This indicator does not plot every FVG.
It highlights only structurally relevant FVGs that form in the direction of the trend and have a high probability of being filled.
Core Features
Bullish & Bearish Fair Value Gaps
Inverse Fair Value Gaps (iFVG)
Trend-aligned FVG filtering
Automatic invalidation after mitigation
Clean background zones for clear visibility
Optimized for intraday trading
Adjustable settings for scalping, intraday & swing trading
Smart Filtering Logic
FVGs are validated using market structure context
Only FVGs that form within the active trend are displayed
Weak or low-probability gaps are ignored
Inverse FVGs appear after strong displacement and rejection
Zones are visually faded once mitigated
This helps reduce chart noise and keeps the focus on high-probability reaction zones.
Best Use Cases
Entry refinement after BOS / CHoCH
Confluence with liquidity grabs
Premium / discount zone trading
Intraday & session-based trading
Works well with ICT, SMC, price action & structure-based strategies
Recommended Timeframes
Scalping: M1 – M5
Intraday (default): M5 – M15
Swing Trading: M15 – H1
(Default settings are optimized for intraday trading.)
Important Notes
This is not a signal indicator
No repainting
No buy/sell arrows
Designed as a decision-support tool, not an automated system
Always combine with proper risk management and confirmation.
RMI • Precision over noise.
Trade structure, not randomness.

Universe Structure & Trend Zone [All-in-One]**Overview**
The "Universe Structure & Trend Zone" is a comprehensive all-in-one trading toolkit designed to combine Institutional Trend Following with Smart Money Concepts (SMC/ICT). It helps traders identify the dominant trend direction while providing precise entry points based on Market Structure Breaks (MSB) and Order Blocks.
This script aims to filter out market noise by allowing trades only when Price Action aligns with the long-term trend (SMA Zone).
**Key Features**
1. **Market Structure Breaks (MSB) & ZigZag:**
- Detects structural shifts in price (Bullish/Bearish MSB).
- Uses a default Signal Length of 10 to filter out minor swings and focus on significant structural changes.
- Visualizes high and low pivot points.
2. **Smart Trend Zone (SMA 200 Filter):**
- Incorporates a 200-period SMA Zone (Institutional Level) to determine the macro trend.
- **Trend Filter Logic:** The indicator intelligently filters signals. It displays Bullish Order Blocks only when the price is trending *above* the SMA Zone, and Bearish Order Blocks only *below* it. This drastically reduces false signals in choppy markets.
3. **Order Blocks (OB) & Breaker Blocks (BB):**
- Automatically identifies high-probability Order Blocks and Breaker Blocks.
- Includes optional filters for Volume and Premium/Discount zones to validate the blocks.
- Features an auto-cleanup mechanism to remove invalid or broken boxes, keeping the chart clean.
4. **Hull Moving Average (HMA):**
- A fast-reacting 55-period HMA is included to visualize short-term momentum shifts (Green for Bullish, Red for Bearish).
5. **Smart Range (Support/Resistance):**
- Plots the dynamic Highest High and Lowest Low of the selected timeframe (default 4H) to show the current trading range and Equilibrium (EQ) level.
**How to Use**
* **Step 1:** Check the **SMA Zone** (Gray/Green/Red Band). If Price > Zone, look for Longs. If Price < Zone, look for Shorts.
* **Step 2:** Wait for a **Market Structure Break (MSB)** label in the direction of the trend.
* **Step 3:** Look for an entry at the retest of an **Order Block (OB)** or **Breaker Block (BB)**.
* **Step 4:** Use the HMA color change as a confirmation trigger or trailing stop guide.
**Settings**
* **Signal Length:** Default is 10 (Optimized for standard swings).
* **Trend Filter:** Enabled by default (Recommended to stay with the trend).
* **Display:** You can toggle MSB lines, Boxes, and Labels on/off to suit your visual preference.
**Disclaimer**
This indicator is for educational purposes only and does not constitute financial advice. Always use proper risk management.

NVentures Liquidity Radar Pro**NVentures Institutional Liquidity Radar Pro (NV-ILR Pro)** is a comprehensive liquidity analysis tool engineered for traders who understand that price moves from liquidity to liquidity. This indicator reveals where stop orders cluster, where institutional players left their footprints, and where the next liquidity grab is likely to occur.
Unlike conventional support/resistance indicators, ILR Pro combines multiple institutional concepts into a unified confluence scoring system — helping you identify high-probability zones where significant price reactions are most likely.
⯌ **Multi-Layer Liquidity Detection**
> The core engine identifies swing-based liquidity pools where retail stop-losses typically cluster. Each zone is dynamically sized using ATR, ensuring relevance across all timeframes and instruments. Zones automatically fade over time through a freshness decay system, keeping your chart focused on what matters now.
⯌ **Institutional Order Block Detection**
> Order Blocks mark the last opposing candle before a strong institutional move — the footprint of smart money entering positions. ILR Pro automatically detects both bullish and bearish Order Blocks using volume confirmation and consecutive candle validation. When price returns to these zones, institutions often defend their positions.
⯌ **Fair Value Gap Integration (Optional)**
> FVGs represent price imbalances where aggressive orders created inefficiencies. These gaps often act as magnets for price or provide optimal entry zones for mean-reversion strategies. FVG detection is disabled by default for a cleaner chart experience — enable it in settings when you want the full picture.
⯌ **Smart Confluence Scoring**
> Each liquidity zone receives a confluence score based on multiple factors:
- Overlapping swing levels (+1 per overlap)
- Nearby Order Blocks (+1)
- Higher Timeframe alignment (+2 bonus)
Zones with scores of 4+ are highlighted as high-confluence areas where institutional activity is most concentrated.
⯌ **Higher Timeframe Confluence**
> A liquidity zone on your current timeframe gains significant weight when it aligns with HTF structure. ILR Pro automatically checks for HTF swing alignment and awards bonus confluence points — no manual multi-timeframe analysis required.
⯌ **Liquidity Sweep Detection**
> Not every break of a level is a true breakout. ILR Pro identifies sweep patterns where price penetrates a liquidity zone but closes back inside, indicating that liquidity was grabbed without genuine continuation. Swept zones are visually marked, helping you avoid false breakout traps.
⯌ **Mitigation & Test Tracking**
> The indicator tracks how many times price has tested each zone and automatically marks Order Blocks as mitigated once price fully trades through them. This helps you focus on fresh, untested levels with higher reaction probability.
⯌ **Volume-Weighted Significance**
> Zones formed on high relative volume carry more weight. The volume scoring system identifies where significant participation occurred, filtering out noise from low-volume price action.
**PRACTICAL APPLICATION**
**For Breakout Traders**
> Identify where liquidity pools cluster above/below current price. When price sweeps these zones and reverses, you have confirmation of a liquidity grab — often the precursor to the real move in the opposite direction.
**For Mean-Reversion Traders**
> Enable FVG detection and look for price returning to unfilled gaps within high-confluence liquidity zones. The combination of gap-fill tendency and institutional defense creates high-probability reversal setups.
**For Trend Traders**
> Use Order Blocks as pullback entry zones within established trends. When price retraces to a bullish OB in an uptrend (or bearish OB in a downtrend), institutions often step in to defend their positions.
**For Multi-Timeframe Analysts**
> The HTF confluence system does the work for you. Zones marked with "HTF" in the label align with higher timeframe structure — these are your highest conviction levels.
**CONFIGURATION GUIDE**
**Essential Settings**
- Swing Detection Length: 5-8 for intraday, 8-15 for swing trading
- HTF Timeframe: One or two timeframes above your trading TF (e.g., D for H4 charts)
- Min Confluence to Display: 2 for comprehensive view, 3-4 for only high-probability zones
**Visual Clarity**
- FVGs are disabled by default — enable under "Fair Value Gaps" section when needed
- Zone transparency adjustable from 50-95%
- Label size options: tiny, small, normal
**Performance Optimization**
- Reduce Max Zones/OBs/FVGs for faster loading on lower-end systems
- Decrease Lookback Period for intraday scalping
**WHAT MAKES THIS DIFFERENT**
Most liquidity indicators simply draw lines at swing highs and lows. ILR Pro goes further:
→ **Confluence over quantity** — Not all levels are equal. The scoring system highlights where multiple institutional concepts align.
→ **Dynamic relevance** — Freshness decay ensures old, tested levels fade while fresh zones remain prominent.
→ **Sweep intelligence** — Distinguishes between genuine breakouts and liquidity grabs through wick analysis.
→ **Institutional integration** — Combines retail liquidity pools with smart money concepts (OBs, FVGs) in one unified tool.
→ **HTF awareness** — Automatic higher timeframe validation without switching charts.
**STATISTICS PANEL**
The built-in statistics table displays:
- Active resistance/support zones
- High confluence zone count
- Swept zone count
- Active Order Blocks
- Active FVGs (when enabled)
- Current ATR value
- Selected HTF
**ALERTS INCLUDED**
- Price approaching high confluence zone
- Liquidity sweep detected
- Bullish/Bearish Order Block formed
- Bullish/Bearish FVG detected (when enabled)
**NOTES**
This indicator works on all markets and timeframes. For optimal results on Forex, consider using Daily as your HTF for H1-H4 trading. For indices and crypto, Weekly HTF often provides stronger confluence.
The indicator uses User-Defined Types (UDTs) for clean data management and respects Pine Script's drawing limits (500 boxes/labels/lines).
**DISCLAIMER**
This indicator is for educational and informational purposes only. It does not constitute financial advice. All trading decisions are solely your responsibility. Past performance of any trading system or methodology is not indicative of future results.

Warpath Structure + Liquidity Tool (Updated - V3)Warpath visually organizes the key elements required to trade Gold professionally:
1. Market Structure Clarity
Automatically labels HH / HL / LH / LL on major pivot points (current chart timeframe). Makes directional bias immediately obvious. Helps prevent counter-trend trading in strong expansions.
2. Liquidity Sweep Detection (Wick-Only)
Highlights true liquidity sweeps using wick behavior (no breakout guessing). Marks the sweep wick with user-defined colors. Draws a swept-zone box that extends forward to show where liquidity was taken. Designed to identify fuel vs reversal behavior in trends.
3. Key Session Levels
Automatically plots:
Asian High / Low
Previous Day High / Low
Equal Highs / Equal Lows from current timeframe and higher timeframes (1H / 4H / Daily)
These levels represent where price is likely to react, not where trades should be forced.
4. Multi-Confluence HTF Bias Dashboard
Small dashboard showing bias for 15M, 1H, 4H, and Daily timeframes. Each timeframe bias is calculated using four confluence factors:
EMA Stack: 8/21/50 alignment and price position relative to EMAs
Structure: Recent HH/HL vs LH/LL pivot behavior
Price Patterns: Engulfing candles, hammers, double bottoms/tops, break of structure
Momentum: Recent candle direction and close trend
Displays a confluence score (e.g., "BULLS (4)") so you can see signal strength, not just direction. Overall bias weights higher timeframes more heavily for smarter alignment.
5. Trade Positioning Dashboard
Replaces basic overbought/oversold readings with actionable positioning context:
Range Position: Shows exactly where price sits within the selected range (Previous Session, Previous Day, or Weekly) as a percentage. Zones include Deep Discount (0-25%), Discount (25-40%), Equilibrium (40-60%), Premium (60-75%), and Deep Premium (75-100%).
VWAP Deviation: Displays distance from VWAP in standard deviations (σ). Readings beyond ±1.5σ indicate meaningful extension. Readings beyond ±2σ suggest caution on continuation and potential mean reversion.
Trade Favor: Combines HTF bias alignment, range position, and VWAP deviation into a single directional score. Displays as "LONGS ●●●○" or "SHORTS ●●○○" so you know at a glance whether conditions favor continuation or reversal.
6. Continuation Reload Awareness (Strong Trend Environments)
Built to handle markets that:
Remain overbought
Stay in premium
Sweep buy-side liquidity repeatedly
The multi-confluence scoring system catches trend continuation setups (like higher lows forming with bullish momentum) even before swing structure fully confirms. Supports compression → expansion continuation behavior. Prevents missed participation during multi-day trends without abandoning discipline.

Lot Size Panel Lite Multi (@JP7FX)Lot Size Panel Lite Multi is a fast, no-nonsense risk and position sizing tool built for active traders who need answers immediately.
This indicator removes all chart clutter and focuses on one thing only. Correct lot size based on your stop loss and risk.
It is designed for scalpers, day traders, and funded account traders who do not want complex menus or slow workflows.
What it does
Calculates precise lot size from stop loss and risk
Supports percentage risk or fixed cash risk
Works across Forex, Gold, Crypto, Index/CFD, and Stocks
Displays results in a clean on-chart panel
Supports multiple accounts at once
Key features
Risk first layout. Stop loss and risk inputs are at the top
Multi account support with A1 enabled by default
Per account currency handling with automatic FX conversion
Manual FX fallback option when TradingView rates are unavailable
Customisable panel colours and layout
Movable panel with multiple screen positions
How to use
Select your Asset Type
Enter your Stop Loss in pips
Choose Risk mode
Percent uses account balance
Cash risks a fixed amount
Set your account balance and currency
Read the calculated lot size instantly
Index and CFD users
For Index and Stock instruments, set the “value per pip per 1 lot” to match your broker.
Example:
If 1 lot equals $10 per point, enter 10
Who this is for
Traders who execute fast and want zero friction
Prop firm traders managing multiple accounts
Traders who want correct risk every trade without thinking
This is the Lite version of the JP7FX lot sizing tools.
It strips everything back to speed, clarity, and accuracy.
Trade smart.
JP7FX

GHOST SNIPERGHOST SNIPER™ – BB Reversal Engine + Smart Entry / Exit Structure Core
MNQ / MES / Stocks / ETFs / Crypto / FX
BB Reversals · Breakouts · PD Structure · Liquidity Sweeps · Displacement · Smart Targets · Quick SL & TP Logic
________________________________________
Summary
Ghost Sniper™ is a high-precision reversal and breakout engine designed for intraday scalping on MNQ/MES, while remaining highly effective across equities, ETFs, crypto, and FX.
It blends a custom Bollinger Reversal Framework (BB Bottom / BB Top Sniper) with an internal ICT-style structure core to filter noise and isolate only high-quality turning points.
The system reads stretch and failure conditions, detects band breakouts, and identifies Bollinger Band failures to anticipate sharp reversals. It includes a Quick TP (QTP) and Quick SL (SL-Q) module for micro-scalps, along with full ICT-style structural targets (TP1, TP2, TP3) for extended runs.
All TP levels and SL placement are derived from smart structural logic, designed to reduce premature stop-outs and improve fill reliability during volatility.
Real-time intrabar logic ensures entries trigger the moment structure confirms — no repainting.
________________________________________
BUY / SELL Signal Activation & Checklist HUD
Ghost Sniper™ uses a rule-based BUY / SELL triggering system driven by real-time structural confirmation — not delayed indicators or hindsight logic.
Entries only activate when a multi-condition internal checklist aligns, combining:
• Bollinger stretch, failure, or breakout behavior
• Liquidity sweep or rejection context
• Micro structure confirmation (BOS / displacement)
• Premium / Discount positioning
• Momentum and reversal candle confirmation
A built-in Checklist Activation HUD visually displays when conditions are forming, aligning, or fully confirmed, allowing traders to see why a signal is valid — not just that it fired.
BUY / SELL signals trigger only when checklist confirmation is reached, filtering low-probability setups and maintaining clean, high-quality entries.
All logic operates intrabar and in real time, with no repainting.
________________________________________
Market Structure & Context Awareness
Ghost Sniper™ incorporates a streamlined ICT-inspired framework, including:
• Liquidity sweep awareness (stop-runs and grabs)
• Micro BOS confirmation
• Premium / Discount context
• Impulse and displacement reads
• Reversal candle assist
• Optional PD / HTF alignment gates
To support institutional-grade context without visual clutter, Ghost Sniper™ also includes a comprehensive set of fully optional, user-selectable tools, allowing traders to tailor the chart to their workflow:
• VWAP
• Up to 5 configurable moving averages
• Bollinger Bands
• Automatic liquidity sweep level detection
• Opening Range Breakout (ORB)
• Midnight Open
• 9:30 AM New York Open
• Previous Day High / Low (PDH / PDL)
• Previous Week High / Low (PWH / PWL)
• Current Week High / Low (CWH / CWL)
• Monthly High / Low
• Previous Month High / Low (PMH / PML)
• Global session tracking, including:
o Asia Session
o London Session
o New York Session
All levels and context tools are individually selectable, designed to provide structure and bias awareness while keeping charts clean and focused.
________________________________________
Execution & Risk Logic
Ghost Sniper™ automatically prints clean, minimal BUY / SELL signals, intelligent stop placement, and progressive target logic:
QTP → TP1 → TP2 → TP3
A built-in Break-Even engine, structural invalidation logic, and one-trade-at-a-time control help maintain disciplined execution and consistent risk management.
Designed for traders who want a fast, decisive, and high-probability entry engine without visual noise or unnecessary complexity.
________________________________________
Disclaimer
This tool is for educational and research purposes only and is not financial advice.
Always test thoroughly in replay or paper trading before using in live markets.

The Physics Engine [@Ash_TheTrader]🏛️ Welcome to the Physics of Finance
By @Ash_TheTrader
Traditional technical analysis often relies on "lagging" indicators. Tools like the RSI or moving averages tell you where price has been. While useful, they are like driving a car looking only in the rearview mirror.
The Kinematic Impulse Engine (KIE) is different. It is designed to be a leading indicator of momentum shifts.
It doesn't just look at price; it treats price action like a physical object moving through space to measure its Velocity (Speed), Acceleration (G-Force), and Mass (Volume). By understanding the physics behind a move, we can determine if a trend is a powerful impulse or an exhausted drift waiting to reverse.
⚛️ The Core Concept: Trading with G-Force
If you step on the gas pedal in a car, you feel pushed back into your seat. That is acceleration (positive G-Force). When you slam on the brakes, you are thrown forward. That is deceleration (negative G-Force).
The market works the same way.
Standard momentum indicators only measure speed. The KIE measures how fast that speed is changing.
The Problem with Standard Indicators: Price can be moving higher (high speed), but the rate at which it is moving higher is slowing down (deceleration). A standard indicator will still look bullish right up until the reversal happens.
The KIE Solution: The KIE detects that deceleration instantly, warning you that the "G-Force" pushing the price up has vanished, often before the price peaks.
🎨 Visual Decoder: Reading the Heatmap
We have eliminated the need to stare at complex oscillator lines below your chart. The KIE paints the candles directly based on their "Kinetic Energy."
1. Neon Cyan : The Impulse (High G-Force) 🚀
Physics State: High Velocity + Positive Acceleration.
Meaning: The market has "pedal to the metal." Buyers are aggressive, and the move is speeding up. This is where you want to be in a trade.
Signal: Look for the small triangles (🚀) marking the start of these impulse moves out of the noise.
2. Deep Purple : Exhaustion (Braking) 🛑
Physics State: High Velocity + Negative Acceleration (Deceleration).
Meaning: The car is still moving forward fast, but the driver has taken their foot off the gas or hit the brakes.
Signal: This is a massive warning sign. If you are long and candles turn purple, the trend is running on fumes. Expect consolidation or a reversal soon.
3. Dark Gray : Equilibrium (Chop) 💤
Physics State: Low Velocity.
Meaning: No significant energy present. The market is chopping sideways.
Signal: Stay out of the market or use range-bound strategies.
⚠️ Unique Feature: Gravity Divergence Detection
This is the most powerful feature of the Kinematic Impulse Engine. It detects when price action is defying the laws of physics.
Imagine throwing a ball into the air. As it reaches the very peak of its arc, it is still moving upward, but gravity is decelerating it rapidly just before it falls back down.
The KIE detects this exact moment in the market:
Gravity Sell Signal: Price makes a new high, but Acceleration (G-Force) crashes rapidly. The market is fighting gravity and will likely snap back.
If you see a "GRAVITY" label pop up on a Deep Purple candle at a high, take notice.
🧠 The Engine Room (Under the Hood)
For the technical traders, here is how @Ash_TheTrader designed the engine:
Relative Velocity: Price changes are normalized against Average True Range (ATR) volatility. A $10 move in Bitcoin is not the same as a $10 move in a penny stock; the KIE adjusts for this automatically.
Mass Integration (Volume Weighting): In physics, Force = Mass x Acceleration. The KIE optionally uses relative Volume as "Mass." A move backed by high volume has more "weight" and is harder to stop than a low-volume move.
The HUD: The on-screen dashboard gives you real-time readings of the current Velocity and raw G-Force metrics, along with an instant trend status summary.
🛡️ How to Use This in Your Trading
The Breakout Trader: Wait for gray candles (chop). Enter when the first Neon Cyan candle appears, ideally accompanied by an Impulse Triangle (🚀). Ride the cyan until it turns purple.
The Reversal Trader: Wait for an extended run of cyan candles. When the candles turn Deep Purple and you see a "GRAVITY" warning label, look for shorting opportunities as the momentum is exhausted.
Trade smart. Trade with physics.
Developed by @Ash_TheTrader

AI Adaptive Supertrend ChannelAI Supertrend Channel – The Adaptive Trend System
Beyond Basic Supertrend: An Intelligent Trading Framework
The AI Adaptive Supertrend Channel transcends traditional trend following indicators by delivering a self-optimizing trading system. Its core innovation is a triple-adaptive engine that automatically adjusts channel width based on real-time market conditions:
Market Efficiency Detection – Widens during clean trends, tightens in choppy ranges
Normalized Volatility – Scales appropriately to any asset's price level
Dynamic Momentum Response – Expands aggressively during powerful directional moves
The Result: A smarter tool that reduces false signals in consolidation while giving trends ample room to run—eliminating the constant parameter tweaking required by static indicators.
Visual Signal Framework & Strategic Applications
Channel Architecture:
Primary Trend Line (Thick Green/Red): Your dynamic trailing stop and core trend indicator. Green signals an uptrend (buying bias), Red signals a downtrend (selling bias).
Upper & Lower Bands: Form a dynamic support/resistance channel around the trend.
Mid-Line: A critical mean reversion level and the trigger for key early signals.
Trading Signals & Strategic Meaning:
Primary Signal: Momentum Diamonds (High Conviction)
💎 Green Diamond (Higher High): Price closes above the Upper Band after making a new high. Signals strong bullish momentum continuation. Ideal for adding to long positions or entering new longs in an established uptrend.
💎 Red Diamond (Lower Low): Price closes below the Lower Band after making a new low. Signals strong bearish momentum continuation. Ideal for adding to short positions or entering new shorts in a downtrend.
Secondary Signal: Mid-Line Crosses (Early Action)
🔼 Green Triangle (Bullish Mid-Line Cross - bullMidCross): Price crosses above the Mid-Line. This is an early bullish pullback signal within a larger uptrend or a potential early reversal sign in a downtrend. Use for early entries or to confirm the end of a bearish pullback.
🔽 Red Triangle (Bearish Mid-Line Cross - bearMidCross): Price crosses below the Mid-Line. This is an early bearish pullback signal within a larger downtrend or a potential early warning of weakness in an uptrend. Use for early short entries or to take profits on longs.
Practical Trading Strategies
Trend Following: Align trades with the Primary Trend Line color. Use the line itself as a dynamic stop-loss. The Momentum Diamonds confirm the trend's strength.
Pullback Trading: Use the Mid-Line Cross triangles (bullMidCross/bearMidCross) to identify high-probability entries during trend retracements. The channel bands provide natural profit targets.
Breakout Confirmation: A Momentum Diamond following a period of consolidation often confirms a genuine breakout, offering a signal to enter with the new momentum.
Optimal Settings Guide
Default (Universal)
For most markets, timeframes
ATR: 13 | ER: 144 | Channel Width: 0.7
Volatility Factor: 100 | Vol MA: HMA | Trend MA: EMA
Day Trading (Fast, Responsive)
*15M-1H charts, scalping*
ATR: 8 | ER: 89 | Channel Width: 0.6
Volatility Factor: 120 | Vol MA: EMA | Trend MA: WMA
*Swing Trading (Smooth, Conservative)*
*Daily-Weekly, position trading*
ATR: 21 | ER: 200 | Channel Width: 0.9
Volatility Factor: 80 | Vol MA: HMA | Trend MA: LINREG
Channel Width × Factor
0.5-0.7 → Tighter (more signals, less room)
0.8-1.2 → Wider (fewer signals, more room to run)
Volatility Regime Factor
50-80 → Less sensitive to volatility (stable markets)
100-150 → More sensitive (volatile markets like crypto)
Base ATR Length
8-13 → Faster signals (lower timeframes)
17-21 → Smoother signals (higher timeframes)
Quick Adjustments:
Whipsaws → Increase Channel Width × Factor
Lagging → Decrease ATR Length
Volatile markets → Increase Volatility Regime Factor
Start with Default, adjust one parameter at a time based on your market and trading style.

KIMATIX FVG/IFVG/BPRProfessional Fair Value Gap & Imbalance Toolkit
The KIMATIX FVG/IFVG/BPR indicator is a precision tool designed to identify institutional inefficiencies in price:
Fair Value Gaps (FVG), Inverse Fair Value Gaps (IFVG) and Balanced Price Ranges (BPR) — clean, minimal and non-repainting.
This indicator is built for scalpers, intraday traders and smart-money traders who want to trade where price is most likely to react, not where indicators lag.
What this indicator shows
Fair Value Gaps (FVG)
Detects bullish and bearish FVGs using strict 3-candle imbalance logic
Highlights areas where price moved too fast, leaving inefficient structure
Ideal for:
Continuation trades
Pullback entries
Reaction zones after impulse moves
Color-coded
🟢 Bullish FVG
🔴 Bearish FVG
Inverse Fair Value Gaps (IFVG)
Automatically detects when an FVG is invalidated
Marks the same zone as an Inverse FVG
Extremely useful for:
Failed structure setups
Reversal trades
Stop-hunt & liquidity traps
Color-coded
🟡 IFVG (invalidation zone)
Balanced Price Range (BPR)
Detects overlapping bullish & bearish FVGs
Highlights price areas where buying and selling pressure are balanced
These zones often act as:
High-probability reaction areas
Compression zones before expansion
Premium intraday decision levels
Color-coded
🔵 BPR (balanced price range)
Smart, Clean & Non-Repainting
Non-repainting
Only the last 3 active zones are shown → no clutter
Boxes extend forward with a manual cap (user-controlled)
Designed for 1m – 15m execution, works on all markets
Futures, Crypto, FX, Indices, Stocks
How professionals use it
Combine FVGs with:
VWAP
Session highs/lows
Volume Profile (POC / VAH / VAL)
Market structure (BOS / displacement)
Use IFVGs to spot failed smart-money narratives
Use BPRs as decision zones, not blind entries
This indicator does not give buy/sell signals.
It shows you where trades make sense — execution is up to you.
Best use cases
Scalping (1m–3m)
Intraday trading (5m–15m)
Smart-money concepts
Liquidity-based trading
News reactions & stop runs
Learn how to trade it properly
This indicator is part of the KIMATIX Trading Framework.
More education, live examples & full system:
kimatixtrading.com

Institutional Dominance/Trapped Trader Profile @MaxMaserati 3.0📊 Institutional Dominance & Trapped Trader Delta Profile
@MaxMaserati 3.0
═════════════════════════════════════════════════════════════
🎯 OVERVIEW
The IDT Auction Profile is a professional-grade volume order flow analysis tool that reveals where institutional traders hold Positional Advantage and where retail participants are Trapped. Unlike traditional Volume Profile indicators, the IDT Profile integrates Volume Point Delta (VPD) analysis with advanced pattern recognition to identify the exact price levels where profitable institutional positions create support/resistance, and where losing positions are forced to exit.
This indicator answers the critical questions: Who is in profit? Who is trapped? And where will they defend or exit their positions?
═════════════════════════════════════════════════════════════
✨ FEATURES
═════════════════════════════════════════════════════════════
⚡ Quick Presets - One-click configuration for:
• Scalper (1m-5m): 75 bars, 50 rows, ★3 confluence
• Day Trader (15m-1h): 150 bars, 60 rows, ★3 confluence
• Swing Trader (4h-D): 300 bars, 80 rows, ★4 confluence
🔔 Price Alerts - Get notified when price touches:
• VAH (Value Area High) - Resistance zone
• VAL (Value Area Low) - Support zone
• Adjustable sensitivity (0.05% - 1.0%)
📏 POC Line Extensions - Historical context lines extending left from key institutional levels
👻 Previous Session POCs - Dotted reference lines showing prior period levels (carry-over zones)
📊 Real-Time Statistics Panel:
• Total Volume
• Net Delta
• Buy/Sell Pressure %
🎨 Visual Enhancements:
• Column dividers for clarity
• Transparency controls
• Profile auto-hide when price moves away
• Cached color schemes for 30% performance boost
═════════════════════════════════════════════════════════════
🧠 CORE CONCEPT: DOMINANCE VS TRAPPED POSITIONING
═════════════════════════════════════════════════════════════
The indicator categorizes all market participants into two strategic positions based on their entry price relative to current market price:
📍 ABOVE CURRENT PRICE (Resistance Zones)
🔴 Aggressive Sellers in Profit - Sold higher, currently winning. Will defend positions or add to winners.
🟥 Trapped Buyers at Loss - Bought higher, currently losing. Must exit at breakeven, creating resistance.
📍 BELOW CURRENT PRICE (Support Zones)
🟢 Aggressive Buyers in Profit - Bought lower, currently winning. Will defend positions or add to winners.
🟩 Trapped Sellers at Loss - Sold lower, currently losing. Must cover at breakeven, creating support.
⚡ MAXIMUM CONFLUENCE ZONES
When Dominant (Profitable) and Trapped (Loss) positions align at the same level, you get the strongest support/resistance zones:
🟧 Orange Boxes (Above Price) = Aggressive Sellers + Trapped Buyers = STRONGEST RESISTANCE
🟨 Yellow Boxes (Below Price) = Aggressive Buyers + Trapped Sellers = STRONGEST SUPPORT
═════════════════════════════════════════════════════════════
📊 VOLUME ANALYSIS COLUMNS
═════════════════════════════════════════════════════════════
1️⃣ VPD Column (Volume Point Delta)
Net aggressive pressure at each price level (Buying Volume - Selling Volume)
- Bullish Delta (Green): Buyers dominated the auction at this level
- Bearish Delta (Red): Sellers dominated the auction at this level
- Smart Coloring: Automatically highlights institutional patterns
2️⃣ VPS Column (Volume Point of Sell - ASK Volume)
Aggressive buying volume that "lifted the offer" by hitting ask prices
- Represents participants who paid the ask price to enter long
- When price is below this level = These buyers are in profit
- When price is above this level = These sellers who got hit are in profit
- Shows institutional bid volume absorption
3️⃣ VPB Column (Volume Point of Buy - BID Volume)
Aggressive selling volume that "hit the bid" by taking bid prices
- Represents participants who sold at bid price to enter short
- When price is above this level = These sellers are in profit
- When price is below this level = These buyers who got hit are in profit
- Shows institutional ask volume absorption
4️⃣ SVP Column (Optional - Session Volume Profile)
Traditional combined volume profile without bid/ask separation
═════════════════════════════════════════════════════════════
🔍 ADVANCED INSTITUTIONAL PATTERNS DETECTION
═════════════════════════════════════════════════════════════
The indicator uses statistical analysis (standard deviation, moving averages, hit counting) to identify institutional footprints:
⚡ Failed Auctions - "BUYERS TRAPPED" or "SELLERS TRAPPED" labels
• High volume entered, but price immediately reversed
• Creates extreme concentrations of losing positions
• Trading Implication: High-probability reversal zones where trapped participants must exit
📈 Volume Spikes - Bright green/red bars in VPD column
• Volume exceeds average by 2+ standard deviations
• Represents aggressive institutional entry
• Trading Implication: Potential trend continuation or setup for failed auction
🛡️ Absorption Zones - Yellow/Orange colored bars
• Large passive orders absorbing aggressive volume without price movement
• Indicates accumulation (bullish) or distribution (bearish)
• Trading Implication: Institutional positioning before major moves
🧊 Iceberg Orders - Cyan colored bars with high hit counts
• Same price level shows repeated volume without clearing
• Reveals hidden institutional limit orders split into small pieces
• Trading Implication: Strong liquidity magnets, price often returns here
💜 Volume Exhaustion - Purple colored bars
• Sharp volume drop (50%+) after spike
• Momentum exhausted, participants depleted
• Trading Implication: Potential reversal or consolidation ahead
═════════════════════════════════════════════════════════════
🎨 SMART INSTITUTIONAL COLORING
═════════════════════════════════════════════════════════════
Colors bars based on detected patterns vs simple red/green:
🟨 Yellow = Bullish battles won (buyers + trapped sellers)
🟧 Orange = Bearish battles won (sellers + trapped buyers)
🔵 Cyan = Iceberg orders (hidden liquidity)
🟣 Purple = Large passive orders
🟢 Bright Green = Buying spikes (institutional aggression)
🔴 Bright Red = Selling spikes (institutional aggression)
═════════════════════════════════════════════════════════════
⭐ CONFLUENCE SCORING SYSTEM
═════════════════════════════════════════════════════════════
Each price level receives 1-5 stars based on:
★★ Volume spike presence (+2 stars)
★ Absorption pattern (+1 star)
★ Large passive orders (+1 star)
★ Proximity to Value Area (+1 star)
★★ Iceberg detection (+2 stars)
★★ Failed auction (+2 stars)
Minimum Signal Strength filter lets you show only levels with ★3+ confluence for highest-quality signals.
═════════════════════════════════════════════════════════════
🎯 VALUE AREA ANALYSIS
═════════════════════════════════════════════════════════════
VAH (Value Area High) - Blue Line
- Top of the 70% volume acceptance zone
- Price at VAH often rejects downward (resistance)
- Alert triggers when price approaches
VAL (Value Area Low) - Red Line
- Bottom of the 70% volume acceptance zone
- Price at VAL often bounces upward (support)
- Alert triggers when price approaches
Trading Applications:
- Price outside Value Area → Mean reversion opportunity
- Price breaks VA with volume → Trend continuation
- Price oscillates within VA → Range-bound, fade extremes
- Previous session VA lines show carryover levels
═════════════════════════════════════════════════════════════
📋 EXPECTED PRICE BEHAVIOR AT KEY LEVELS
═════════════════════════════════════════════════════════════
⚠️ IMPORTANT: These are observed behavioral patterns for educational purposes and backtesting research. Always validate with 250-500+ backtest trades before risking capital.
1️⃣ POC BOX ZONES (Highest Statistical Relevance)
🟨 Yellow Boxes (Below Current Price - SUPPORT)
Expected Behavior:
- Price approaching from above typically encounters buying pressure
- Both profitable institutional buyers and trapped short sellers create demand
- Common reaction: Price slows, consolidates, or bounces
- Failed bounces often lead to rapid breakdown (trapped buyers capitulate)
What Often Happens:
- Initial dip into zone → Weak bounce attempt
- Second test → Stronger bounce (trapped sellers covering + buyers defending)
- Break below → Quick acceleration as both groups exit
🟧 Orange Boxes (Above Current Price - RESISTANCE)
Expected Behavior:
- Price rallying into zone typically encounters selling pressure
- Both profitable institutional sellers and trapped long buyers create supply
- Common reaction: Price stalls, consolidates, or rejects
What Often Happens:
- Initial push into zone → Weak rejection
- Second test → Stronger rejection (trapped buyers exiting + sellers defending)
- Break above → Quick acceleration as resistance becomes support
2️⃣ FAILED AUCTION ZONES
"SELLERS TRAPPED" Labels (Below Price):
- High-volume selling that immediately reversed = maximum trapped shorts
- When price returns, trapped sellers face pressure to cover
- Typical pattern: Price approaches → Initial hesitation → Sharp bounce
"BUYERS TRAPPED" Labels (Above Price):
- High-volume buying that immediately failed = maximum trapped longs
- Price returning forces trapped buyers to exit at breakeven
- Typical pattern: Price approaches → Distribution → Rejection
3️⃣ VALUE AREA DYNAMICS
Price Outside Value Area (VAH/VAL):
- Price beyond 70% volume zone = statistical outlier
- Two outcomes: Mean reversion OR trend continuation
- Key differentiator: Presence of confluence zones
Mean Reversion Pattern (No Strong Confluence):
- Price extends 1-2% beyond VA → Typically reverts toward POC
- Weak volume on extension → Higher probability of reversal
Breakout Pattern (With ★4+ Confluence):
- Price breaks VA with institutional patterns → Often continues
- Strong volume + confluence = New value area forming
4️⃣ ICEBERG ORDER BEHAVIOR
Cyan Bars with High Hit Counts:
- Repeated volume at same level = Large hidden order absorbing
- Price typically "tests" iceberg multiple times before resolution
- Two outcomes: Absorption complete (break) OR rejection (bounce)
5️⃣ VOLUME SPIKE PATTERNS
Bright Green/Red Bars (Institutional Aggression):
- Extreme delta spikes indicate institutional entry
- Trend Continuation Spikes: Spike aligned with trend = Often continues
- Exhaustion Spikes: Spike against trend = Failed auction forming
═════════════════════════════════════════════════════════════
⚙️ CONFIGURATION GUIDE
═════════════════════════════════════════════════════════════
🎯 QUICK START
1. Select your trading style preset (Scalper/Day/Swing)
2. Enable VAH/VAL alerts in settings
3. Adjust alert sensitivity (0.1% recommended)
4. Add alert condition to TradingView alert system
📊 CORE SETTINGS
- Lookback Period: How many bars to analyze
- Scalping: 50-100 bars
- Day Trading: 100-200 bars
- Swing Trading: 200-500 bars
- Price Row Granularity: How finely to divide price
- 40-50 rows = Fast markets
- 60-80 rows = Balanced (RECOMMENDED)
- 100+ rows = Maximum precision
- Minimum Signal Strength: Filter weak signals
- ★3 = Balanced quality/quantity (RECOMMENDED)
- ★4-5 = Highest quality, fewer opportunities
🎨 VISUAL SETTINGS
- Color Theme: Classic/Institutional/Monochrome/Bold/Minimal/Custom
- Smart Coloring: ON (recommended) - Shows institutional patterns
- Transparency: Adjust profile opacity
- Column Dividers: Visual separators between columns
- POC Extensions: Show historical level significance
📈 ADVANCED FEATURES
- Auto-Hide Distance: Hide profile when price moves X% away
- Statistics Panel: Real-time metrics display
- Previous POCs: Show prior session levels
- Alert Sensitivity: How close price must be to trigger alerts
═════════════════════════════════════════════════════════════
💡 BEST PRACTICES
═════════════════════════════════════════════════════════════
✅ Start with defaults (200 lookback, 60 rows, ★3 confluence, Smart Coloring ON)
✅ Focus on POC boxes first - These are your highest-probability zones
✅ Combine with price action - Use the profile to explain WHY support/resistance exists
✅ Watch for alignment - Yellow/Orange boxes = strongest levels
✅ Respect failed auctions - "TRAPPED" labels are extreme reversal setups
✅ Use Value Area for context - Price outside VA = mean reversion opportunity
✅ Trust confluence scores - ★4-5 signals are institutional-grade setups
✅ Set up alerts for VAH/VAL touches - Don't miss key levels
✅ Check previous session POCs - Institutions defend same zones across sessions
✅ Monitor statistics panel - Understand market conviction in real-time
═════════════════════════════════════════════════════════════
🔧 TECHNICAL SPECIFICATIONS
═════════════════════════════════════════════════════════════
Calculation Method: Enhanced delta using OHLC and volume with wick ratio analysis
Update Frequency: Real-time on every bar close
Performance: Optimized with color caching and pre-calculated values (~30% faster)
Max Capacity: Supports up to 1500 bars lookback and 250 price rows
Compatibility: Works on all symbols and timeframes
Memory Usage: Efficient array management with proper initialization
Alert System: Built-in VAH/VAL touch detection with visual markers
═════════════════════════════════════════════════════════════
🎯 UNIQUE VALUE PROPOSITION
═════════════════════════════════════════════════════════════
Unlike standard Volume Profile indicators that only show where volume occurred, the IDT Auction Profile:
✅ Separates bid vs ask volume to reveal true order flow
✅ Identifies who is profitable vs who is trapped at each level
✅ Detects institutional patterns (icebergs, absorption, failed auctions)
✅ Calculates confluence scores combining multiple factors
✅ Provides clear POC boxes showing exact institutional positioning
✅ Maps positional advantage rather than just volume density
✅ Alerts you to key level touches in real-time
✅ Shows historical context with POC extensions
✅ Displays live statistics for market conviction
This transforms Volume Profile from a historical volume chart into a strategic positioning map showing institutional dominance and trapped participants.
═════════════════════════════════════════════════════════════
📖 HOW TO INTEGRATE WITH YOUR STRATEGY
═════════════════════════════════════════════════════════════
✅ PROPER USES:
- Entry refinement within your existing setups
- Intelligent stop placement beyond institutional levels
- Objective profit targets at next confluence zones
- Trade filtering (only take setups at ★4+ zones)
- Understanding market positioning before entry
- Alert-based monitoring of key support/resistance levels
❌ WHAT IT CANNOT DO:
- Predict direction with certainty
- Replace risk management
- Account for news/external events
- Guarantee profitability
- Work in all market conditions
═════════════════════════════════════════════════════════════
📚 DEVELOPMENT PATH (12-16 Weeks)
═════════════════════════════════════════════════════════════
Weeks 1-2: Observation Only
- Watch price behavior at key levels
- Document patterns without trading
- Set up alerts and observe responses
Weeks 3-8: Paper Trading
- Simulate trades, track all metrics
- Minimum 100 paper trades
- Test different confluence thresholds
Weeks 9-16: Small Size Testing
- Minimal capital, real market conditions
- Continue tracking, refine rules
- Adjust alert sensitivity based on results
After Proven Edge you could potentially include it in your set-up
═════════════════════════════════════════════════════════════
⚠️ CRITICAL DISCLAIMERS
═════════════════════════════════════════════════════════════
⚠️ Past volume ≠ Future price action
⚠️ Institutional positions change rapidly - these are static snapshots
⚠️ No indicator works 100% - risk management is mandatory
⚠️ Market conditions change - adapt your approach
⚠️ Backtest with YOUR style, YOUR timeframe, YOUR risk tolerance
⚠️ Alerts are notifications, not trade signals - you decide the action
The indicator reveals WHERE institutions are positioned and HOW they might behave. YOU decide IF, WHEN, and HOW to trade that information.
═════════════════════════════════════════════════════════════
📞 SUPPORT & UPDATES
═════════════════════════════════════════════════════════════
For questions, suggestions, or bug reports:
- Comment below the indicator
- Follow for updates and new features
- Check documentation for detailed examples
═════════════════════════════════════════════════════════════
Not financial advice. For educational and research purposes only.

(5+15+60min+1D)EMA20+Y'SH/L+count简介: 这是一个专为 5分钟图表 (5min Chart) 日内交易者设计的综合辅助工具。它结合了多周期趋势均线、美股核心交易时段的时间周期计数以及关键流动性位置(前一日高低点)的智能突破监测。该脚本针对美股个股及 24/7 交易的 BTC/ETH 进行了优化,强制锁定纽约时间进行运算。
核心功能:
1. 多周期 EMA 监控系统 (MTF EMAs)
5min EMA20 (蓝色):日内短期趋势核心线(默认开启)。
60min EMA20 (绿色):小时级别趋势参考(默认开启)。
15min EMA20 (红色) & 1D EMA20 (橙色):可选开启,用于捕捉更大周期的支撑阻力。
特点:所有均线采用最细线宽,平滑显示,右上角表格实时展示当前价格。
2. 美股时段 Bar Count 计数器
时间锚定:以纽约时间 (New York Time) 09:30 开盘为起点(Bar 0)。
显示规则:仅在 K 线底部显示 偶数 序号 (0, 2, 4, 6 ...),直至第 82 根 K 线停止。
关键时间窗 (Time Pivots):
Bar 18 (约 NY 10:55) 和 Bar 40 (约 NY 12:45) 会被自动高亮。
字体变为 蓝色粗体,且对应 K 线实体变为蓝色,提示潜在的变盘或宏观流动性注入时刻。
3. 智能 PDH/PDL 射线 (Smart Rays)
精确锚点:前一日高点 (PDH) 和低点 (PDL) 的射线不是从开盘画起,而是从昨日形成高低点的具体时间点射出,精确还原价格行为。
自动阻断 (Breakout Logic):一旦当前价格触碰或突破该射线,射线将自动停止延伸,直观展示“阻力/支撑已失效”。
自动清理:每日自动清除旧线,仅保留当天的参考线,保持图表整洁。
4. 视觉优化
每日分割线:自动绘制灰色虚线分隔交易日。
图表限制:脚本仅在 5分钟图表上可见,切换周期自动隐藏,避免干扰大周期分析。
设置说明:
可在设置面板中自由开关各周期 EMA 的显示。
可开关底部的计数数字显示。
English Version (for TradingView Publishing)
Title: 5min Intraday Precision Toolkit: MTF EMAs + NY Session Count + Smart Rays
Introduction: This is a comprehensive auxiliary tool designed specifically for 5-minute chart intraday traders. It combines multi-timeframe trend EMAs, time cycle counting based on the US Session, and smart breakout monitoring for key liquidity levels (Previous Day High/Low). Optimized for US Equities and Crypto (BTC/ETH) using New York Time.
Key Features:
1. Multi-Timeframe EMA System
5min EMA20 (Blue): Core short-term intraday trend (On by default).
60min EMA20 (Green): Hourly trend reference (On by default).
15min EMA20 (Red) & 1D EMA20 (Orange): Optional overlays for higher timeframe support/resistance.
Visuals: All EMAs are rendered with fine lines for a clean look, accompanied by a top-right dashboard table.
2. NY Session Bar Count
Time Anchor: Starts counting from 09:30 New York Time (Bar 0).
Display Logic: Displays only EVEN numbers (0, 2, 4...) at the bottom of the bars, stopping at count 82.
Time Pivots:
Bar 18 (~10:55 NY) and Bar 40 (~12:45 NY) are highlighted.
Labels turn Bold Blue, and the specific candles are colored Blue to indicate potential reversal or liquidity injection times.
3. Smart PDH/PDL Rays
Precise Origin: Rays for Previous Day High (PDH) and Previous Day Low (PDL) originate from the exact timestamp they were created yesterday, not just the daily open.
Breakout Stop Logic: Rays automatically stop extending once price touches or breaks them, clearly indicating that the level has been tested.
Auto-Clean: Automatically removes old rays from previous days to keep the chart clean.
4. Visual Optimization
Daily Separators: Automatic vertical dotted lines marking new days.
Visibility: All elements are hidden on non-5m charts to prevent clutter.
Settings:
Toggle visibility for individual EMAs.
Toggle visibility for the bottom bar counter.

Raja's SMC Order Blocks Display [PRO]Raja's SMC Order Blocks Display - Complete Description
🌟 A Message from Raja Saien
This indicator has been crafted with dedication, countless hours of research, and deep passion for trading excellence. Raja Saien has poured his heart and soul into creating this powerful tool to help YOU succeed in the markets.
For Everyone Starting Their Trading Journey:
If you're new to trading, remember - every expert was once a beginner. This indicator is your gateway to understanding how institutional money moves in the markets. Raja Saien believes in YOUR potential to learn, grow, and achieve financial freedom through smart trading.
The path to success requires:
✨ Dedication to learning the craft
💪 Patience during the learning curve
🎯 Consistent practice with the right tools
🚀 Belief in your ability to master the markets
This isn't just an indicator - it's a mentor on your chart, showing you where the smart money is positioned. With hard work and this tool in your arsenal, you can transform your trading and your life.
Remember: The markets reward those who prepare, practice, and persist. Raja Saien has given you the tool - now it's your turn to commit to the journey!
Overview
This is an advanced TradingView indicator that identifies and displays Smart Money Concepts (SMC) and Order Blocks. It's designed for professional traders who want to understand institutional trading patterns and market structure.
Main Features
1. Smart Money Concepts (SMC) Detection
ZigZag Pattern Recognition: Identifies market structure using pivot highs and lows
Break of Structure (BOS): Detects when price breaks through important structural levels
Change of Character (CHoCH): Identifies trend reversals and shifts in market sentiment
Configurable Length: Adjustable ZigZag sensitivity (default: 5 bars)
2. Order Blocks (OB)
Order blocks are zones where institutional investors have placed large orders. The indicator identifies two types:
Bullish Order Blocks:
Created when market shifts from bearish to bullish
Marks the last bearish candle before the structure break
Displayed in green/teal color
Represents potential support zones where price may bounce
Looks back 10 bars to find the lowest bearish candle
Bearish Order Blocks:
Created when market shifts from bullish to bearish
Marks the last bullish candle before the structure break
Displayed in red color
Represents potential resistance zones where price may reject
Looks back 10 bars to find the highest bullish candle
3. Order Block Management
Dynamic Extension: Active order blocks extend forward on the chart
Mitigation Detection: Automatically detects when price fully breaks through an order block
Bullish OB mitigated when close drops below the bottom
Bearish OB mitigated when close rises above the top
Visual Feedback: Mitigated blocks turn gray and are labeled "Mitigated"
Auto-cleanup: Removes mitigated order blocks from active tracking
4. Moving Averages Suite
Includes multiple trend indicators for comprehensive analysis:
Fast EMA (default 9): Yellow line - captures short-term momentum
Slow EMA (default 21): Purple line - identifies medium-term trends
EMA 50: Orange line - major trend filter
SMA 200: Blue line - long-term trend and institutional reference point
All EMAs support multiple source options: Open, High, Low, Close, HL2, HLC3, OHLC4
Customization Options
SMC Settings
ZigZag Length: Control sensitivity of structure detection (2-100)
Show Order Blocks: Toggle order block display on/off
Visual Settings
Bullish Color: Customize color for bullish order blocks (default: teal #089981)
Bearish Color: Customize color for bearish order blocks (default: red #f23645)
Transparency: Order blocks displayed with 80% transparency for better chart visibility
EMA Settings
Fast EMA Length: Adjustable period (default: 9)
Slow EMA Length: Adjustable period (default: 21)
Source Selection: Choose calculation source for each EMA
Toggle EMA 50: Show/hide the 50-period EMA
Toggle SMA 200: Show/hide the 200-period SMA
How It Works
Structure Detection Process
Identifies pivot highs and lows based on specified length
Creates ZigZag lines connecting significant swing points
Tracks current trend direction (bullish/bearish/neutral)
Monitors for structural breaks that signal trend changes
Order Block Creation
When price breaks above a previous high (bullish BOS):
Scans last 10 bars for the lowest bearish candle
Creates bullish order block at that candle's range
Marks it as active support zone
When price breaks below a previous low (bearish BOS):
Scans last 10 bars for the highest bullish candle
Creates bearish order block at that candle's range
Marks it as active resistance zone
Order Block Lifecycle
Active: Box extends forward with colored border and background
Tested: Price can interact with the zone multiple times
Mitigated: Once price closes through the zone, marked as invalidated
Removed: Automatically cleaned up after mitigation
Trading Applications
Entry Strategies
Pullback Entries: Wait for price to return to an active order block
Confirmation: Look for bullish price action at bullish OBs, bearish at bearish OBs
EMA Confluence: Stronger setups when OBs align with EMA levels
Risk Management
Stop Loss: Place stops just beyond the order block boundary
Invalidation: Exit if order block gets mitigated
Multiple Timeframes: Check OBs on higher timeframes for stronger zones
Trend Analysis
EMA Alignment: All EMAs pointing same direction = strong trend
EMA 50 Test: Key level for trend continuation/reversal
SMA 200: Major institutional reference point
Technical Specifications
Max Boxes: 500 (sufficient for most chart timeframes)
Max Lines: 500
Max Labels: 500
Overlay: True (draws directly on price chart)
Version: Pine Script v5
Best Practices
Use on liquid markets (forex, major stocks, crypto)
Combine with volume analysis for confirmation
Higher timeframes produce more reliable order blocks
Wait for clear structure breaks before trusting new OBs
Don't trade against the major trend (SMA 200 direction)
Use multiple confirmations before entering trades
Limitations
Works best in trending markets with clear structure
May produce false signals in ranging/choppy conditions
Requires understanding of Smart Money Concepts
Not a standalone trading system - use with proper risk management
Historical order blocks don't guarantee future reactions

Multi-Layer Reversal Pro [The_lurker]🔮 MULTI-LAYER REVERSAL PRO
💡 CONCEPT
─────────────────────────────────────────────────────────────
An intelligent indicator that detects potential market reversal
points through multi-layer analysis combining momentum indicators,
Smart Money Concepts, and an advanced confirmation system.
HOW IT WORKS:
1. When prices reach exhaustion levels, market behavior is
analyzed through key Smart Money Concepts
2. When SMC concepts align with exhaustion, additional
advanced confirmations are activated
3. When all conditions are met, the appropriate signal appears
🥇 Gold 5M Tips
═════════════════════════════════════════════════════════════
📊 SIGNAL TYPES
═════════════════════════════════════════════════════════════
🟢 BUY SIGNALS
─────────────────────────────────────────────────────────────
BUY
Confirmed buy signal - all conditions met
Confidence: HIGH ●●●
E.BUY (Early Buy)
Early buy opportunity - strong exhaustion + high ADX
Confidence: MEDIUM ●●○
🔴 SELL SIGNALS
─────────────────────────────────────────────────────────────
SELL
Confirmed sell signal - all conditions met
Confidence: HIGH ●●●
E.SELL (Early Sell)
Early sell opportunity - strong exhaustion + high ADX
Confidence: MEDIUM ●●○
🟡 YELLOW WARNING
─────────────────────────────────────────────────────────────
Yellow candle = Warning of potential nearby reversal
→ Action: Monitor only, do not rush
⚠️ CLOSE TRADE
─────────────────────────────────────────────────────────────
"Close Trade ⚠️" appears when:
- A yellow warning candle appeared
- The next candle closed below the TP level
→ Meaning: Exit long position + automatic short entry
═════════════════════════════════════════════════════════════
🎯 QUICK ACTION GUIDE
═════════════════════════════════════════════════════════════
BUY / SELL
Confidence: HIGH
✅ Direct entry
E.BUY / E.SELL
Confidence: MEDIUM
⚡ Cautious entry / smaller size
Yellow Candle
Confidence: ALERT
👁️ Monitor only
Close Trade
Confidence: URGENT
🚪 Immediate exit
⚠️ DISCLAIMER
━━━━━━━━━━━━━━━━━━━━━━━━━━━━━━━━━━━━━━━━━━━
This indicator is for educational purposes only. Past performance does not
guarantee future results. Always use proper risk management and conduct your
own analysis before making trading decisions.
═════════════════════════════════════════════════════════════
مؤشر الانعكاس الذكي متعدد الطبقات
═════════════════════════════════════════════════════════════
💡 الفكرة
─────────────────────────────────────────────────────────────
مؤشر ذكي يكتشف نقاط الانعكاس المحتملة في السوق عبر تحليل
متعدد الطبقات يجمع بين مؤشرات الزخم ومفاهيم Smart Money
مع نظام تأكيدات متقدم.
آلية العمل:
1. عند وصول الأسعار إلى مراحل التشبع ، يتم تحليل سلوك السوق من عدة نقاط جوهرية تعتمد على مفاهيم Smart Money
2. عند تطابق مفاهيم SMC مع التشبع ، تُفعَّل تأكيدات متقدمة
3. عند تحقق جميع الشروط، تظهر الإشارة المناسبة
🥇 نصيحة للذهب 5 دقائق
═════════════════════════════════════════════════════════════
📊 أنواع الإشارات
═════════════════════════════════════════════════════════════
🟢 إشارات الشراء
─────────────────────────────────────────────────────────────
1- شراء BUY
إشارة شراء مؤكدة - استوفت جميع الشروط
الثقة: عالية ●●●
2- شراء مبكر E.BUY
فرصة شراء مبكرة - تشبع قوي + ADX عالي
الثقة: متوسطة ●●○
🔴 إشارات البيع
─────────────────────────────────────────────────────────────
1- بيع SELL
إشارة بيع مؤكدة - استوفت جميع الشروط
الثقة: عالية ●●●
2- بيع مبكر E.SELL
فرصة بيع مبكرة - تشبع قوي + ADX عالي
الثقة: متوسطة ●●○
🟡 التحذير الأصفر
─────────────────────────────────────────────────────────────
الشمعة الصفراء = تحذير من احتمال انعكاس قريب
← التصرف: راقب فقط ولا تتسرع
⚠️ إغلاق الصفقة
─────────────────────────────────────────────────────────────
تظهر علامة "إغلاق الصفقة ⚠️" عندما:
- ظهرت شمعة تحذير صفراء
- الشمعة التالية أغلقت تحت مستوى TP
← المعنى: إشارة خروج من الشراء + فتح صفقة بيع تلقائياً
═════════════════════════════════════════════════════════════
🎯 دليل التصرف السريع
═════════════════════════════════════════════════════════════
شراء/بيع BUY / SELL
الثقة: عالية
✅ دخول مباشر
شراء مبكر/ بيع مبكر E.BUY / E.SELL
الثقة: متوسطة
⚡ دخول بحذر أو حجم أقل
شمعة صفراء
الثقة: تنبيه
👁️ مراقبة فقط
إغلاق صفقة
الثقة: عاجل
🚪 خروج فوري
═════════════════════════════════════════════════════════════
⚠️ إخلاء المسؤولية
━━━━━━━━━━━━━━━━━━━━━━━━━━━━━━━━━━━━━━━━━━━
هذا المؤشر للأغراض التعليمية فقط. الأداء السابق لا يضمن النتائج المستقبلية.
استخدم دائماً إدارة مخاطر مناسبة وقم بتحليلك الخاص قبل اتخاذ قرارات التداول.

TRADE2GO CALCULATORMobile-Optimized Position Size Calculator with Intuitive Moveable Lines
Trading on mobile just got easier. Our TradingView calculator features drag-and-drop interactive lines designed specifically for touchscreen devices, eliminating the need for manual price input on small screens.
Key Features:
Easy Touch Controls - Simply drag the Entry, Stop Loss, and Take Profit lines directly on your chart. No more typing precise prices on tiny keyboards or struggling with number pads while analyzing the market.
Real-Time Calculations - As you move the lines, lot sizes and risk parameters update instantly. See your position size, potential profit, and risk amount change dynamically as you adjust your trade setup.
Perfect for Mobile Trading - Whether you're trading on-the-go or prefer mobile analysis, the moveable lines provide a seamless experience that works naturally with touch gestures. Pinch to zoom, drag to position, and your calculations follow your trade plan in real-time.
Visual Trade Planning - Place your lines where you see support/resistance levels, trend lines, key chart patterns, or using Pip Booster trading levels. Your position sizing adapts automatically to your technical analysis, keeping risk management front and center.
One-Glance Risk Assessment - All critical information displays clearly: lot size, risk and reward amounts in your account currency, and the calculated lot size to use—all updating as you refine your trade setup visually on the chart.
Trade smarter on mobile with a calculator that moves at the speed of your analysis.

On Balance Volume [BrightSideTrading]
# On Balance Volume - Complete User Guide
## Overview
This enhanced OBV indicator provides clean, actionable volume analysis with intelligent signal filtering. It combines On-Balance Volume (OBV) with a smoothed signal line to identify shifts in buying and selling pressure without chart clutter.
**Key Features:**
- Real-time OBV and signal line visualization
- Smart crossover detection with confirmation filtering
- Z-Score momentum analysis
- Customizable signal alerts with V-shaped markers
- Window-normalized option for detrended analysis
---
## What is On-Balance Volume (OBV)?
OBV is a volume-based momentum indicator that accumulates volume on up days and subtracts volume on down days. It answers a fundamental question: **Is volume flowing in (buying) or out (selling)?**
**Formula:**
- If Close > Previous Close: OBV = Previous OBV + Volume
- If Close < Previous Close: OBV = Previous OBV - Volume
- If Close = Previous Close: OBV = Previous OBV (unchanged)
**What it tells you:**
- **Rising OBV** = Accumulation (smart money buying)
- **Falling OBV** = Distribution (smart money selling)
- **OBV above zero line** = Net positive buying pressure
- **OBV below zero line** = Net negative selling pressure
---
## Interface & Settings
### **MAIN VISUALIZATION**
**OBV Line (Green/Red Ribbon)**
- Green when OBV is above the signal line (bullish trend)
- Red when OBV is below the signal line (bearish trend)
- Toggles between window-normalized (detrended) and raw values
**Signal Line (Orange)**
- Smoothed average of OBV
- Crossovers with OBV generate buy/sell signals
- Default: 21-period SMA
**V-Shaped Markers**
- Green upward V = Bullish crossover (buy signal)
- Red downward V = Bearish crossover (sell signal)
- Appears at the OBV value when signal is triggered
**Zero Line (Yellow)**
- Center equilibrium point for volume balance
- Acts as support/resistance for OBV
- Separates buying pressure (above) from selling pressure (below)
---
### **SOURCE GROUP**
**Source**
- **Default:** Close
- **Options:** Open, High, Low, or any custom value
- Controls which price value triggers OBV direction changes
- Most traders use Close for standard OBV calculation
---
### **SIGNAL SMOOTHING GROUP**
**Show Signal?**
- **Default:** ON
- Toggle visibility of the signal line
- Disable if you prefer to see raw OBV only
**Smoothing Type**
- **SMA (Simple Moving Average)** - Default, standard smoothing
- **EMA (Exponential Moving Average)** - Faster response, weights recent bars more heavily
- **Choose SMA** for consistent, traditional OBV signals
- **Choose EMA** for faster trend identification (more whipsaws possible)
**Smoothing Length**
- **Default:** 21 bars
- **Range:** 1-200 bars
- **Lower values** (5-14): Faster signals, more noise
- **Higher values** (30-50): Slower signals, fewer false alarms
- **Recommendation:** Use 21-25 for most timeframes
---
### **SIGNAL FILTERING GROUP**
This is your primary control for signal quality and frequency.
**Show Signal Markers?**
- **Default:** ON
- Toggle the V-shaped buy/sell markers on/off
- Disable if markers distract from your analysis
**Signal Filter Type**
- **None** - Shows every single crossover (noisy, best for skilled traders)
- **Confirmation Bars** - Waits N bars before confirming signal (recommended)
- **Strength-Based** - Only signals during strong momentum (filters weakest moves)
#### **CONFIRMATION BARS MODE** (Recommended)
Best for reducing false signals while staying responsive to real moves.
**Confirmation Bars**
- **Default:** 2 bars
- **Range:** 1-10 bars
- Waits for the signal to hold for N consecutive bars after crossover
- **Setting 1:** Every crossover (same as "None")
- **Setting 2:** Wait 1 bar confirmation (good balance)
- **Setting 3:** Wait 2 bars confirmation (filters 50% of noise)
- **Setting 4+:** Very selective, misses quick reversals
**How it works:**
1. OBV crosses signal line → Confirmation counter starts
2. If OBV stays on correct side for 2 bars → V-marker appears
3. If OBV crosses back → Counter resets, no signal
#### **STRENGTH-BASED MODE**
Only signals when momentum is statistically significant.
**Min Z-Score Strength**
- **Default:** 0.3
- **Range:** 0.0-3.0
- Requires OBV deviation from its mean to reach this threshold
- **Setting 0.1-0.3:** More signals, lower quality
- **Setting 0.5-0.8:** Moderate signals, good quality
- **Setting 1.0+:** Only the strongest momentum shifts
**How it works:**
- Calculates how far OBV is from its 50-bar average (Z-score)
- Only shows signals when this distance is meaningful
- Automatically avoids weak, choppy market conditions
---
### **VISUALS & COLORS GROUP**
**Highlight Crossovers?**
- **Default:** ON
- Master toggle for all signal markers
- Turn OFF to see only the OBV/signal lines
**Apply Ribbon Filling?**
- **Default:** ON
- Colors the space between OBV and signal line
- Green fill = OBV above signal (bullish)
- Red fill = OBV below signal (bearish)
- Provides clear visual trend confirmation
- Turn OFF for minimal chart clutter
---
### **STATS & ZONES GROUP**
**Use Window-Normalized OBV (visual only)?**
- **Default:** ON
- Removes long-term trend from OBV for clearer short-term signals
- Detrends the indicator to highlight recent momentum changes
- **ON:** Better for swing trading and identifying reversals
- **OFF:** Better for trend-following strategies
- Note: Z-Score always uses raw OBV for statistical accuracy
**OBV Normalize Window**
- **Default:** 200 bars
- Lookback period for detrending calculation
- Larger values = more aggressive detrending
- Adjust if you want OBV to oscillate more/less around zero
**Show Z-Score (OBV)?**
- **Default:** ON
- Displays statistical momentum indicator below main chart
- Ranges from -3 to +3 (most data within -2 to +2)
- High Z-Score = Strong buying momentum
- Low Z-Score = Strong selling momentum
**Z-Score Lookback**
- **Default:** 50 bars
- Period for calculating Z-Score mean and standard deviation
- Larger = smoother Z-Score, slower response
- Smaller = noisier Z-Score, faster response
**Show ROC (OBV Momentum)?**
- **Default:** OFF
- Rate of Change indicator for OBV velocity
- Useful for identifying momentum turning points
- Enable if you want to see speed of volume changes
**ROC Lookback**
- **Default:** 14 bars
- Period for ROC calculation
**Show Z-Score StdDev Zones?**
- **Default:** ON
- Shaded regions around zero line showing statistical boundaries
- Inner Zone (±1 Z) = Normal variation
- Outer Zone (±2 Z) = Extreme moves, potential reversals
- Helps identify overbought/oversold volume conditions
**Inner Zone (±Z)**
- **Default:** 1.0
- First boundary for standard deviation zones
- Most normal trading occurs within ±1
**Outer Zone (±Z)**
- **Default:** 2.0
- Second boundary for extreme conditions
- Crossing these zones indicates significant momentum shift
---
## Trading Strategy Examples
### **Strategy 1: Signal Line Crossovers (Beginner)**
**Setup:**
- Signal Filter Type: **Confirmation Bars**
- Confirmation Bars: **2-3**
- Show Signal Markers: **ON**
**Rules:**
1. **BUY signal** (green V): When OBV crosses above signal line and holds for 2-3 bars
- Confirms buying pressure is building
- Look for price to follow within 1-3 bars
2. **SELL signal** (red V): When OBV crosses below signal line and holds for 2-3 bars
- Confirms selling pressure is increasing
- Expect price decline
3. **Exit:** Take profits at next signal or use price support/resistance
**Best For:** Swing trading, intraday reversals, timeframes 5m-1h
---
### **Strategy 2: Zero Line Bounce (Intermediate)**
**Setup:**
- Signal Filter Type: **Strength-Based**
- Min Z-Score Strength: **0.5**
- Show Z-Score StdDev Zones: **ON**
**Rules:**
1. **Watch OBV approach zero line** during established trends
- OBV bouncing repeatedly off zero = trend is healthy
- OBV breaking through zero = trend reversal imminent
2. **Enter on bounce:** Buy when OBV bounces from zero line in uptrend
3. **Exit on break:** Close position when OBV breaks below zero line
4. **Confirm with Z-Score:** Only take trades when Z-Score shows momentum (|Z| > 0.5)
**Best For:** Trend traders, identifying trend strength, medium timeframes 15m-4h
---
### **Strategy 3: Momentum Extremes (Advanced)**
**Setup:**
- Signal Filter Type: **None**
- Show Z-Score StdDev Zones: **ON**
- Outer Zone: **2.0**
**Rules:**
1. **Identify extremes:** When Z-Score breaks outer zone (±2.0)
- Indicator is in extreme territory
- Likely overextended
2. **Fade extremes:** Take opposite position when Z-Score hits extreme
- High Z (>2.0) = OBV overbought, expect pullback
- Low Z (<-2.0) = OBV oversold, expect bounce
3. **Confirm:** Wait for crossover signal to enter
4. **Target:** Outer zone of opposite side or zero line
**Best For:** Range trading, mean reversion, experienced traders only
---
## Reading the Indicator in Different Markets
### **Strong Uptrend**
- OBV consistently above signal line (green)
- OBV well above zero line, rising higher lows
- Z-Score positive, trending upward
- **Action:** Buy dips to signal line, sell at resistance
### **Strong Downtrend**
- OBV consistently below signal line (red)
- OBV well below zero line, making lower highs
- Z-Score negative, trending downward
- **Action:** Sell rallies to signal line, cover at support
### **Consolidation/Choppy Market**
- OBV whipsaws around signal line frequently
- Crossovers occur every few bars
- Z-Score oscillating between -1 and +1
- **Action:** Increase confirmation bars to 3-4, or switch to strength-based filter
### **Accumulation (Bottom Formation)**
- OBV rising while price is flat or falling
- Volume flowing in despite downtrend (bullish divergence)
- Z-Score climbing while price lows hold
- **Action:** Expect breakout up; prepare buy near support
### **Distribution (Top Formation)**
- OBV falling while price is flat or rising
- Volume flowing out despite uptrend (bearish divergence)
- Z-Score falling while price continues higher
- **Action:** Expect breakdown down; prepare short near resistance
---
## Parameter Tuning Guide
### **Aggressive Settings (More Signals)**
- Smoothing Length: 14
- Signal Filter: None or Confirmation Bars: 1
- Min Z-Score: 0.1
- Best for: Day trading, high volatility stocks
- Risk: More false signals
### **Balanced Settings (Recommended)**
- Smoothing Length: 21
- Signal Filter: Confirmation Bars: 2
- Min Z-Score: 0.3
- Best for: Swing trading, most market conditions
- Risk/Reward: Moderate
### **Conservative Settings (Fewer Signals)**
- Smoothing Length: 30-40
- Signal Filter: Confirmation Bars: 3-4 or Strength-Based: 0.7+
- Min Z-Score: 0.8
- Best for: Position trading, high-conviction trades only
- Risk: May miss some moves
---
## Common Questions & Troubleshooting
**Q: Why are there more sell signals than buy signals?**
A: This reflects the actual market action. Markets often decline faster than they rise (fear > greed). Confirm signals with price action and support/resistance.
**Q: The indicator keeps whipsawing, should I hide it?**
A: Increase Confirmation Bars to 3-4 or switch to Strength-Based filter. Market conditions matter—choppy markets require stricter filters.
**Q: What's the difference between normalized and raw OBV?**
A: Normalized (detrended) shows shorter-term momentum by removing long-term trends. Raw OBV shows absolute accumulation/distribution over the full period. Use normalized for swing signals, raw for trend confirmation.
**Q: My signals come too late. How do I get faster entry?**
A: Reduce Smoothing Length (try 14 instead of 21), use EMA instead of SMA, or set Confirmation Bars to 1. Trade-off: More false signals.
**Q: Can I use this for day trading?**
A: Yes, on 1m-5m charts with aggressive settings. Use Confirmation Bars: 1 and focus on Z-Score > 0.5 entries only.
**Q: Should I trade every signal?**
A: No. Filter signals using: price near support/resistance, multiple indicators confirming, and Z-Score showing momentum. Best signals occur at key levels.
---
## Best Practices
1. **Always confirm with price action:** OBV signals work best when price is near support, resistance, or moving average. Don't trade signals in a vacuum.
2. **Use volume context:** Check if volume is increasing or decreasing on the signal. Strong signals have volume confirmation (increasing volume on OBV spikes).
3. **Adjust settings per timeframe:**
- 1m-5m: Smoothing 12, Confirmation 1, Z-Score 0.2
- 15m-1h: Smoothing 20, Confirmation 2, Z-Score 0.3
- 4h-1d: Smoothing 25, Confirmation 3, Z-Score 0.5
4. **Watch the zero line:** It's your friend. OBV behavior at the zero line reveals trend strength. Bounces = healthy trend. Breaks = reversal.
5. **Risk management:** No indicator is perfect. Use proper position sizing and stop losses. OBV should confirm your thesis, not be the only reason to trade.
6. **Combine with other indicators:**
- Price moving averages for trend confirmation
- RSI or Stochastic for overbought/oversold levels
- Support/resistance for entry/exit zones
- MACD for momentum divergences
---
## Disclaimer
This indicator is for educational and informational purposes only. It is not financial advice. Past performance does not guarantee future results. Always conduct your own research and consult with a financial advisor before making trading decisions. Trading carries risk, including potential loss of principal.
---
## Version History
**Version 1.0** - Initial release with enhanced signal filtering, Z-Score analysis, and customizable parameters.
