Dealar VIX Implied Range + Retracement LevelsThis Implied range Is derived by the VIX(1 sd annual +/- Implied move.)
This Indicator plots the daily Implied range, A lot of quantitative trading firms/ MM firms hedge their delta & gamma exposure around the Implied range(prop calc). I have added retracement levels as well, so you have more pivot levels.
Enjoy!
Cari dalam skrip untuk "spx"

Balance of Power Heikin Ashi Investing Strategy Balance of Power Heikin Ashi Investing Strategy
This is a swing strategy designed for investment help.
Its made around the Balace of Power indicator, but has been adapted on using the Monthly Heikin Ashi candle from the SPY asset in order to be used with correlation for US Stock/ETF/Index Markets.
The BOP acts as an oscilallator showing the power of a bull trend when its positive and a bearish trend when its in negative. At the same time we can spot reversals, based on the percentiles ( 99/1)
The rules for entry :
For long : The 99 percentile is ascending, and we are either in a positive value (>0), or we crossed the bottom place ( -0.35)
For short : the 99 and 1 percentile are descending, and we are either in a negative value(<0), or we crossed down the top place ( 0.6)
If you have any questions please let me know !

KERPD Noise Filter - Kaufman Efficiency Ratio and Price DensityThis indicator combines Kaufman Efficiency Ratio (KER) and Price Density theories to create a unique market noise filter that is 'right on time' compared to using KER or Price Density alone. All data is normalized and merged into a single output. Additionally, this indicator provides the ability to consider background noise and background noise buoyancy to allow dynamic observation of noise level and asset specific calibration of the indicator (if desired).
The basic theory surrounding usage is that: higher values = lower noise, while lower values = higher noise in market.
Notes: NON-DIRECTIONAL Kaufman Efficiency Ratio used. Threshold period of 30 to 40 applies to Kaufman Efficiency Ratio systems if standard length of 20 is applied; maintained despite incorporation of Price Density normalized data.
TRADING USES:
-Trend strategies, mean reversion/reversal/contrarian strategies, and identification/avoidance of ranging market conditions.
-Trend strategy where KERPD is above a certain value; generally a trend is forming/continuing as noise levels fall in the market.
-Mean reversion/reversal/contrarian strategies when KERPD exits a trending condition and falls below a certain value (additional signal confluence confirming for a strong reversal in price required); generally a reversal is forming as noise levels increase in the market.
-A filter to screen out ranging/choppy conditions where breakouts are frequently fake-outs and or price fails to move significantly; noise level is high, in addition to the background buoyancy level.
-In an adaptive trading systems to assist in determining whether to apply a trend following algorithm or a mean reversion algorithm.
THEORY / THOUGHT SPACE:
The market is a jungle. When apex predators are present it often goes quiet (institutions moving price), when absent the jungle is loud.
There is always background noise that scales with the anticipation of the silence, which has features of buoyancy that act to calibrate the beginning of the silence and return to background noise conditions.
Trend traders hunt in low noise conditions. Reversion traders hunt in the onset of low noise into static conditions. Ranges can be avoided during high noise and buoyant background noise conditions.
Distance between the noise line and background noise can help inform decision making.
CALIBRATION:
- Set the Noise Threshold % color change line so that the color cut off is where your trend/reversion should begin.
- Set the Background Noise Buoyancy Calibration Decimal % to match the beginning/end of the color change Noise Threshold % line. Match the Background Noise Baseline Decimal %' to the number set for buoyancy.
- Additionally, create your own custom settings; 33/34 and 50 length also provides interesting results.
- A color change tape option can be enabled by un-commenting the lines at the bottom of this script.
Market Usage:
Stock, Crypto, Forex, and Others
Excellent for: NDQ, J225, US30, SPX
Market Conditions:
Trend, Reversal, Ranging

Stock Gaps SPY Correlation StrategyThis is daytrade stock strategy, designed to take the best out of the daily gaps that are forming between the close of previous day and opening of present day.
At the same time its logic has been adapted for SPY chart, in order to use correlation with the other stocks/assets/ etf which are linked with SP500 movement.
Lastly it has been added 2 new confirmation logics, based on the USI: advance/decline chart and percentage above vwap among all US stocks.
The rules for entry are simple :
We are at the opening daily candle, we have a long/short gap based on where the opening is happening and at the same time we are checking to see that the current different between the current difference between low and previous high (or viceversa) is higher than an established parameter(minimal deviation )
For exit, we exit based on time/clock parameter, in this case by default I selected 1h and half before close of the US session.
For testing purposes I have used 10% of the available capital, with a 0.0035$ comission per each share bought ( IBKR comissions)
If there are any questions, please let me know either here or in private !

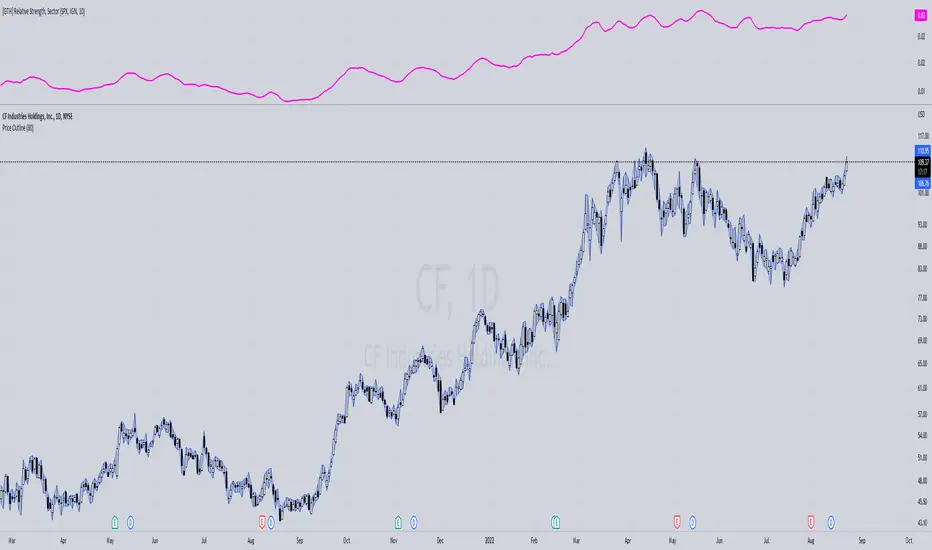
[GTH] Relative Strength, SectorsDisplays the Relative Strength (RS) of a symbol in relation to some common sector ETFs, SPX and NDX (select from drop-down list). This is done by dividing the symbol's price by the chosen sector ETF's price.
You can also select a symbol of your choice to compare against.
Interpretation:
RS line ascending: symbol performs stronger than the sector ETF.
RS line decending: symbol performs weaker than the sector ETF.
In case of error reports: please be specfic. Thanks.
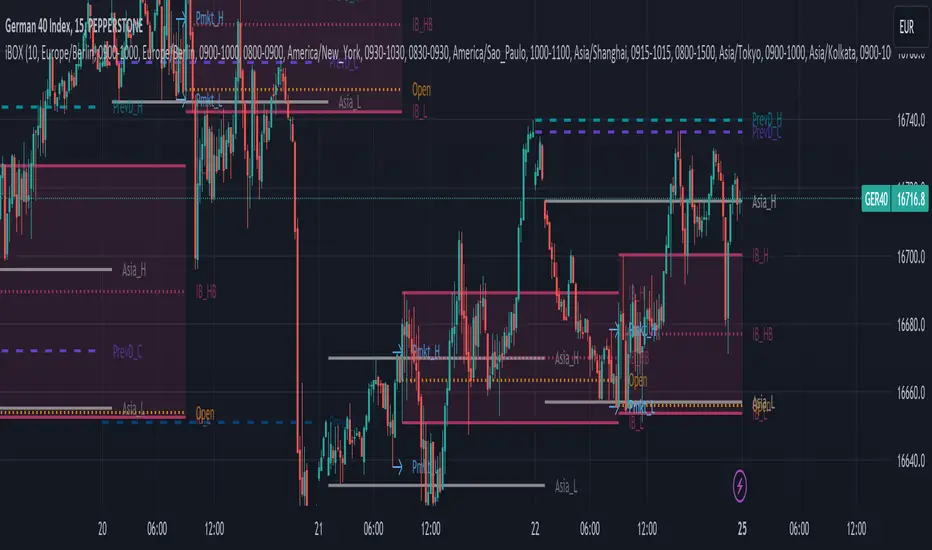
iBox, Initial Balance | IB High, Low, Midpoint | OpeningThis Indicator will print basically 4 lines.
You have to understand the importance of the "Initial Balance" the first trading hour of Cash session is very important in trading stocks and indizes.
So you will get 4 lines:
Opening
Initial Balance High
Initial Balance Low
Initial Balance Midpoint/Halfback
Most indicators for Range Box, Opening Trade, Opening Range, Initial Balance, iBOX and "Ultimate Lines" will only use the timezone of the exchange or your own timezone. I'm living in europe and we have this daylight saving time change in Summer/Winter - which will cause problems with most of the existing indicators or at least will push you to change the times regularly.
Another important point: I really like to switch the indizes when trading on my mobile. So what will happen when you set up opening range for DAX at 09:00 and then switch to S&P500? All indicators I tried failed here - they will just draw a wrong line for SPX, NDX, DJI, FTSE, ASX etc. I fixed that and hard coded stock exchanges and ticker symbols into 3 main groups Initial Balance EU/US/Asia
For example we take DAX - XETRA DAX is opening at 09:00 MEZ (Europe/Berlin)
The Initial Balance is set during the H1 Candle from 09:00 - 09:59
Please be aware, that some cash indizes only deliver data to TradingView after the "opening auction" - so for Xetra DAX you have to book live data and often you will only see data at 09:02/09:03 after the opening auction.
So you will get different opening lines compared from cash to future or your CFD provider. Future and CFD should fit for 99%
The Opening Line will be drawn at exactly 09:00
IB High on the highest price during the H1 candle
IB Low on the lowest price during the H1 candle
IB Halfback is simple: (IB High + IB Low) / 2
The lines will be drawn from cash start until next day and will end 2 minutes before the next cash session will start again. Please make your own experience! Activate the indicator for a CFD or Future switch to M15 and watch the wicks around the 4 lines. Even in the night or the next morning before the next Initial Balance will be set.
For me the lines are valid for around 24 hours and often longer. That's why it's good to have the old lines on the chart too.
To-do:
Yesterday high / low / close / halfback (also for last week and month)
Labels for the lines - sometimes only the colors will confuse you - a simple label should be a benefit (IB_h, IB_l, IB_1/2, 1D_o)
Range Lines for Asia Range and Premarket Range - additionaly a parameter to disable premarket lines when premarket is trading in asia range.
Add Alert condition to get alerts after IB is set
If you have and thoughts, ideas or improvements, please send me an message or leave an comment!
Like i said, the stock exchanges and ticker symbols are hard coded and can be extended for all relevant assets.
Have fun and i really hope this indicator will help improving your trading experience!
Daily/Weekly ExtremesBACKGROUND
This indicator calculates the daily and weekly +-1 standard deviation of the S&P 500 based on 2 methodologies:
1. VIX - Using the market's expectation of forward volatility, one can calculate the daily expectation by dividing the VIX by the square root of 252 (the number of trading days in a year) - also know as the "rule of 16." Similarly, dividing by the square root of 50 will give you the weekly expected range based on the VIX.
2. ATR - We also provide expected weekly and daily ranges based on 5 day/week ATR.
HOW TO USE
- This indicator only has 1 option in the settings: choosing the ATR (default) or the VIX to plot the +-1 standard deviation range.
- This indicator WILL ONLY display these ranges if you are looking at the SPX or ES futures. The ranges will not be displayed if you are looking at any other symbols
- The boundaries displayed on the chart should not be used on their own as bounce/reject levels. They are simply to provide a frame of reference as to where price is trading with respect to the market's implied expectations. It can be used as an indicator to look for signs of reversals on the tape.
- Daily and Weekly extremes are plotted on all time frames (even on lower time frames).

Caleb's Supply and Demand ZonesThis script takes predetermined levels and plots them as supply and demand zones. These zones are automatically colored as supply or demand based on price action. Additionally, two EMAs and a VWAP are included to help make intraday trading decisions. This script is written to intuitively deduce between SPY, SPX, ES, US500, QQQ, and NQ to plot the zones in their proper corresponding price levels.

Scalp LevelsThis script is to provide scalp levels based on Price Action. It is mainly built keeping price action of SPY/SPX in mind.

TF Segmented Polynomial Regression [LuxAlgo]This indicator displays polynomial regression channels fitted using data within a user selected time interval.
The model is fitted using the same method described in our previous script:
Settings
Degree: Degree of the fitted polynomial
Width: Multiplicative factor of the model RMSE. Controls the width of the polynomial regression's channels
Timeframe: Fits the polynomial regression using data within the selected timeframe interval
Show fit for new bars: If selected, will fit the regression model for newly generated bars, else the previous fitted value is displayed.
Src: Input source
Usage
Segmented (or piecewise) models yield multiple fits by first partitioning the data into multiple intervals from specific partitioning conditions. In this script this partitioning condition is for a user selected timeframe to change.
Segmented models can be particularly pertinent for market prices, which often describes a series of local trends.
Segmented polynomial regressions can describe the nature of underlying trends in the price from their fit, such as if an underlying trend is more linear (trending) or constant (ranging), and if a trend is monotonic.
The above chart shows a monthly partitioning on SPX 15m, using a polynomial regression of degree 3. Channel extremities allows highlighting local tops/bottoms.
For real time applications users can choose to fit a current model to incoming price data using the Show fit for new bars settings.
Details
The script does not make use of line.new to display the segmented linear regressions, which allows showing a higher number of historical fits. Each channel extremity as well as the model fit is displayed from the plot function, as such user can more easily set alerts on them.
It is important to note that achieving this requires accessing future price data, as such this script is subject to lookahead bias, historical results differ from the results one could have obtained in real-time.

TASC 2022.08 Trading The Fear Index█ OVERVIEW
TASC's August 2022 edition of Traders' Tips includes an article by Markos Katsanos titled "Trading The Fear Index". This script implements a trading strategy called the “daily long/short trading system for volatility ETFs” presented in this article.
█ CONCEPTS
This long-term strategy aims to capitalize on stock market volatility by using exchange-traded funds (ETFs or ETNs) linked to the VIX index.
The strategy rules (see below) are based on a combination of the movement of the Cboe VIX index, the readings of the stochastic oscillator applied to the SPY ETF relative to the VIX, and a custom indicator presented in the article and called the correlation trend . Thus, they are not based on the price movement of the traded ETF itself, but rather on the movement of the VIX and of the S&P 500 index. This allows the strategy to capture most of the spikes in volatility while profiting from the long-term time decay of the traded ETFs.
█ STRATEGY RULES
Long rules
Rising volatility: The VIX should rise by more than 50% in the last 6 days.
Trend: The correlation trend of the VIX should be 0.8 or higher and also higher than yesterday's value.
VIX-SPY relative position: The 25-day and 10-day VIX stochastics should be above the 25-day and 10-day SPY stochastics respectively. In addition, the 10-day stochastic of the VIX should be above its yesterday's value.
Long positions are closed if the 10-day stochastic of the SPY rises above the 10-day stochastic of the VIX or falls below the yesterday's value.
Short rules
Declining volatility: The VIX should drop over 20% in the last 6 days and should be down during the last 3 days.
VIX threshold: The VIX should spend less than 35% of time below 15.
VIX-SPY relative position: The 10-day VIX stochastic should be below the 10-day SPY stochastic. In addition, the 10-day SPY stochastic should be higher than the yesterday's value.
Long positions are closed if the first two Long rules are triggered (Rising volatility and Trend).
The script allows you to display the readings of the indicators used in the strategy rules in the form of oscillator time series (as in the preview chart) and/or in the form of a table.

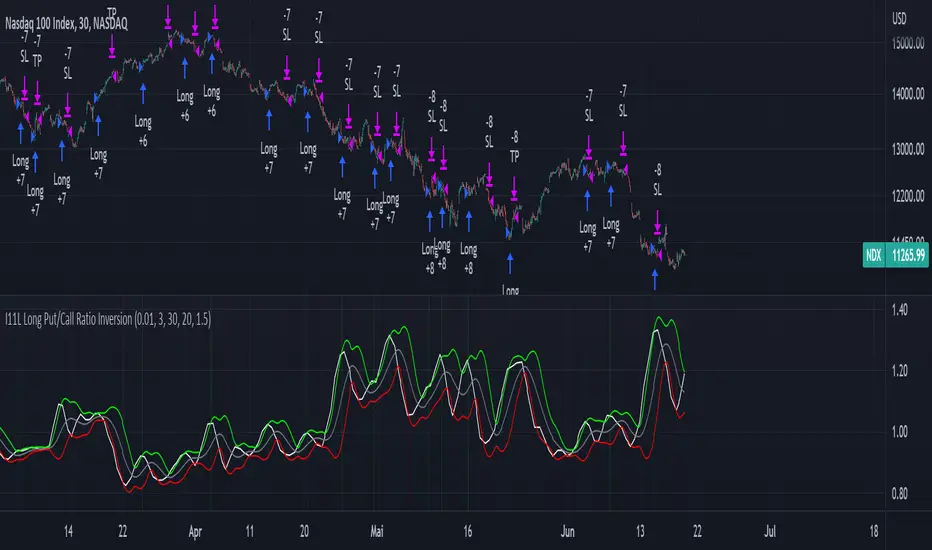
I11L Long Put/Call Ratio InversionThe Strategy uses the Put/Call Options Ratio Inversaion as a Signal and Implements simple Money Management rules.
It is adjusted for the NDX and for the SPX in the 30min Range.
The Oscilation has to be finetuned to reflect the correct Reversal point.
A good indicator of the correct Reversal Point is a solid range of good backtesting results..
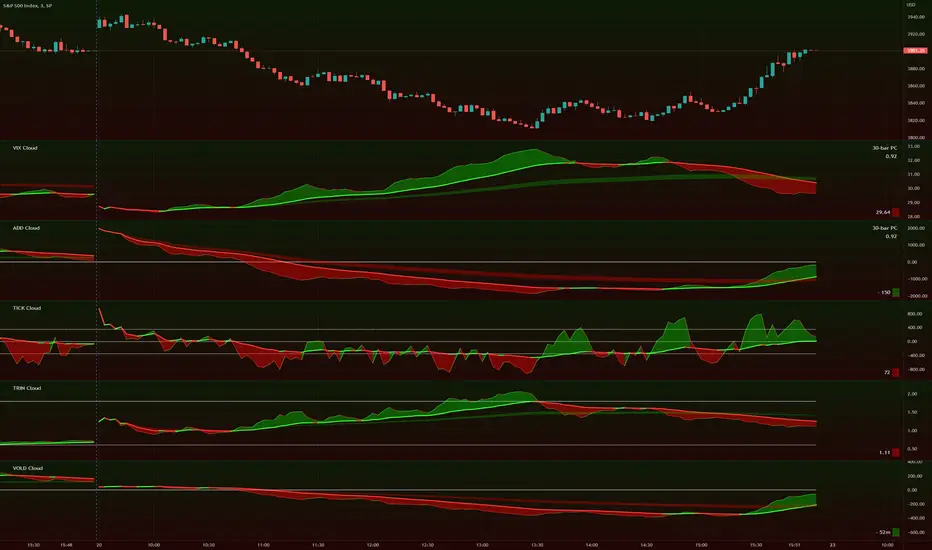
TIG's Market Internals Clouds Indicator v2.0=================================
== GENERAL INTRODUCTION
=================================
If you find market internals inform your intraday trading decisions (SPX, ES futures, SPY or more generally) this may be helpful.
Currently available internals are:
- ADD
- TICK
- TRIN
- VIX
- VOLD
Also, you can display your favorite alternative market internal (or BTC, if you want?!) by entering the relevant ticker in the 'Custom' field
=================================
== NOTES
=================================
The default EMA lengths seem to work reasonably well for 1, 2, 3-minute timeframes (except for TICK - you may wish to apply a bit more smoothing to TICK to reduce the noise)
Of course; you can add this indicator to your chart multiple times, and display a different internal each time.
The default Text Color is set as a mid-grey, which is readable in both TV color schemes. I prefer dark mode, and so I change the text color to white. You can't see the scheme setting from within a script, unfortunately, so this can't be automated.
=================================
== EXPERIMENTAL FEATURE
=================================
As a free bonus, the indicator can display the 30-bar (default) Pearson Correlation Coefficient between the internal, and price action (based on the super-fast EMA, to give a bit of smoothing). This may give a clue as to whether or not the market is aligned with what the internal is doing, or if the market (today) is not correlated with the particular internal.
Very roughly speaking:
- 0.50 means that 50% of the price action can be explained by reference to the internal. This is about the same level of correlation between VIX and Actual Move
- 0.80 suggests pretty strong correlation
I don't know why (yet) but sometimes this works, and sometimes it doesn't display a sensible figure.
=================================
== QUESTIONS AND FEEDBACK
=================================
If you have any general questions about market internals, Google is your friend.
If you have any specific queries, bug reports, feature requests or general feedback about this indicator please leave a comment below, and I'll get back to you ASAP!
Parabolic SAR Heikin Ashi MTF Candle ScalperThis is scalper strategy designed around parabolic sar indicator, where as an input candle value it uses the heikinashi from a higher timeframe.
This example has been adapted to SPY/SPX chart
In this case ,we are using a 5 min chart, but the calculations are made on a 15 min heikin ashi chart for the PSAR and then on 5 min chart we plot the results.
At the same time we are conditioning the entry to be base on a time/session for daytrading/scalper mentality
In this case we only enter within the first 30 min of SPY opening session , and then we exit after 3-4 hours of staying in the position ( unless we hit a reverse condition).
For long condition we enter when the mtf ha candle close is above the mtf psar and for short condition we enter when the mtf ha candle close is below the mtf psar
This script is made with an educational purpose to show the power of multiple time frame approach compared to a single chart.
If you have any questions, let me know !

Infiten Slope StrategyThis model is an index fund trading model, which uses moving averages and price percentage oscillators to minimize downside exposure.

ATR and IV Volatility TableThis is a volatility tool designed to get the daily bottom and top values calculated using a daily ATR and IV values.
ATR values can be calculated directly, however for IV I recommend to take the values from external sources for the asset that you want to trade.
Regarding of the usage, I always recommend to go at the end of the previous close day of the candle(with replay function) or beginning of the daily open candle and get the expected values for movements.
For example for 26April for SPX, we have an ATR of 77 points and the close of the candle was 4296.
So based on ATR for 27 April our TOP is going to be 4296 + 77 , while our BOT is going to be 4296-77
At the same time lets assume the IV for today is going to be around 25% -> this is translated to 25 / (sqrt (252)) = 1.57 aprox
So based on IV our TOP is going to be 4296 + 4296 * 0.0157 , while our BOT is going to be 4296 - 4296 * 0.0157
I found out from my calculations that 80-85% of the times these bot and top points act as an amazing support and resistence points for day trading, so I fully recommend you to start including them into your analysis.
If you have any questions let me know !

HLC True Strength Indicator (with Vix)HLC True Strength Indicator Volume Weighted with Vix Line by SpreadEagle71
This indicator is a True Strength Indicator with Close, High and Low used together, along with the TSI of the Vix.
The white line is the close. The red line is the lows and the blue is the highs. These are also volume-weighted.
How to Interpret:
1. zero line crosses. If SPY/SPX500 crosses the zero line, then its bullish. If the purple Vix line crosses up, watch out because this is bearish.
2. white/blue/red lines cross purple (Vix). If they cross upwards, this is bullish. If downward, this is bearish. Basically, SPX, ES1!, SPY or even DIA can be used. The security and the Vix should travel in opposite directions and cross the zero-line at the same time. But this is not always the case.
3. Black area infills. These are used between the close and the highs (blue) and the lows(red). Close should not be between these in order to have momentum.
4. Close (white line) leads. Close is the last price so it tends to show where the others (highs and lows) are going. If the close is sagging below a high where the blue lines are on top, this could mean that there is a reversal coming. Same holds true for a white line above a "valley" formed by the blue and red lines; it could mean a reversal to the upside soon.
5. The Black Infill areas as a squeeze or contraction/expansion area. The thinner the black infill areas, the more of a momentum "squeeze" could be present. Wide black infill areas mean increased volatility and what may come next is a reversion to the mean for volatility. See TTM Squeeze Indicator or the Squeeze Momentum Indicator (kudos LazyBear).
Lastly, just remember indicators indicate; they are not magic. :)
SpreadEagle71

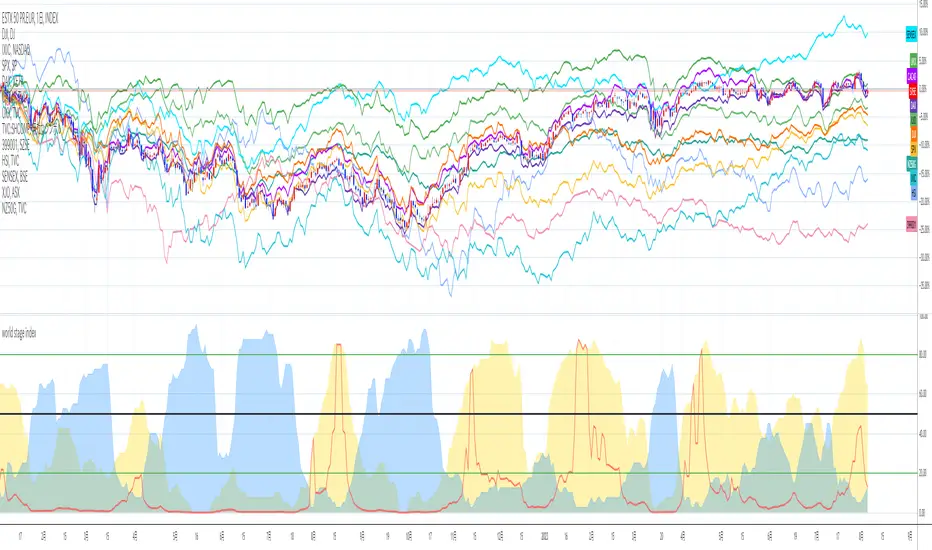
world stage index ver02This is an indicator that expresses the ratio of "stage1" and "stage4" of world index.
40 symbols are as follows
("TVC:SHCOMP" is revised to "SSE:000001")
(JAPAN, US, EUROPE, and CANADA)
OSE:NK2251!, DJ:DJI , NASDAQ:IXIC, SP:SPX , XETR:DAX, TVC:CAC40 , TVC:UKX, TSX:TSX
(ASIA)
SSE:000001, SZSE:399001, TVC:HSI, TWSE:TAIEX, BSE:SENSEX , OANDA:SG30SGD, INDEX:KSI, SET:SET
(EUROPE)
INDEX:SX5E, INDEX:FTSEMIB, SIX:SMI , BME:IBC, EURONEXT:BEL20, TVC:AEX, OMXCOP:OMXC25, XETR:0Q5X
(Pacific Ocean)
ASX:XJO, TVC:NZ50G, IDX:COMPOSITE, FTSEMYX:FBMKLCI, BMFBOVESPA:IBOV, BMV:ME , BVL:SPBLPGPT, BYMA:IMV
(Eastern Europe & Middle East)
MOEX:IMOEX, GPW:WIG20, OMXHEX:OMXH25, OMXSTO:OMXS30, DFM:DFMGI, TADAWUL:TASI, OSE:GNRI, EGX:EGX30
The criteria are as follows:
EMA5≧EMA20≧EMA40 : Stage1
EMA5≦EMA20≦EMA40 : Stage4
A.The sum of Stage1 was multiplied by 2.5 and drawn on a scale of 0 to 100, with yellow area
B.The Sum of Stage4 was multiplied by 2.5 and drawn on a scale of 0 to 100, with blue area.
C. The ratio of A/B was multiplied by 2.5 and drawn on a scale of 0 to 100, with red lines.
This idea is from Kojirou Kousi.
40 symbols of this script are partially different from Kojiro kousi's idea.
But he said the difference isn't matter.
tradingview社の上海総合指数の銘柄コード変更に合わせて、"TVC:SHCOMP" を "SSE:000001"に改訂しました。
「小次郎講師指数」に着想を得た、世界40カ国の株価指数stage状態です。
参考文献は、小次郎講師著書「世界一わかりやすい投資の勝ち方」です。
小次郎講師とは一部異なるシンボルを採用していますが、
多少の違いは余り大した問題では無いと御本人から教わった事があります。
先進国に関してはおそらくほとんど同じだと思います。
stage1の合計の%を黄色、stage4の合計の%を青色、stage1の合計/stage4の合計の%を赤で表示しています。
雰囲気で分かればいいので、正確な数字までは表示しませんでした。
個人的には現状分析以外にも、プラクティス時に世界情勢を把握するのに重宝しています。
Volatility Adapted Relative StrengthVARS uses a stock's ALPHA in comparison to the SPX to determine whether there is RS on an volatility adjusted basis.
SPXL Futures Strategy- Buy/sell signals for SPXL using futures momentum.
- For real-time signals at close, use ES1! on 2 minute chart and sign up for real-time cboe mini futures data feed in tradingview.
- All buys and sells are at near close of US RTH market at 4pm.
- Best to use the script with other breadth signals to decide on trading strategy.
- Script is compatible with SPY, SPXL, RSP, QQQ, TQQQ and many other SPX correlated tickers, however it’s primarily developed for SPX.

Relative Strength with S&P500Relative Strength (RS) - S&P500
Relative Strength with compare to SPX - US S&P 500. This indicator shows Strength compare to SPX.

VolatilityDivergenceRedGreen by STTAName: VolatilityDivergenceRedGreen by STTA
- Underlying and implied volatiliy normally show negative correlated behavior (price rises, vola falls and vice versa)
- This study shows symbols in on candles in chart where Undelying and corresponding vola index show same bahvior for 1,2 or 3 consecutive bars. (price rises and vola rises and vice versa)
- This situation is called Vola Divergence. Red, when prices and vola fall; green, when price and vola rise
- This information can be used to detect possible end of Up/Down-Swings.
- User can configure if rising or falling or both price movements shall be displayed.
- This study can be used with root symbols, which provide corresponding volatility indices.
- supported Root Symbols: SPX, NDQ, DJI, RUT, CL, XLE, GC, SI, EUR, HSI, FXI, EWZ, AMZN, AAPL, GS, GOOG, IBM, DEU40
- in all other symbols, no symbols are displayed.
Inputs
- underlying displayed in chart
Settings/Parameter
- each Divergence can be switched off/on separately
- output of each displayed symbol can be configured
Outputs
- RedDiv1: first bar with rising price and rising volatility index
- GreenDiv1: first bar with falling price and falling volatility index
- RedDiv2: second bar in a row with rising price and rising volatility index
- GreenDiv2: second bar with falling price and falling volatility index
- RedDiv3: third bar in a row with rising price and rising volatility index
- GreenDiv3: third bar in a row with falling price and falling volatility index
