A+ Trade CheckList with Comprehensive Relative StrengthThe indicator designed for traders who need real-time market assessment across multiple timeframes and benchmarks. This comprehensive tool combines traditional technical analysis with sophisticated relative strength measurements to provide a complete market picture in one convenient table display.
The indicator tracks essential trading levels including:
QQQ and SPY trend analysis using exponential moving averages
Previous day and week high/low levels for key support and resistance
Market open levels from the first 5 and 15 minutes of trading (9:30 AM ET)
VWAP positioning for institutional price reference
Short-term EMA positioning for momentum assessment
Advanced Relative Strength Analysis
The standout feature of this indicator is its comprehensive 8-metric relative strength scoring system that compares your current ticker against both QQQ (Nasdaq-100) and SPY (S&P 500) benchmarks.
The 4-Metric Relative Strength System Explained
Metric 1: Relative Strength Ratio (RSR)
Purpose: Measures whether your ticker is outperforming or underperforming relative to its historical relationship with the benchmarks.
How it works:
Calculates the ratio of your ticker's price to QQQ/SPY prices
Compares current ratio to a 20-period moving average of the ratio
Scores +1 if ratio is above average (relative strength), -1 if below (relative weakness)
Trading significance: Identifies when a stock is breaking out of its normal correlation pattern with major indices.
Metric 2: Percentage-Based Relative Performance
Purpose: Compares short-term percentage changes to identify immediate relative momentum.
How it works:
Calculates 5-day percentage change for your ticker and benchmarks
Subtracts benchmark performance from ticker performance
Scores +1 if outperforming by >1%, -1 if underperforming by >1%, 0 for neutral
Trading significance: Captures recent momentum shifts and identifies stocks moving independently of market direction.
Metric 3: Beta-Adjusted Relative Strength (Alpha)
Purpose: Measures risk-adjusted performance by accounting for the ticker's natural volatility relationship with benchmarks.
How it works:
Calculates rolling beta (correlation and variance relationship)
Determines expected returns based on benchmark moves and beta
Measures alpha (excess returns above/below expectations)
Scores based on whether alpha is consistently positive or negative
Trading significance: Identifies stocks generating returns beyond what their risk profile would suggest, indicating fundamental strength or weakness.
Metric 4: Volume-Weighted Relative Strength
Purpose: Incorporates volume analysis to validate price-based relative strength signals.
How it works:
Compares VWAP-based percentage changes between ticker and benchmarks
Applies volume weighting factor based on relative volume strength
Enhances score when high relative volume confirms price movements
Trading significance: Distinguishes between genuine institutional-driven moves and low-volume price action that may not sustain.
Combined Scoring System
The indicator generates 8 individual scores (4 metrics × 2 benchmarks) that combine into a single strength assessment:
Score Interpretation
Strong (4-8 points): Ticker significantly outperforming both benchmarks across multiple methodologies
Moderate Strong (1-3 points): Ticker showing good relative strength with some mixed signals
Neutral (0 points): Balanced performance relative to benchmarks
Moderate Weak (-1 to -3 points): Ticker showing relative weakness with some mixed signals
Weak (-4 to -8 points): Ticker significantly underperforming both benchmarks
Display Format
The indicator shows results as: "Strong (6/8)" indicating the ticker scored 6 out of 8 possible points.
Cari dalam skrip untuk "spy"

Capitulation Volume Detector by @RhinoTradezOverview
Hey traders, want to catch the market when it’s totally losing it? The Capitulation Volume Detector is your go-to buddy for spotting those wild moments when panic selling takes over. Picture this: prices plummet, volume explodes, and everyone’s bailing out—that’s capitulation, and it might just signal a turning point. This script throws a bright marker on your chart whenever the chaos hits, so you can decide if it’s time to jump in or sit tight. Built fresh in Pine Script v6, it’s sleek, customizable, and packs an alert to keep you posted—perfect for stocks, indices like SPY, or even crypto chaos.
Inspired by epic sell-offs like March 2020’s COVID crash, this tool’s here to help you navigate the storm with a smile (and maybe a profit).
What It Does
Capitulation volume is that “everyone’s out!” moment: a steep price drop meets a massive volume surge, hinting that sellers are tapped out. It’s not a guaranteed reversal—sometimes the bleeding continues—but it’s a loud clue that fear’s peaked. Here’s the magic:
Volume Check : Measures current volume against a customizable average (default: 20 bars).
Price Plunge : Tracks the percentage drop from the last close.
Capitulation Cal l: When volume rockets past your threshold (e.g., 2x average) and price tanks (e.g., -5%), you get a red triangle above the bar.
Stay Alert : Fires off a detailed message (e.g., “Volume 300M > 200M, Drop -10%”) so you’re never caught off guard.
Think of it as your market meltdown radar—simple, effective, and ready to roll.
Functionality Breakdown
Volume Surge Spotter :
Uses a 20-bar Simple Moving Average (SMA) of volume as your baseline.
Flags any bar where volume exceeds this average by your chosen multiplier (default: 2x).
Price Drop Detector :
Calculates the percentage change from the prior close.
Triggers when the drop’s bigger than your set limit (default: -5%).
Capitulation Marker:
Combines both signals: high volume + sharp drop = capitulation.
Slaps a red triangle above the bar for instant “whoa, there it is!” vibes.
Real-Time Alerts :
Sends a custom alert with volume and drop details, keeping you in the loop without babysitting the chart.
Customization Options
Tune it to your trading style with these easy settings:
Volume Multiplier (x Avg): Starts at 2.0 (2x average volume). Bump it to 3.0 for only the wildest spikes or dial it to 1.5 for more frequent catches. Range: 1.0-10.0, step 0.1.
Price Drop Threshold (%): Default 5.0 (a -5% drop). Go big with 10.0 for crash-level falls or ease to 3.0 for lighter dips. Range: 1.0-20.0, step 0.1.
Average Volume Period: Default 20 bars. Stretch it to 50 for a broader view or shrink to 10 for quick reactions. Range: 1-100.
Capitulation Marker Color: Red by default—because panic’s loud! Switch it to blue, green, or pink to match your chart’s personality.
How to Use It
Drop It On : Add it to any chart with volume data—SPY daily for market moves, /ES 15-minute for intraday action, or your go-to stock.
Play with Settings : Hit the indicator’s config gear and tweak the multiplier, drop threshold, period, or marker color to fit your vibe.
Set an Alert : Right-click the indicator, add an alert with “Any alert() function call,” and get pinged when capitulation strikes.
Watch the Action : Look for those red triangles on big drop days—pair with your favorite reversal signals for extra oomph.
Pro Tips
Daily Charts : Catch market-wide capitulations like March 23, 2020 (SPY: -10%, 3x volume).
Intraday : Spot flash crashes or sector sell-offs on 15-minute or 5-minute bars.
Context Matters : High volume alone isn’t enough—check the VIX or candlestick patterns (e.g., hammers) to confirm a bottom.

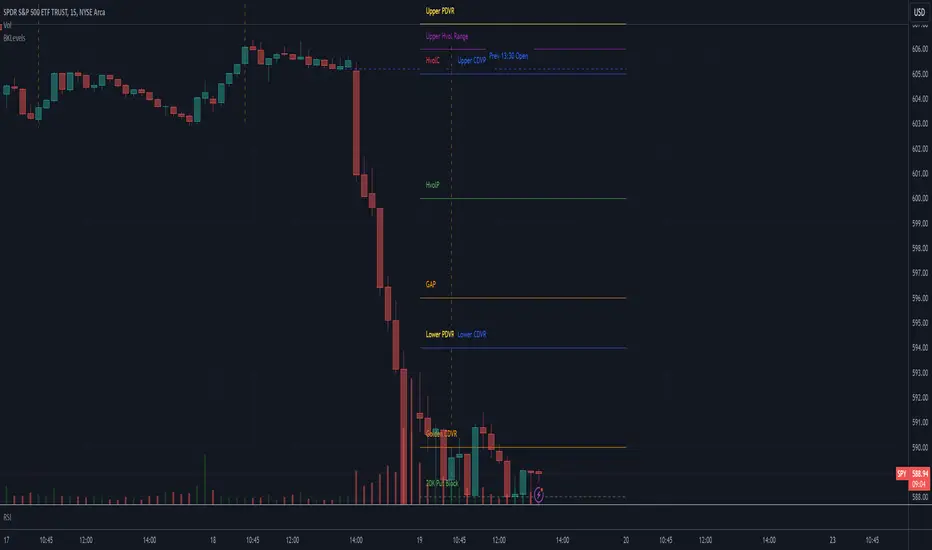
BKLevelsThis displays levels from a text input, levels from certain times on the previous day, and high/low/close from previous day. The levels are drawn for the date in the first line of the text input. Newlines are required between each level
Example text input:
2024-12-17
SPY,606,5,1,Lower Hvol Range,FIRM
SPY,611,1,1,Last 20K CBlock,FIRM
SPY,600,2,1,Last 20K PBlock,FIRM
SPX,6085,1,1,HvolC,FIRM
SPX,6080,2,1,HvolP,FIRM
SPX,6095,3,1,Upper PDVR,FIRM
SPX,6060,3,1,Lower PDVR,FIRM
For each line, the format is ,,,,,
For color, there are 9 possible user- configurable colors- so you can input numbers 1 through 9
For line style, the possible inputs are:
"FIRM" -> solid line
"SHORT_DASH" -> dotted line
"MEDIUM_DASH" -> dashed line
"LONG_DASH" -> dashed line
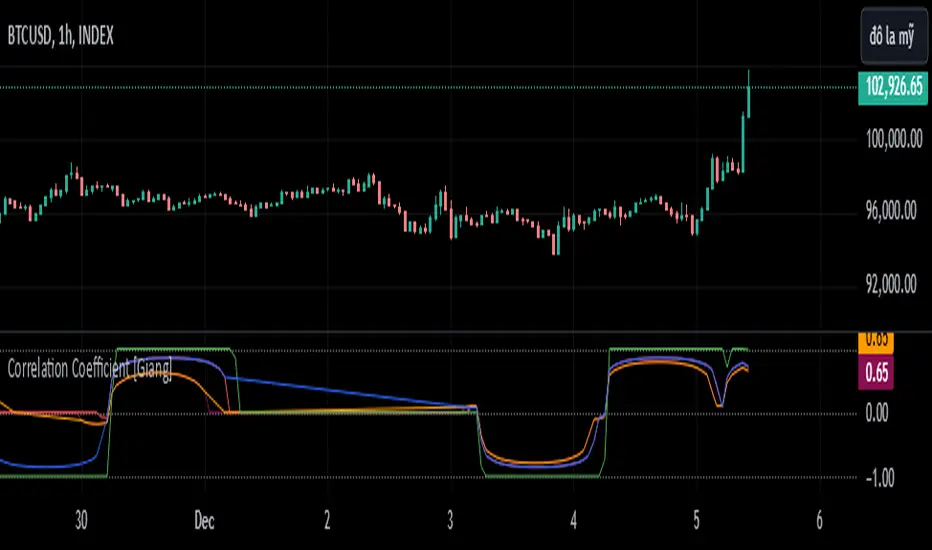
Correlation Coefficient [Giang]### **Introduction to the "Correlation Coefficient" Indicator**
#### **Idea behind the Indicator**
The "Correlation Coefficient" indicator was developed to analyze the linear relationship between Bitcoin (**BTCUSD**) and other important economic indices or financial assets, such as:
- **SPX** (S&P 500 Index): Represents the U.S. stock market.
- **DXY** (Dollar Index): Reflects the strength of the USD against major currencies.
- **SPY** (ETF representing the S&P 500): A popular trading instrument.
- **GOLD** (Gold price): A traditional safe-haven asset.
The correlation between these assets can help traders understand how Bitcoin reacts to market movements of traditional financial instruments, providing opportunities for more effective trading decisions.
Additionally, the indicator allows users to **customize asset symbols for comparison**, not limited to the default indices (SPX, DXY, SPY, GOLD). This flexibility enables traders to tailor their analysis to specific goals and portfolios.
---
#### **Significance and Use of Correlation in Trading**
**Correlation** is a measure of the linear relationship between two data series. In the context of this indicator:
- **The correlation coefficient ranges from -1 to 1**:
- **1**: Perfect positive relationship (both increase or decrease together).
- **0**: No linear relationship.
- **-1**: Perfect negative relationship (one increases while the other decreases).
- **Use in trading**:
- Identify **strong relationships or unusual divergences** between Bitcoin and other assets.
- Help determine **market sentiment**: For example, if Bitcoin has a negative correlation with DXY, traders might expect Bitcoin to rise when the USD weakens.
- Provide a foundation for hedging strategies or investments based on inter-asset relationships.
---
#### **Components of the Indicator**
The "Correlation Coefficient" indicator consists of the following key components:
1. **Main Data (BTCUSD)**:
- The closing price of Bitcoin is used as the central asset for calculations.
2. **Comparison Data**:
- Users can select different asset symbols for comparison. By default, the indicator supports:
- **SPX**: Stock market index.
- **DXY**: Dollar Index.
- **SPY**: Popular ETF.
- **GOLD**: Gold price.
3. **Correlation Coefficients**:
- Calculated between BTC and each comparison index, based on a Weighted Moving Average (WMA) over a user-defined period.
4. **Graphical Representation**:
- Displays individual correlation coefficients with each comparison index, making it easier for traders to track and analyze.
---
#### **How to Analyze and Use the Indicator**
**1. Identify Key Correlations:**
- Observe the correlation lines between BTC and the indices to determine positive or negative relationships.
- Example:
- If the **Correlation Coefficient (BTC-DXY)** sharply declines to -1, this indicates that when USD strengthens, Bitcoin tends to weaken.
**2. Analyze the Strength of Correlations:**
- **Strong Correlations**: If the coefficient is close to 1 or -1, the relationship between the two assets is very clear.
- **Weak Correlations**: If the coefficient is near 0, Bitcoin may be influenced by other factors outside the compared index.
**3. Develop Trading Strategies:**
- Use correlations to predict Bitcoin's price movements:
- If BTC has an inverse relationship with **DXY**, traders might consider selling BTC when the USD strengthens.
- If BTC and **SPX** are strongly correlated, traders can monitor the stock market to predict Bitcoin's trend.
**4. Evaluate Changes Over Time:**
- Use different timeframes (daily, weekly) to track the correlation's fluctuations.
- Look for unusual signals, such as a breakdown or shift from positive to negative relationships.
---
#### **Conclusion**
The "Correlation Coefficient" indicator is a powerful tool that helps traders analyze the relationship between Bitcoin and major financial indices. The ability to customize asset symbols for comparison makes the indicator flexible and suitable for various trading strategies. When used correctly, this indicator not only provides insights into market sentiment but also supports the development of intelligent trading strategies and optimized profits.
Daily MAs on Intraday ChartsThis is a very simple, yet powerful indicator, for intraday and swing traders.
The indicator plots price levels of key daily moving averages as horizontal lines onto intraday charts.
The key daily moving averages being:
5-day EMA
10-day EMA
21-day EMA
50-day SMA
100-day SMA
200-day SMA
The moving averages above can be toggled on and off to the users liking and different colours selected to show the locations of daily moving average price levels on intraday charts.
Below is a chart of the SPY on the 30-minute timeframe. The black line represents the price level of the SPY's 10-day EMA, and the blue line represents the price level of the SPY's 21-day EMA.
Key daily moving averages like those mentioned above can be areas of support or resistance for major indexes, ETFs, and individual stocks. Therefore, when using multiple timeframe analysis combining daily charts and intraday charts, it's useful to be aware of these key daily moving average levels for potential reversals.
This indicator clearly shows where the key daily moving average price levels are on intraday charts for the chosen ticker symbol, thus helping traders to identify potential points of interest for trading ideas - i.e., going long or pullbacks into key daily moving averages, or short on rallies into key daily moving averages subject to the trader's thoughts at the time.
By using the 'Daily MAs on Intraday Charts' the trader can now have a multi-chart layout and be easily aware of key price levels from daily moving averages when looking at various intraday timeframe charts such as the 1-minute, 5-minute, 15-minute, 30-minute, 1-hour etc. This can be essential information for opening long and short trading ideas.

Trade Entry Detector, Wick to Body Ratio Trade Entry Detector: Wick-to-Body Ratio Strategy with Bollinger Bands
Overview
The Trade Entry Detector is a custom strategy for TradingView that leverages the Bollinger Bands and a unique wick-to-body ratio approach to capture precise entry opportunities. This indicator is designed for traders who want to pinpoint high-probability reversal points when price interacts with Bollinger Bands, all while offering flexible entry fill options.
The strategy performs primary analysis on the daily time frame, regardless of your current chart setting, allowing you to view daily Bollinger Band levels and entry signals even on lower time frames. This approach is suitable for swing traders and short-term traders looking to align intraday moves with higher time frame signals.
How the Strategy Works
1. Bollinger Band Analysis on the Daily Time Frame
Bollinger Bands are calculated using a 20-period simple moving average (SMA) and a standard deviation multiplier (default is 2). These bands dynamically expand and contract based on market volatility, making them ideal for identifying overbought and oversold conditions:
* Upper Band: Indicates potential overbought levels.
* Lower Band: Indicates potential oversold levels.
2. Wick-to-Body Ratio Condition
This strategy places significant emphasis on candle wicks relative to the candle body. Here’s why:
* A large upper wick relative to the body signals potential selling pressure after testing the upper Bollinger Band.
* A large lower wick relative to the body indicates buying support after testing the lower Bollinger Band.
* Ratio Threshold: You can set a minimum wick-to-body ratio (default is 1.0), meaning that the wick must be at least equal in size to the body. This ensures only candles with significant reversals are considered for entry.
3. Flexible Entry Timing
To adapt to various trading styles, the indicator allows you to choose the entry fill timing:
* Daily Close: Enter at the close of the daily candle.
* Daily Open: Enter at the open of the following daily candle.
* HOD (High of Day): Set entry at the daily high, for those who want confirmation of upward momentum.
* LOD (Low of Day): Set entry at the daily low, ideal for confirming downward movement.
4. Position Sizing and Risk Management
The strategy calculates position size based on a fixed risk percentage of your account balance (default is 1%). This approach dynamically adjusts position sizes based on stop-loss distance:
* Stop Loss: Placed at the nearest swing high (for shorts) or swing low (for longs).
* Take Profit: Exits are triggered when the price reaches the opposite Bollinger Band.
5. Order Expiration
Each pending order (long or short) expires after two days if unfilled, allowing for new setups on subsequent candles if conditions are met again.
Using the Trade Entry Detector
Step-by-Step Guide
1. Set the Primary Time Frame
The core calculations run on the daily time frame, but the strategy can be applied to intraday charts (e.g., 65-minute or 15-minute) for deeper insights.
2. Adjust Bollinger Band Settings
* Length: Default is 20, which determines the period for calculating the moving average.
* Standard Deviation Multiplier: Default is 2.0, which sets the width of the bands. Adjusting this can help you capture broader or tighter volatility ranges.
3. Define the Wick-to-Body Ratio
Set the minimum ratio between wick and body (default 1.0). Higher values filter out candles with less wick-to-body contrast, focusing on stronger rejection moves.
4. Choose Entry Fill Timing
Select your preferred fill condition:
* Daily Close: Confirms the trade at the end of the daily session.
* Daily Open: Executes the entry at the open of the next day.
* HOD/LOD: Uses the daily high or low as an additional confirmation for upward or downward moves.
5. Position Sizing and Risk Management
* Set your account balance and risk percentage. The strategy automatically calculates position sizes based on the stop distance to manage risk efficiently.
* Stop Loss and Take Profit points are automatically set based on swing highs/lows and opposing Bollinger Bands, respectively.
Practical Example
Let’s say SPY (S&P 500 ETF) tests the lower Bollinger Band on the daily time frame, with a lower wick that is twice the size of the body (meeting the 1.0 ratio threshold). Here’s how the strategy might proceed:
1. Signal: The lower wick on SPY suggests buying interest at the lower Bollinger Band.
2. Entry Fill Timing: If you’ve selected "Daily Open," the entry order will be placed at the next day's open price.
3. Stop Loss: Positioned at the nearest daily swing low to minimize risk.
4. Take Profit: If SPY price moves up and reaches the upper Bollinger Band, the position is automatically closed.
Indicator Features and Benefits
* Multi-Time Frame Compatibility: Perform daily analysis while tracking signals on any intraday chart.
* Automatic Position Sizing: Tailor risk per trade based on account balance and desired risk percentage.
* Flexible Entry Options: Choose from close, open, HOD, or LOD for optimal timing.
* Effective Trend Reversal Identification: Uses wick-to-body ratio and Bollinger Band interaction to pinpoint potential reversals.
* Dynamic Visualization: Bollinger Bands are displayed on your chosen time frame, allowing seamless intraday tracking.
Summary
The Trade Entry Detector provides a unique, data-driven way to spot reversal points with customizable entry options. By combining Bollinger Bands with wick-to-body ratio conditions, it identifies potential trade setups where price has tested extremes and shown reversal signals. With its flexible entry timing, risk management features, and multi-time frame compatibility, this indicator is ideal for traders looking to blend daily market context with shorter-term execution.
Tips for Usage:
* For swing trading, consider the Daily Open or Close entry options.
* For momentum entries, HOD or LOD may offer better alignment with the direction of the wick.
* Backtest on different assets to find optimal Bollinger Band and wick-to-body settings for your market.
Use this indicator to enhance your understanding of price behavior at key levels and improve the precision of your entry points. Happy trading!

Simultaneous INSIDE Bar Break IndicatorSimultaneous Inside Bar Break Indicator (SIBBI) for The Strat Community
Overview:
The Simultaneous Inside Bar Break Indicator (SIBBI) is designed to help traders using The Strat methodology identify one of the most powerful breakout patterns: the Simultaneous Inside Bar Break across multiple symbols. This indicator detects when all four user-selected symbols form inside bars on the previous candle and then break those inside bars in the same direction (either bullish or bearish) on the current candle.
Inside bars represent consolidation periods where price action does not break the high or low of the previous candle. When a simultaneous break occurs across multiple symbols, this often signals a strong move in the market, making this a key actionable signal in The Strat trading strategy.
Key Features:
Multi-Symbol Analysis: You can track up to four different symbols simultaneously. By default, the indicator comes with SPY, QQQ, IWM, and DIA, but you can modify these to track any other assets or symbols.
Inside Bar Detection: The indicator checks whether all four symbols have inside bars on the previous candle. It only triggers when all symbols meet this condition, making it a highly specific and reliable signal.
Simultaneous Break Detection: Once all symbols have inside bars, the indicator waits for a breakout in the same direction across all four symbols. A simultaneous bullish break (prices breaking above the previous candle’s high) triggers a green label, while a simultaneous bearish break (prices breaking below the previous candle’s low) triggers a red label.
Dynamic Label Timeframe: The indicator dynamically adjusts the timeframe in the label based on the user’s selected timeframe. This allows traders to know precisely which timeframe the break is occurring on. If the user selects "Chart Timeframe," the indicator will evolve with the current chart's timeframe, making it more versatile.
Timeframe Flexibility: The indicator can be set to analyze any timeframe—15-minute, 30-minute, 60-minute, daily, weekly, and so on. It only works for the specific timeframe you set it to in the settings. If set to "Chart Timeframe," the label will adapt dynamically based on the timeframe you are currently viewing.
Customizable Labels: The user can choose the size of the labels (tiny, small, or normal), ensuring that the visual output is tailored to individual preferences and chart layouts.
Best Use Case:
The Simultaneous Inside Bar Break Indicator is particularly powerful when applied to multiple timeframes. Here’s how to use it for maximum impact:
Multi-Timeframe Setup: Set the indicator on various timeframes (e.g., 15-minute, 30-minute, 60-minute, and daily) across multiple charts. This allows you to monitor different timeframes and identify when lower timeframe breaks trigger potential moves on higher timeframes.
Anticipating Strong Moves: When a simultaneous inside bar break occurs on one timeframe (e.g., 30-minute), keep an eye on the higher timeframes (e.g., 60-minute or daily) to see if those timeframes also break. This stacking of inside bar breaks can signal powerful market moves.
Higher Conviction Signals: The indicator is designed to provide high-conviction signals. Since it requires all four symbols to break in the same direction simultaneously, it reduces false signals and focuses on higher probability setups, which is crucial for traders using The Strat to time their trades effectively.
How the Indicator Works:
Inside Bar Formation: The indicator first checks that all four selected symbols had inside bars in the previous bar (i.e., the current high and low are contained within the previous bar’s high and low).
Simultaneous Break Detection: After detecting inside bars, the indicator checks if all four symbols break out in the same direction—bullish (breaking above the previous bar’s high) or bearish (breaking below the previous bar’s low).
Label Display: When a simultaneous inside bar break occurs, a label is plotted on the chart—either green for a bullish break (below the candle) or red for a bearish break (above the candle). The label will display the timeframe you set in the settings (e.g., "IBSB 60" for a 60-minute break).
Chart Timeframe Option: If you prefer, you can set the indicator to evolve with the chart’s current timeframe. In this mode, the label will not show a specific timeframe but will still display the simultaneous inside bar break when it occurs.
Recommendations for Usage:
Focus on Multiple Timeframes: The Strat methodology is all about understanding the relationship between different timeframes. Use this indicator on multiple timeframes to get a better picture of potential moves.
Pair with Other Strat Techniques: This indicator is most powerful when combined with other Strat tools, such as broadening formations, timeframe continuity, and actionable signals (e.g., 2-2 reversals). The simultaneous inside bar break can help confirm or invalidate other signals.
Customize Symbols and Timeframes: Although the default symbols are SPY, QQQ, IWM, and DIA, feel free to replace them with symbols more relevant to your trading. This indicator works well across equities, indices, futures, and forex pairs.
How to Set It Up:
Select Symbols: Choose four symbols that you want to track. These can be index ETFs (like SPY and QQQ), individual stocks, or any other tradable instruments.
Set Timeframe: In the indicator’s settings, choose a specific timeframe (e.g., 15-minute, 30-minute, daily). The label will reflect the selected timeframe, making it clear which time-based break you are seeing.
Optional - Chart Timeframe Mode: If you want the indicator to adapt to the chart’s current timeframe, select the "Chart Timeframe" option in the settings. The indicator will plot the breaks without showing a specific timeframe in the label.
Customize Label Size: Depending on your chart layout and personal preference, you can adjust the size of the labels (tiny, small, or normal) in the settings.
Conclusion:
The Simultaneous Inside Bar Break Indicator is a powerful tool for traders using The Strat methodology, offering a highly specific and reliable signal that can indicate potential large market moves. By monitoring multiple symbols and timeframes, you can gain deeper insight into the market's behavior and act with greater confidence. This indicator is ideal for traders looking to catch high-conviction moves and align their trades with broader market continuity.
Note: The indicator works best when paired with multi-timeframe analysis, allowing you to see how breaks on lower timeframes might influence larger trends. For traders who prefer simplicity, setting it to the "Chart Timeframe" mode offers flexibility while maintaining the core benefits of this indicator.

TASC 2024.06 REIT ETF Trading System█ OVERVIEW
This strategy script demonstrates the application of the Real Estate Investment Trust (REIT) ETF trading system presented in the article by Markos Katsanos titled "Is The Price REIT?" from TASC's June 2024 edition of Traders' Tips .
█ CONCEPTS
REIT stocks and ETFs offer a simplified, diversified approach to real estate investment. They exhibit sensitivity to interest rates, often moving inversely to interest rate and treasury yield changes. Markos Katsanos explores this relationship and the correlation of prices with the broader market to develop a trading strategy for REIT ETFs.
The script employs Bollinger Bands and Donchian channel indicators to identify oversold conditions and trends in REIT ETFs. It incorporates the 10-year treasury yield index (TNX) as a proxy for interest rates and the S&P 500 ETF (SPY) as a benchmark for the overall market. The system filters trade entries based on their behavior and correlation with the REIT ETF price.
█ CALCULATIONS
The strategy initiates long entries (buy signals) under two conditions:
1. Oversold condition
The weekly ETF low price dips below the 15-week Bollinger Band bottom, the closing price is above the value by at least 0.2 * ATR ( Average True Range ), and the price exceeds the week's median.
Either of the following:
– The TNX index is down over 15% from its 25-week high, and its correlation with the ETF price is less than 0.3.
– The yield is below 2%.
2. Uptrend
The weekly ETF price crosses above the previous week's 30-week Donchian channel high.
The SPY ETF is above its 20-week moving average.
Either of the following:
– Over ten weeks have passed since the TNX index was at its 30-week high.
– The correlation between the TNX value and the ETF price exceeds 0.3.
– The yield is below 2%.
The strategy also includes three exit (sell) rules:
1. Trailing (Chandelier) stop
The weekly close drops below the highest close over the last five weeks by over 1.5 * ATR.
The TNX value rises over the latest 25 weeks, with a yield exceeding 4%, or its value surges over 15% above the 25-week low.
2. Stop-loss
The ETF's price declines by at least 8% of the previous week's close and falls below the 30-week moving average.
The SPY price is down by at least 8%, or its correlation with the ETF's price is negative.
3. Overbought condition
The ETF's value rises above the 100-week low by over 50%.
The ETF's price falls over 1.5 * ATR below the 3-week high.
The ETF's 10-week Stochastic indicator exceeds 90 within the last three weeks.
█ DISCLAIMER
This strategy script educates users on the system outlined by the TASC article. However, note that its default properties might not fully represent real-world trading conditions for an individual. By default, it uses 10% of equity as the order size and a slippage amount of 5 ticks. Traders should adjust these settings and the commission amount when using this script. Additionally, since this strategy utilizes compound conditions on weekly data to trigger orders, it will generate significantly fewer trades than other, higher-frequency strategies.

Leveraged Share Decay Tracker [SS]Releasing this utility tool for leveraged share traders and investors.
It is very difficult to track the amount of decay and efficiency that is associated with leveraged shares and since not all leveraged shares are created equally, I developed this tool to help investors/traders ascertain:
1. The general risk, in $$, per share associated with investing in a particular leveraged ETF
2. The ability of a leveraged share to match what it purports to do (i.e. if it is a 3X Bull share, is it actually returning consistently 3X the underlying or is there a large variance?)
3. The general decay at various timepoints expressed in $$$
How to use:
You need to be opened on the chart of the underlying. In the example above, the chart is on DIA, the leveraged share being tracked is UDOW (3X bull share of the DOW).
Once you are on the chart of the underlying, you then put in the leveraged share of interest. The indicator will perform two major assessments:
1. An analysis of the standard error between the underlying and the leveraged share. This is accomplished through linear regression, but instead of creating a linreg equation, it simply uses the results to ascertain the degree of error associated at various time points (the time points are 10, 20, 30, 40, 50, 100, 252).
2. An analysis of the variance of returns. The indicator requires you to put in the leverage amount. So if the leverage amount is 3% (i.e. SPXL or UPRO is 3 X SPY), be sure that you are putting that factor in the settings. It will then modify the underlying to match the leverage amount, and perform an assessment of variance over 10, 20, 30, 40, 50, 100, 252 days to ensure stability. This will verify whether the leveraged ETF is actually consistently performing how it purports to perform.
Here are some examples, and some tales of caution so you can see, for yourself, how not all leveraged shares are created equal.
SPY and SPXL:
SPY and UPRO:
XBI and LABU (3 x bull share):
XBI and LABD (3 x bear share):
SOX and SOXL:
AAPL and AAPU:
It is VERY pivotal you remember to check and adjust the Leveraged % factor.
For example, AAPU is leveraged 1.5%. You can see above it tracks this well. However, if you accidently leave it at 3%, you will get an erroneous result:
You can also see how some can fail to track the quoted leveraged amount, but still produce relatively lower risk decay.
And, as a final example, let's take a look at the worst leveraged share of life, BOIL:
Trainwreck that one. Stay far away from it!
The chart:
The chart will show you the drift (money value over time) and the variance (% variance between the expected and actual returns) over time. From here, you can ascertain the general length you feel comfortable holding a leveraged share. In general, for most stable shares, <= 50 trading days tends to be the sweet spot, but always check the chart.
There are also options to plot the variances and the drifts so you can see them visually.
And that is the indicator! Kind of boring, but there are absolutely 0 resources out there for doing this job, so hopefully you see the use for it!
Safe trades everyone!

SMA Cross with a Price FilterA moving average strategy generates an entry (buy) signal when the price goes above the moving average, and an exit (sell) signal when the price goes below the moving average. But it gives lots of whipsaws and noise depends on the moving average we use. A fast moving average gives more whipsaws and a slow moving average gives less whipsaws. To reduce the noise/whipsaws, we can add a filter on a fast/slow moving average. It will improve entry/exit performance significantly specially for those who don't want to watch the market actively.
I created this indicator with a price filter. This means the price of an underlying asset must be at least a specific percentage above its moving average to generate a buy signal and a specific percentage below its moving average to generate a sell signal. This price filter can also be a confirmation after the price crosses above/below its SMA. I couldn't find any indicator yet based on this idea. So I wrote this indicator and publishing it so it helps those who are interested.
I use 200 SMA and 3% price filter as default and using SPY as an example. So,
ENTRY signal when the closing price of SPY is 3% above its 200 SMA.
EXIT signal when the closing price of SPY is 3% below its 200 SMA.
Enjoy and let me know if it works.
** This chart only generates entry (buy) and exit (sell) signals. Please, do your own diligence to make any investment or trading decisions.

Spot-Vol CorrelationSpot-Vol Correlation Script Guide
Purpose:
This TradingView script measures the correlation between percentage changes in the spot price (e.g., for SPY, an ETF that tracks the S&P 500 index) and the changes in volatility (e.g., as indicated by the VIX, the Volatility Index). Its primary objective is to discern whether the relationship between spot price and volatility behaves as expected ("normal" condition) or diverges from the expected pattern ("abnormal" condition).
Normal vs. Abnormal Correlation:
Normal Correlation: Historically, the VIX (or volatility) and the spot price of major indices like the S&P 500 have an inverse relationship. When the spot price of the index goes up, the VIX tends to go down, indicating lower volatility. Conversely, when the index drops, the VIX generally rises, signaling increased volatility.
Abnormal Correlation: There are instances when this inverse relationship doesn't hold, and both the spot price and the VIX move in the same direction. This is considered an "abnormal" condition and might indicate unusual market dynamics, potential uncertainty, or impending shifts in market sentiment.
Using the Script:
Inputs:
First Symbol: This is set by default to VIX, representing volatility. However, users can input any other volatility metric they prefer.
Second Symbol: This is set to SPY by default, representing the spot price of the S&P 500 index. Like the first symbol, users can substitute SPY with any other asset or index of their choice.
Length of Calculation Period: Users can define the lookback period for the correlation calculation. By default, it's set to 10 periods (e.g., days for a daily chart).
Upper & Lower Bounds of Normal Zone: These parameters define the range of correlation values that are considered "normal" or expected. By default, this is set between -0.60 and -1.00.
Visuals:
Correlation Line: The main line plot shows the correlation coefficient between the two input symbols. When this line is within the "normal zone", it indicates that the spot price and volatility are inversely correlated. If it's outside this zone, the correlation is considered "abnormal".
Green Color: Indicates a period when the spot price and VIX are behaving as traditionally expected (i.e., one rises while the other falls).
Red Color: Denotes a period when the spot price and VIX are both moving in the same direction, which is an abnormal condition.
Shaded Area (Normal Zone): The area between the user-defined upper and lower bounds is shaded in green, highlighting the range of "normal" correlation values.
Interpretation:
Monitor the color and position of the correlation line relative to the shaded area:
If the line is green and within the shaded area, the market dynamics are as traditionally expected.
If the line is red or outside the shaded area, users should exercise caution as this indicates a divergence from typical behavior, which can precede significant market moves or heightened uncertainty.

Statistical Package for the Trading Sciences [SS]
This is SPTS.
It stands for Statistical Package for the Trading Sciences.
Its a play on SPSS (Statistical Package for the Social Sciences) by IBM (software that, prior to Pinescript, I would use on a daily basis for trading).
Let's preface this indicator first:
This isn't so much an indicator as it is a project. A passion project really.
This has been in the works for months and I still feel like its incomplete. But the plan here is to continue to add functionality to it and actually have the Pinecoding and Tradingview community contribute to it.
As a math based trader, I relied on Excel, SPSS and R constantly to plan my trades. Since learning a functional amount of Pinescript and coding a lot of what I do and what I relied on SPSS, Excel and R for, I use it perhaps maybe a few times a week.
This indicator, or package, has some of the key things I used Excel and SPSS for on a daily and weekly basis. This also adds a lot of, I would say, fairly complex math functionality to Pinescript. Because this is adding functionality not necessarily native to Pinescript, I have placed most, if not all, of the functionality into actual exportable functions. I have also set it up as a kind of library, with explanations and tips on how other coders can take these functions and implement them into other scripts.
The hope here is that other coders will take it, build upon it, improve it and hopefully share additional functionality that can be added into this package. Hence why I call it a project. Okay, let's get into an overview:
Current Functions of SPTS:
SPTS currently has the following functionality (further explanations will be offered below):
Ability to Perform a One-Tailed, Two-Tailed and Paired Sample T-Test, with corresponding P value.
Standard Pearson Correlation (with functionality to be able to calculate the Pearson Correlation between 2 arrays).
Quadratic (or Curvlinear) correlation assessments.
R squared Assessments.
Standard Linear Regression.
Multiple Regression of 2 independent variables.
Tests of Normality (with Kurtosis and Skewness) and recognition of up to 7 Different Distributions.
ARIMA Modeller (Sort of, more details below)
Okay, so let's go over each of them!
T-Tests
So traditionally, most correlation assessments on Pinescript are done with a generic Pearson Correlation using the "ta.correlation" argument. However, this is not always the best test to be used for correlations and determine effects. One approach to correlation assessments used frequently in economics is the T-Test assessment.
The t-test is a statistical hypothesis test used to determine if there is a significant difference between the means of two groups. It assesses whether the sample means are likely to have come from populations with the same mean. The test produces a t-statistic, which is then compared to a critical value from the t-distribution to determine statistical significance. Lower p-values indicate stronger evidence against the null hypothesis of equal means.
A significant t-test result, indicating the rejection of the null hypothesis, suggests that there is statistical evidence to support that there is a significant difference between the means of the two groups being compared. In practical terms, it means that the observed difference in sample means is unlikely to have occurred by random chance alone. Researchers typically interpret this as evidence that there is a real, meaningful difference between the groups being studied.
Some uses of the T-Test in finance include:
Risk Assessment: The t-test can be used to compare the risk profiles of different financial assets or portfolios. It helps investors assess whether the differences in returns or volatility are statistically significant.
Pairs Trading: Traders often apply the t-test when engaging in pairs trading, a strategy that involves trading two correlated securities. It helps determine when the price spread between the two assets is statistically significant and may revert to the mean.
Volatility Analysis: Traders and risk managers use t-tests to compare the volatility of different assets or portfolios, assessing whether one is significantly more or less volatile than another.
Market Efficiency Tests: Financial researchers use t-tests to test the Efficient Market Hypothesis by assessing whether stock price movements follow a random walk or if there are statistically significant deviations from it.
Value at Risk (VaR) Calculation: Risk managers use t-tests to calculate VaR, a measure of potential losses in a portfolio. It helps assess whether a portfolio's value is likely to fall below a certain threshold.
There are many other applications, but these are a few of the highlights. SPTS permits 3 different types of T-Test analyses, these being the One Tailed T-Test (if you want to test a single direction), two tailed T-Test (if you are unsure of which direction is significant) and a paired sample t-test.
Which T is the Right T?
Generally, a one-tailed t-test is used to determine if a sample mean is significantly greater than or less than a specified population mean, whereas a two-tailed t-test assesses if the sample mean is significantly different (either greater or less) from the population mean. In contrast, a paired sample t-test compares two sets of paired observations (e.g., before and after treatment) to assess if there's a significant difference in their means, typically used when the data points in each pair are related or dependent.
So which do you use? Well, it depends on what you want to know. As a general rule a one tailed t-test is sufficient and will help you pinpoint directionality of the relationship (that one ticker or economic indicator has a significant affect on another in a linear way).
A two tailed is more broad and looks for significance in either direction.
A paired sample t-test usually looks at identical groups to see if one group has a statistically different outcome. This is usually used in clinical trials to compare treatment interventions in identical groups. It's use in finance is somewhat limited, but it is invaluable when you want to compare equities that track the same thing (for example SPX vs SPY vs ES1!) or you want to test a hypothesis about an index and a leveraged share (for example, the relationship between FNGU and, say, MSFT or NVDA).
Statistical Significance
In general, with a t-test you would need to reference a T-Table to determine the statistical significance of the degree of Freedom and the T-Statistic.
However, because I wanted Pinescript to full fledge replace SPSS and Excel, I went ahead and threw the T-Table into an array, so that Pinescript can make the determination itself of the actual P value for a t-test, no cross referencing required :-).
Left tail (Significant):
Both tails (Significant):
Distributed throughout (insignificant):
As you can see in the images above, the t-test will also display a bell-curve analysis of where the significance falls (left tail, both tails or insignificant, distributed throughout).
That said, I have not included this function for the paired sample t-test because that is a bit more nuanced. But for the one and two tailed assessments, the indicator will provide you the P value.
Pearson Correlation Assessment
I don't think I need to go into too much detail on this one.
I have put in functionality to quickly calculate the Pearson Correlation of two array's, which is not currently possible with the "ta.correlation" function.
Quadratic (Curvlinear) Correlation
Not everything in life is linear, sometimes things are curved!
The Pearson Correlation is great for linear assessments, but tends to under-estimate the degree of the relationship in curved relationships. There currently is no native function to t-test for quadratic/curvlinear relationships, so I went ahead and created one.
You can see an example of how Quadratic and Pearson Correlations vary when you look at CME_MINI:ES1! against AMEX:DIA for the past 10 ish months:
Pearson Correlation:
Quadratic Correlation:
One or the other is not always the best, so it is important to check both!
R-Squared Assessments:
The R-squared value, or the square of the Pearson correlation coefficient (r), is used to measure the proportion of variance in one variable that can be explained by the linear relationship with another variable. It represents the goodness-of-fit of a linear regression model with a single predictor variable.
R-Squared is offered in 3 separate forms within this indicator. First, there is the generic R squared which is taking the square root of a Pearson Correlation assessment to assess the variance.
The next is the R-Squared which is calculated from an actual linear regression model done within the indicator.
The first is the R-Squared which is calculated from a multiple regression model done within the indicator.
Regardless of which R-Squared value you are using, the meaning is the same. R-Square assesses the variance between the variables under assessment and can offer an insight into the goodness of fit and the ability of the model to account for the degree of variance.
Here is the R Squared assessment of the SPX against the US Money Supply:
Standard Linear Regression
The indicator contains the ability to do a standard linear regression model. You can convert one ticker or economic indicator into a stock, ticker or other economic indicator. The indicator will provide you with all of the expected information from a linear regression model, including the coefficients, intercept, error assessments, correlation and R2 value.
Here is AAPL and MSFT as an example:
Multiple Regression
Oh man, this was something I really wanted in Pinescript, and now we have it!
I have created a function for multiple regression, which, if you export the function, will permit you to perform multiple regression on any variables available in Pinescript!
Using this functionality in the indicator, you will need to select 2, dependent variables and a single independent variable.
Here is an example of multiple regression for NASDAQ:AAPL using NASDAQ:MSFT and NASDAQ:NVDA :
And an example of SPX using the US Money Supply (M2) and AMEX:GLD :
Tests of Normality:
Many indicators perform a lot of functions on the assumption of normality, yet there are no indicators that actually test that assumption!
So, I have inputted a function to assess for normality. It uses the Kurtosis and Skewness to determine up to 7 different distribution types and it will explain the implication of the distribution. Here is an example of SP:SPX on the Monthly Perspective since 2010:
And NYSE:BA since the 60s:
And NVDA since 2015:
ARIMA Modeller
Okay, so let me disclose, this isn't a full fledge ARIMA modeller. I took some shortcuts.
True ARIMA modelling would involve decomposing the seasonality from the trend. I omitted this step for simplicity sake. Instead, you can select between using an EMA or SMA based approach, and it will perform an autogressive type analysis on the EMA or SMA.
I have tested it on lookback with results provided by SPSS and this actually works better than SPSS' ARIMA function. So I am actually kind of impressed.
You will need to input your parameters for the ARIMA model, I usually would do a 14, 21 and 50 day EMA of the close price, and it will forecast out that range over the length of the EMA.
So for example, if you select the EMA 50 on the daily, it will plot out the forecast for the next 50 days based on an autoregressive model created on the EMA 50. Here is how it looks on AMEX:SPY :
You can also elect to plot the upper and lower confidence bands:
Closing Remarks
So that is the indicator/package.
I do hope to continue expanding its functionality, but as of now, it does already have quite a lot of functionality.
I really hope you enjoy it and find it helpful. This. Has. Taken. AGES! No joke. Between referencing my old statistics textbooks, trying to remember how to calculate some of these things, and wanting to throw my computer against the wall because of errors in the code, this was a task, that's for sure. So I really hope you find some usefulness in it all and enjoy the ability to be able to do functions that previously could really only be done in external software.
As always, leave your comments, suggestions and feedback below!
Take care!

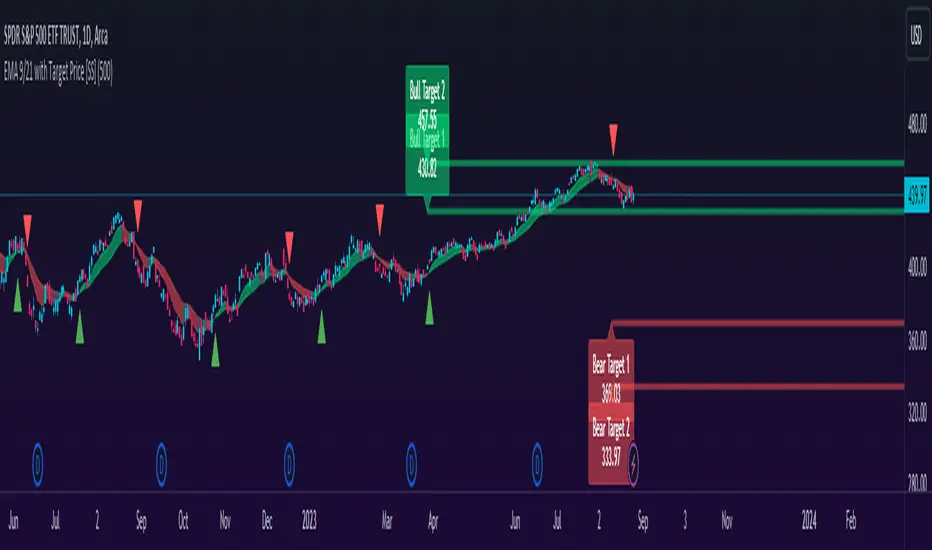
EMA 9/21 with Target Price [SS]Hey everyone,
Coming back with my EMA 9/21 indicator.
My original one was removed a long time ago because I didn't really realize that there were already plenty of similar indicators (my bad!) but this one is my unique, Steversteves edition haha.
About the Indicator:
Essentially, it just combines the 2 only EMA's I ever really use (the 9 and 21) with an ATR based analysis to calculate the average range a ticker undergoes after an EMA 9 / 21 Cross-over and Cross-under.
You can see the major example being in the chart above. I use this for dramatic effect as SPY just happened to have topped at the second expected bull target on the daily. But obviously the intention for this indicator is to be used on the smaller timeframes. Let's take a look at some examples with various tickers.
TSLA:
So let's just use the previous day as example (which was Friday). If we look to the chart below:
TSLA did an EMA 9/21 crossover (bullish) in premarket. This put the immediate TP at 234.59. If we play out the chart:
We shot right to it at open.
We then did a cross under with a TP of 225.93, but that was not realized as the sentiment was too bullish. We then cross back over to the upside, putthing next TP at 238.88 which was realized:
NVDA:
On Friday, NVDA was a bit of a mess, lots of whipsaw off open. But once we finally had a cross under with 3 consecutive closes below the EMA9/21 on the 5 minute chart, it solidified the likelihood of a short:
And this was the result:
We came down to the first target, held it actually as support before finally crossing back over, setting the next TP at 475.05. We got 3 consecutive closes above the EMA 9/21, so let's see what happened:
Nothing really, we closed before we got there, but we did make progress towards it.
And last but not least SPY:
We opened the day with a bullish crossover and 3 consecutive closes above the EMA9/21, making our TP 441.38 (chart above). Let's see what happened:
We came just shy of it after the fed release volatility slammed it down, where we got a crossunder (bearish) to a TP of 436.21:
This ended up playing out, we did get a bullish crossover later in the day and so let's see what happened then:
So those are the real examples, most recent examples of trading using this. They are not all perfect, which is intentional because you need to use a bit of your own analysis, of course, when you are using this type of strategy or indicator. The EMA 9/21 is not sufficient generally on its own, but it is very helpful to gauge the immediate PA and whether the expected move aligns with your overall thesis on the day in terms of realistic target prices.
Customizability:
In terms of the customizability, this is a very basic indicator aside from the assessment of ranges. So there really is not a lot to customize.
You can toggle off and on the labels if you do not want them, you can also adjust the lookback length for the ATR assessment. The lookback length is defaulted to 500, I do really highly suggest you leave it at 500 because this has worked well for me and in back-testing, it has performed above my own expectations.
But, that said, you can take this and back-test as you wish with whatever parameters you feel are most appropriate. I haven't back-tested this on every stock known to man, my go to's are SPY, QQQ, sometimes MSFT and so it works well on those. But perhaps some others will have differing results.
Final Thoughts:
That is the indicator in a nutshell! It is really self explanatory and its likely a strategy most of you already know. This just helps to add realistic price targets and context to those cross-overs and cross-unders.
It also works fine on larger timeframes. We can see it on the 1 hour with MSFT:
On the 2 hour hour with QQQ:
And I am sure you can find other examples!
That's it everyone, safe trades!
Baseline Indicator [SS]Hello,
This is the Baseline Indicator. I modelled it after one of my favourite Tradingview chart types, the baseline type (shown in image below):
I really love this chart, but I wanted a way for it to:
a) Be static and not move with the chart; and
b) Auto calculate the baseline average for a specified period of time.
So I created this indicator which does essentially that.
What it does:
The indicator will calculate the average between the high and low of a user defined timeframe. The timeframe is customizable, but it defaults to daily. It will then plot the average (or baseline) of the high and low over that specified timeframe. The default plot is a candle plot. It will change the colours of the candles to green (for above the baseline) and red (for below the baseline). The chart below shows an example of the indicator with candles on SPY. The Baseline timeframe is set to 1 hour:
You can choose whether you want to plot the current baseline average or the previous.
The advantage to plotting the previous is that this provide a static reference point and can be helpful on the 30 and 60 minute timeframe. Here is an example:
In this example on SPY, the indicator is plotting the previous average. You can see SPY is using this as support and creating a "staircase" pattern. This is indicative of a trend.
The example above is using the previous day average on the daily timeframe during a sideways day. You can see that the price action accumulates and is consistently drawn to this point.
Inversely, you can manually select your own baseline price if you want a static, self-calculated baseline reference point.
Options and Settings:
Below is an outline of the menu as well as a brief explanation of the options and settings:
To view your chart as a baseline chart, make sure you select the "Line" input and then hide the candles on your chart using your chart settings (see image below):
The purple arrow shows how to hide the candles. You select the "Eye" Icon which should then become greyed out and you will be left with the baseline chart from the indicator.
Why use baseline average?
The average between the high and low of a designated timeframe is a very helpful value. In choppy markets, this acts as a key point of frequent return. In trendy markets, this acts as a reference point of trend direction and strength. I encourage you to play around with the indicator and review some historical charts using it, and you will see some patterns emerge!
Final thoughts:
I have also done a quick tutorial video on the indicator for your reference, you can check that out below:
Thanks for checking out the indicator and I hope you like it!

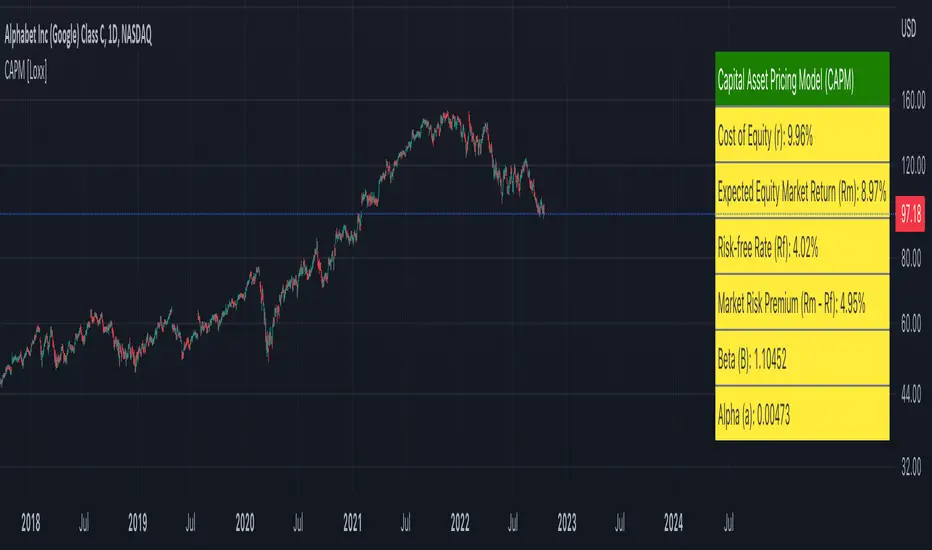
Capital Asset Pricing Model (CAPM) [Loxx]Capital Asset Pricing Model (CAPM) demonstrates how to calculate the Cost of Equity for an underlying asset using Pine Script. This script will only work on the monthly timeframe. While you can change the default inputs, you should study what CAPM is and how this works before doing so. This indicator pulls various types of data from SPY from various timeframes to calculate risk-free rates, market premiums, and log returns. Alpha and Beta are computed using the regression between underlying asset and SPY. This indicator only calculates on the most recent data. If you wish to change this, you'll have to save the script and make adjustments. A few examples where CAPM is used:
Used as the mu factor Geometric Brownian Motion models for options pricing and forecasting price ranges and decay
Calculating the Weighted Average Cost of Capital
Asset pricing
Efficient frontier
Risk and diversification
Security market line
Discounted Cashflow Analysis
Investment bankers use CAPM to value deals
Account firms use CAPM to verify asset prices and assumptions
Real estate firms use variations of CAPM to value properties
... and more
Details of the calculations used here
Rm is calculated using yearly simple returns data from SPY, typically this is just hard coded as 10%.
Rf is pulled from US 10 year bond yields
Beta and Alpha are pulled form monthly returns data of the asset and SPY
In the past, typically this data is purchased from investments banks whose research arms produce values for beta, alpha, risk free rate, and risk premiums. In 2022 ,you can find free estimates for each parameter but these values might not reflect the most current data or research.
History
The CAPM was introduced by Jack Treynor (1961, 1962), William F. Sharpe (1964), John Lintner (1965) and Jan Mossin (1966) independently, building on the earlier work of Harry Markowitz on diversification and modern portfolio theory. Sharpe, Markowitz and Merton Miller jointly received the 1990 Nobel Memorial Prize in Economics for this contribution to the field of financial economics. Fischer Black (1972) developed another version of CAPM, called Black CAPM or zero-beta CAPM, that does not assume the existence of a riskless asset. This version was more robust against empirical testing and was influential in the widespread adoption of the CAPM.
Usage
The CAPM is used to calculate the amount of return that investors need to realize to compensate for a particular level of risk. It subtracts the risk-free rate from the expected rate and weighs it with a factor – beta – to get the risk premium. It then adds the risk premium to the risk-free rate of return to get the rate of return an investor expects as compensation for the risk. The CAPM formula is expressed as follows:
r = Rf + beta (Rm – Rf) + Alpha
Therefore,
Alpha = R – Rf – beta (Rm-Rf)
Where:
R represents the portfolio return
Rf represents the risk-free rate of return
Beta represents the systematic risk of a portfolio
Rm represents the market return, per a benchmark
For example, assuming that the actual return of the fund is 30, the risk-free rate is 8%, beta is 1.1, and the benchmark index return is 20%, alpha is calculated as:
Alpha = (0.30-0.08) – 1.1 (0.20-0.08) = 0.088 or 8.8%
The result shows that the investment in this example outperformed the benchmark index by 8.8%.
The alpha of a portfolio is the excess return it produces compared to a benchmark index. Investors in mutual funds or ETFs often look for a fund with a high alpha in hopes of getting a superior return on investment (ROI).
The alpha ratio is often used along with the beta coefficient, which is a measure of the volatility of an investment. The two ratios are both used in the Capital Assets Pricing Model (CAPM) to analyze a portfolio of investments and assess its theoretical performance.
To see CAPM in action in terms of calculate WACC, see here for an example: finbox.com
Further reading
en.wikipedia.org
Portfolio Performance - Effects of RebalancingFunction:
- Can be used to evaluate the performance of a portfolio containing 2 assets over a set time interval
- Shows the % return of the portfolio over the time interval defined by the user
- Includes a threshold rebalancing algorithm to show the effects that rebalancing has on the portfolio over the long term
- Created to evaluate of the performance of portfolios containing different weightings of stocks and bonds over time assuming that the user would rebalance the portfolio when asset weights crossed a threshold
Instructions:
- To be used with dividends adjustments turned on
- Add this script to a symbol. e.g. AMEX:SPY
- Click the chart to define the entry time and the exit time. i.e. the time interval
- Define the initial investment of the portfolio. Default setting is $100,000
- Define the second asset to be included in the portfolio. e.g. BATS:AGG
- The strategy comes pre-populated with a portfolio that has a weight of 80% asset 1 and 20% asset 2. i.e. 80% AMEX:SPY and 20% BATS:AGG if the symbols mentioned above were chosen
- The 7 lines show the weighted % return of each portfolio over the time period defined by the user
- Each line (except the blue) is the return based on a different rebalancing threshold. The default settings are 1%, 2.5%, 5%, 10%, 15%, 20%, 30%
- The blue line is the % return of a portfolio that was made up of 100% asset 1 over the time interval. i.e. 100% AMEX:SPY
- Asset weights and rebalancing thresholds are adjustable via the settings
- Each plot can be turned on and turned off via a tick box in the settings

Zweig Market Breadth Thrust Indicator StrategyThe Breadth Thrust Indicator is a technical indicator which determines market momentum, signaling the start of a potential new bull market.
The Breadth Thrust Indicator was developed by Martin Zweig, an American stock investor, financial analyst, and investment adviser. According to Zweig, the concept is based on the principle that the sudden change of money in the investment markets elevates stocks and signals increased liquidity. In other words, this indicator is all about how quickly the NYSE's advancing and declining numbers go from poor to great in a compressed time period.
A "Thrust" indicates that the stock market has rapidly changed from an oversold condition to one of strength, but has not yet become overbought. This is very rare and has happened only a few times. Dr . Zweig also points out that most bull markets begin with a Breadth Thrust.
More info can be found at www.investopedia.com
I have inspired by indicator introduced in TradingView by LazyBear and adopted the logic from there. Thanks LazyBear !!!
Though indicator signals the new Bull market, but I have not found much information how to use it in daily market. So I had come up with a strategy, which would allow us to trade SPY, QQQ , AMEX and securities under these markets.
I have used MA setting as 65 (since Zweig indicator setting was 10 days , based on that I set 65 for Hourly chart ... 10d x 6.5 Hrs = 65 in my startegy). You have to change this setting if you change the timeframe. Also , note that this strategy is for Stock Market only.
Strategy Rule/Settings
===================
Select the market type based on your security symbol.
SPY => use NYSE
QQQ => use NASDAQ
any other security => check exchange it was listed and select the corresponding market.
if you dont know , use COMBINED option
BUY
====
when indicator cross 0.40 from below
Note:
1. see how well it picks the bottoms ... example : Nov 2020 ....
2. setting 0.45 is also produces good results , only thing is you get more signals.
EXIT
=====
Exit when indicator cross down from 0.60 . I have used RSI (5) for partial exits. These two are available in settings
Close the whole position when indicator crossing down 0.40
STOP LOSS
=========
defaulted to 5%
Please Note , I have tested SPY , QQQ on Horly chart with MA 65. You need to chnage the MA setting based on your time frame and check the results.
WARNING
========
For the use of educational purposes only

Waindrops [Makit0]█ OVERALL
Plot waindrops (custom volume profiles) on user defined periods, for each period you get high and low, it slices each period in half to get independent vwap, volume profile and the volume traded per price at each half.
It works on intraday charts only, up to 720m (12H). It can plot balanced or unbalanced waindrops, and volume profiles up to 24H sessions.
As example you can setup unbalanced periods to get independent volume profiles for the overnight and cash sessions on the futures market, or 24H periods to get the full session volume profile of EURUSD
The purpose of this indicator is twofold:
1 — from a Chartist point of view, to have an indicator which displays the volume in a more readable way
2 — from a Pine Coder point of view, to have an example of use for two very powerful tools on Pine Script:
• the recently updated drawing limit to 500 (from 50)
• the recently ability to use drawings arrays (lines and labels)
If you are new to Pine Script and you are learning how to code, I hope you read all the code and comments on this indicator, all is designed for you,
the variables and functions names, the sometimes too big explanations, the overall structure of the code, all is intended as an example on how to code
in Pine Script a specific indicator from a very good specification in form of white paper
If you wanna learn Pine Script form scratch just start HERE
In case you have any kind of problem with Pine Script please use some of the awesome resources at our disposal: USRMAN , REFMAN , AWESOMENESS , MAGIC
█ FEATURES
Waindrops are a different way of seeing the volume and price plotted in a chart, its a volume profile indicator where you can see the volume of each price level
plotted as a vertical histogram for each half of a custom period. By default the period is 60 so it plots an independent volume profile each 30m
You can think of each waindrop as an user defined candlestick or bar with four key values:
• high of the period
• low of the period
• left vwap (volume weighted average price of the first half period)
• right vwap (volume weighted average price of the second half period)
The waindrop can have 3 different colors (configurable by the user):
• GREEN: when the right vwap is higher than the left vwap (bullish sentiment )
• RED: when the right vwap is lower than the left vwap (bearish sentiment )
• BLUE: when the right vwap is equal than the left vwap ( neutral sentiment )
KEY FEATURES
• Help menu
• Custom periods
• Central bars
• Left/Right VWAPs
• Custom central bars and vwaps: color and pixels
• Highly configurable volume histogram: execution window, ticks, pixels, color, update frequency and fine tuning the neutral meaning
• Volume labels with custom size and color
• Tracking price dot to be able to see the current price when you hide your default candlesticks or bars
█ SETTINGS
Click here or set any impar period to see the HELP INFO : show the HELP INFO, if it is activated the indicator will not plot
PERIOD SIZE (max 2880 min) : waindrop size in minutes, default 60, max 2880 to allow the first half of a 48H period as a full session volume profile
BARS : show the central and vwap bars, default true
Central bars : show the central bars, default true
VWAP bars : show the left and right vwap bars, default true
Bars pixels : width of the bars in pixels, default 2
Bars color mode : bars color behavior
• BARS : gets the color from the 'Bars color' option on the settings panel
• HISTOGRAM : gets the color from the Bearish/Bullish/Neutral Histogram color options from the settings panel
Bars color : color for the central and vwap bars, default white
HISTOGRAM show the volume histogram, default true
Execution window (x24H) : last 24H periods where the volume funcionality will be plotted, default 5
Ticks per bar (max 50) : width in ticks of each histogram bar, default 2
Updates per period : number of times the histogram will update
• ONE : update at the last bar of the period
• TWO : update at the last bar of each half period
• FOUR : slice the period in 4 quarters and updates at the last bar of each of them
• EACH BAR : updates at the close of each bar
Pixels per bar : width in pixels of each histogram bar, default 4
Neutral Treshold (ticks) : delta in ticks between left and right vwaps to identify a waindrop as neutral, default 0
Bearish Histogram color : histogram color when right vwap is lower than left vwap, default red
Bullish Histogram color : histogram color when right vwap is higher than left vwap, default green
Neutral Histogram color : histogram color when the delta between right and left vwaps is equal or lower than the Neutral treshold, default blue
VOLUME LABELS : show volume labels
Volume labels color : color for the volume labels, default white
Volume Labels size : text size for the volume labels, choose between AUTO, TINY, SMALL, NORMAL or LARGE, default TINY
TRACK PRICE : show a yellow ball tracking the last price, default true
█ LIMITS
This indicator only works on intraday charts (minutes only) up to 12H (720m), the lower chart timeframe you can use is 1m
This indicator needs price, time and volume to work, it will not work on an index (there is no volume), the execution will not be allowed
The histogram (volume profile) can be plotted on 24H sessions as limit but you can plot several 24H sessions
█ ERRORS AND PERFORMANCE
Depending on the choosed settings, the script performance will be highly affected and it will experience errors
Two of the more common errors it can throw are:
• Calculation takes too long to execute
• Loop takes too long
The indicator performance is highly related to the underlying volatility (tick wise), the script takes each candlestick or bar and for each tick in it stores the price and volume, if the ticker in your chart has thousands and thousands of ticks per bar the indicator will throw an error for sure, it can not calculate in time such amount of ticks.
What all of that means? Simply put, this will throw error on the BITCOIN pair BTCUSD (high volatility with tick size 0.01) because it has too many ticks per bar, but lucky you it will work just fine on the futures contract BTC1! (tick size 5) because it has a lot less ticks per bar
There are some options you can fine tune to boost the script performance, the more demanding option in terms of resources consumption is Updates per period , by default is maxed out so lowering this setting will improve the performance in a high way.
If you wanna know more about how to improve the script performance, read the HELP INFO accessible from the settings panel
█ HOW-TO SETUP
The basic parameters to adjust are Period size , Ticks per bar and Pixels per bar
• Period size is the main setting, defines the waindrop size, to get a better looking histogram set bigger period and smaller chart timeframe
• Ticks per bar is the tricky one, adjust it differently for each underlying (ticker) volatility wise, for some you will need a low value, for others a high one.
To get a more accurate histogram set it as lower as you can (min value is 1)
• Pixels per bar allows you to adjust the width of each histogram bar, with it you can adjust the blank space between them or allow overlaping
You must play with these three parameters until you obtain the desired histogram: smoother, sharper, etc...
These are some of the different kind of charts you can setup thru the settings:
• Balanced Waindrops (default): charts with waindrops where the two halfs are of same size.
This is the default chart, just select a period (30m, 60m, 120m, 240m, pick your poison), adjust the histogram ticks and pixels and watch
• Unbalanced Waindrops: chart with waindrops where the two halfs are of different sizes.
Do you trade futures and want to plot a waindrop with the first half for the overnight session and the second half for the cash session? you got it;
just adjust the period to 1860 for any CME ticker (like ES1! for example) adjust the histogram ticks and pixels and watch
• Full Session Volume Profile: chart with waindrops where only the first half plots.
Do you use Volume profile to analize the market? Lucky you, now you can trick this one to plot it, just try a period of 780 on SPY, 2760 on ES1!, or 2880 on EURUSD
remember to adjust the histogram ticks and pixels for each underlying
• Only Bars: charts with only central and vwap bars plotted, simply deactivate the histogram and volume labels
• Only Histogram: charts with only the histogram plotted (volume profile charts), simply deactivate the bars and volume labels
• Only Volume: charts with only the raw volume numbers plotted, simply deactivate the bars and histogram
If you wanna know more about custom full session periods for different asset classes, read the HELP INFO accessible from the settings panel
EXAMPLES
Full Session Volume Profile on MES 5m chart:
Full Session Unbalanced Waindrop on MNQ 2m chart (left side Overnight session, right side Cash Session):
The following examples will have the exact same charts but on four different tickers representing a futures contract, a forex pair, an etf and a stock.
We are doing this to be able to see the different parameters we need for plotting the same kind of chart on different assets
The chart composition is as follows:
• Left side: Volume Labels chart (period 10)
• Upper Right side: Waindrops (period 60)
• Lower Right side: Full Session Volume Profile
The first example will specify the main parameters, the rest of the charts will have only the differences
MES :
• Left: Period size: 10, Bars: uncheck, Histogram: uncheck, Execution window: 1, Ticks per bar: 2, Updates per period: EACH BAR,
Pixels per bar: 4, Volume labels: check, Track price: check
• Upper Right: Period size: 60, Bars: check, Bars color mode: HISTOGRAM, Histogram: check, Execution window: 2, Ticks per bar: 2,
Updates per period: EACH BAR, Pixels per bar: 4, Volume labels: uncheck, Track price: check
• Lower Right: Period size: 2760, Bars: uncheck, Histogram: check, Execution window: 1, Ticks per bar: 1, Updates per period: EACH BAR,
Pixels per bar: 2, Volume labels: uncheck, Track price: check
EURUSD :
• Upper Right: Ticks per bar: 10
• Lower Right: Period size: 2880, Ticks per bar: 1, Pixels per bar: 1
SPY :
• Left: Ticks per bar: 3
• Upper Right: Ticks per bar: 5, Pixels per bar: 3
• Lower Right: Period size: 780, Ticks per bar: 2, Pixels per bar: 2
AAPL :
• Left: Ticks per bar: 2
• Upper Right: Ticks per bar: 6, Pixels per bar: 3
• Lower Right: Period size: 780, Ticks per bar: 1, Pixels per bar: 2
█ THANKS TO
PineCoders for all they do, all the tools and help they provide and their involvement in making a better community
scarf for the idea of coding a waindrops like indicator, I did not know something like that existed at all
All the Pine Coders, Pine Pros and Pine Wizards, people who share their work and knowledge for the sake of it and helping others, I'm very grateful indeed
I'm learning at each step of the way from you all, thanks for this awesome community;
Opensource and shared knowledge: this is the way! (said with canned voice from inside my helmet :D)
█ NOTE
This description was formatted following THIS guidelines
═════════════════════════════════════════════════════════════════════════
I sincerely hope you enjoy reading and using this work as much as I enjoyed developing it :D
GOOD LUCK AND HAPPY TRADING!

ADX_TSI_Bol Band Trend ChaserThe idea of this script is to be a low risk strategy on trending stocks (or any other trending market), aiming to achieve minimal draw down (e.g. at time of writing AAPL only had ~1.36% draw down, FB ~1.93% draw down and the SPY was 0.80% draw down and all remained profitable).
Testing proved it shouldn't be used in choppy stocks and best period was on daily charts. The back test filter goes back until 2010 so you can obtain 10 years of data.
The strategy utilizes the 200 Moving Average, a Custom Bollinger Band, a TSI with 52 period weighted moving average and ADX strength.
Although back test dates are set to 2010 - 2020, all other filters (moving average, ADX, TSI , Bollinger Band) are not locked so they can be user amended if desired. However the current settings have been tested with manual trading for quite some time to get this combination correct.
Buy signal is given when trading above the 200 moving average + 5 candles have closed above the upper custom Bollinger + the TSI is positive + ADX is above 20.
As back testing proved that this traded better only in tends then some Sell/Short conditions have been removed from the script and this only takes Long orders.
Only requires 2 additional lines of code to add shorting order and then remove the "buy" condition and this could be used for a downward trending stock instead.
Close for either long or short trades is signaled once the TSI crosses in the opposite direction indicating change in trend strength.
Further optimization could be achieved by adding a stop loss, which I may do in the future.
NOTE: This only shows the lower indicators however for visualization you can use my script "CUSTOM BOLLINGER WITH SMA", which is the upper indicators in this strategy.
This is my first attempt at coding a strategy so I'm happy to receive any feedback or hints on how this could be written better from any experienced coders!
NASDAQ:AAPL AMEX:SPY
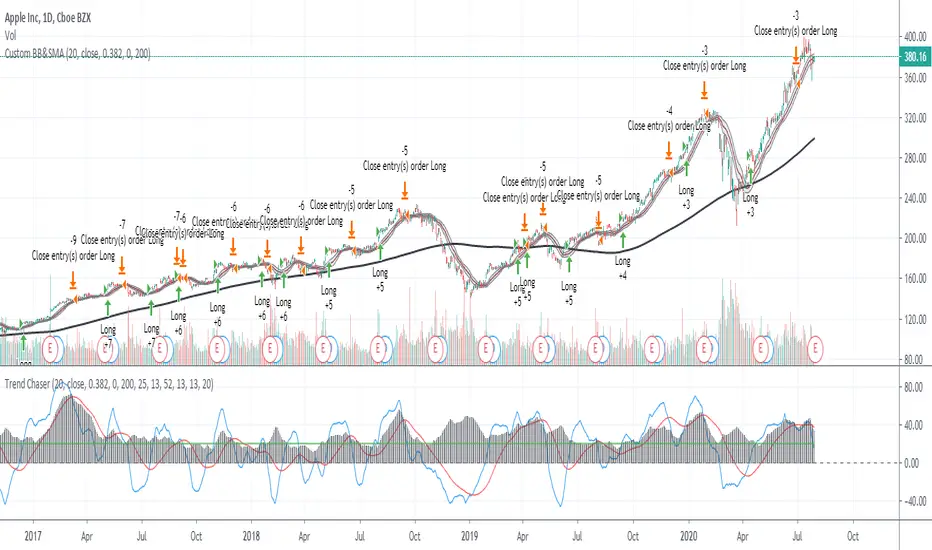
Short in Bollinger Band Down trend (Weekly and Daily) // © PlanTradePlanMM
// 6/14/2020
// ---------------------------------------------------
// Name: Short in Bollinger Band Down trend (Weekly and Daily)
// ---------------------------------------------------
// Key Points in this study:
// 1. Short in BB Lower band, probability of price going down is more than 50%
// 2. Short at the top 1/4 of Lower band (EMA - Lower line), Stop is EMA, tartget is Lower line; it matches risk:/reward=1:3 naturally
//
// Draw Lines:
// BB Lower : is the Target (Black line)
// BB EMA : is the initial Stop (Black line)
// ShortLine : EMA - 1/4 of (Stop-target), which matches risk:/reward=1:3
// Prepare Zone : between EMA and ShortLine
// shortPrice : Blue dot line only showing when has Short position, Which shows entry price.
// StopPrice : Black dot line only showing when has Short position, Which shows updated stop price.
//
// Add SMA50 to filter the trend. Price <= SMA, allow to short
//
// What (Condition): in BB down trend band
// When (Price action): Price cross below ShortLine;
// How (Trading Plan): Short at ShortLine;
// Initial Stop is EMA;
// Initial Target is BB Lower Line;
// FollowUp: if price moves down first, and EMA is below Short Price. Move stop to EMA, At least "make even" in this trade;
// if Price touched Short Line again and goes down, new EMA will be the updated stop
//
// Exit: 1. Initial stop -- "Stop" when down first, Close above stop
// 2. Target reached -- "TR" when down quickly, Target reached
// 3. make even -- "ME" when small down and up, Exit at Entry Price
// 4. Small Winner -- "SM" when EMA below Entry price, Exit when Close above EMA
//
// --------------
// Because there are too many flags in up trend study already, I created this down trend script separately.
// Uptrend study is good for SPY, QQQ, and strong stocks.
// Downtrend Study is good for weak ETF, stock, and (-2x, -3x) ETFs, such as FAZ, UVXY, USO, XOP, AAL, CCL
// -----------------------------------------------------------------------------------------------------------------
// Back test Weekly and daily chart for SPY, QQQ, XOP, AAL, BA, MMM, FAZ, UVXY
// The best sample is FAZ Weekly chart.
// When SPY and QQQ are good in long term up trend, these (-2x, -3x) ETFs are always going down in long term.
// Some of them are not allowed to short. I used option Put/Put spread for the short entry.
//

Buy in Bollinger Band uptrend (Weekly and Daily) // © PlanTradePlanMM 6/14/2020
// ---------------------------------------------------
// Name: Buy in Bollinger Band uptrend (Weekly and Daily)
// ---------------------------------------------------
// Key Points in this study:
// 1. Long in BB Upper band, probability of price going up is more than 50%
// 2. Buy at the bottom 1/4 of upper band (Upper line - EMA), Stop is EMA, tartget is Upper line; it matches risk:reward=1:3;
//
// Draw Lines:
// BB Upper : is the Target (Black line)
// BB EMA : is the initial Stop (Black line)
// BuyLine : EMA20 + 1/4 of (Target-Stop), which matches risk:/reward=1:3 naturally
// Prepare Zone : between EMA and BuyLine
// buyPrice : Blue dot line only showing when has long position, Which shows entry price.
// StopPrice : Black dot line only showing when has long position, Which shows updated stop price.
//
// Add SMA(50) to filter the trend. Price >= SMA, allow to long
//
// What (Condition): in BB uptrend band
// When (Price action): Price cross over BuyLine;
// How (Trading Plan): Buy at BuyLine;
// Initial Stop is EMA;
// Initial Target is BB Upper Line;
//
// FollowUp: if price moves up first, and the EMA is higher than Entry point, Use EMA as new stop. At least "make even" in this trade;
//
// Exit: 1. Initial stop -- "Stop" when down first, close below stop price.
// 2. Target reached -- "TR" when up quickly, Target reached
// 3. make even -- "ME" when small up and down, Exit at entry Price
// 4. Small Winner -- "SM" when EMA above Entry price, Exit when close below EMA, and higher than entry Price
//
// --------------
// Because there are too many flags in up trend study already, I will create a down trend script separately.
// Uptrend study is good for SPY, QQQ, and strong stocks.
// Downtrend Study is good for weak ETF, stock, and (-2x, -3x) ETFs, such as FAZ, UVXY, USO, XOP, AAL, CCL
// -----------------------------------------------------------------------------------------------------------------
// Back test Weekly and daily chart for SPY, QQQ
// If it will be a big Gap down or a big down move, stop at close price could be a big loss; But this way could avoid may noise, to stay in a trending position longer.
// When buy in trending move, the position could be hold for a big range.
// The best samples are SPY and QQQ daily chart.
//
// Better to use another way to verify the long term up trend first.
// For single stock, it is better shows more relative strength than SPY.

Noise Area (TS Intraday, Custom Session + Timezone List)This indicator replicates the algorithm proposed in “Beat the Market: An Effective Intraday Momentum Strategy for the S&P 500 ETF (SPY)” by Carlo Zarattini, Andrew Aziz, and Andrea Barbon. The implementation follows the core methodology described in the paper, reproducing its intraday momentum signals and trading logic as applied to the S&P 500 ETF (SPY)

Multi-Indicator Dashboard# Multi-Indicator Dashboard v3.7
## What Makes This Script Original?
This dashboard is **not a simple indicator mashup**. It implements a **unique multi-layer decision system** that combines three distinct methodologies into a unified framework:
1. **Ehlers' Laguerre Mathematics** - 18 weighted Laguerre filters with consensus voting
2. **Minervini's Trend Template** - Structural trend analysis using SMA relationships
3. **Defensive Voting System** - A 7-jury protection mechanism to prevent false signals
The key innovation is the **layered signal override architecture**: each layer can downgrade (but never upgrade) signals from the previous layer, creating a "safety net" that catches bull traps and false breakouts.
---
## How It Works: The 5-Layer Protection System
### Layer 1: Laguerre Consensus (Signal Generation)
The script calculates 18 Laguerre filters with gamma values from 0.10 to 0.95. Each filter "votes" bullish or bearish based on:
- Price position relative to filter
- Filter direction (rising/falling)
Votes are weighted by gamma (slower filters = higher weight). The **Effective Consensus** percentage determines the base signal strength.
### Layer 2: Market Filter (Macro Protection)
```
IF Reference Index (SPY/QQQ) < 200-day SMA
THEN Market = Bearish → Block ENTER signals
```
This prevents new entries during bear markets, regardless of individual stock strength.
### Layer 3: Regime Filter (Market Condition)
The script detects three market regimes using 7 criteria:
- ADX level (trend strength)
- DI+ vs DI- spread
- RSI position
- SMA convergence
- Volatility contraction
- Laguerre spread
**Choppy or Sideways regime** → Downgrade TREND/ENTER to CAUTION
### Layer 4: Protection Score (7-Jury System)
Seven independent "juries" vote on structural health:
| Jury | Condition | Meaning |
|------|-----------|---------|
| Laguerre | Close < Lag01 | Fast support broken |
| MACD | Histogram < 0 | Momentum negative |
| OBV | Trend = -1 | Volume selling |
| SMA20 | Close < SMA20 | Short-term trend broken |
| EMA Structure | EMA10 < SMA20 | Trend structure damaged |
| RS Line | RS < RS SMA50 | Underperforming index |
| Net Momentum | RSC < 50 | Sellers stronger than buyers |
**Scoring:**
- 0-1 points: Normal
- 2 points: Yellow Alert (TREND → WAIT)
- 3+ points: Red Alert (→ CAUTION)
### Layer 5: RSI Divergence Alert (Visual Warning)
When price approaches a 60-day high but RSI is 5+ points lower than at the previous peak, a warning icon (⚠️) appears. This **does not change signals** - it's informational only.
---
## Signal Interpretation
| Signal | Code | Meaning | Action |
|--------|------|---------|--------|
| 🟢 ENTER | 5 | Strong setup, all layers confirm | Consider entry |
| 🟢 TREND | 4 | Trend continues, structure intact | Hold position |
| 🟠 CAUTION | 3 | Warning signs present | Avoid new entries |
| 🟡 WATCH | 2 | Developing, too early | Monitor closely |
| ⚪ WAIT | 1 | Conditions unfavorable | Stay in cash |
---
## Key Indicators Explained
### RSC (Relative Strength of Change)
```
RSC = Sum of Positive Changes / Total Changes × 100
```
- RSC > 50: Buyers creating larger moves
- RSC < 50: Sellers creating larger moves
### Effective Consensus
Weighted average of 18 Laguerre filter votes. Higher gamma filters (slower, more reliable) have 2x weight compared to fast filters.
### LaRSI (Laguerre RSI)
Ehlers' smoothed RSI variant. Key zones:
- Below 0.20: Oversold (potential bottom)
- 0.30-0.55: Pullback zone (entry opportunity if turning up)
- Above 0.80: Overbought (caution)
---
## How to Use
1. **Check FINAL SIGNAL** - This is the output after all 5 layers process
2. **Read Status Row** - Shows which filter is currently active (if any)
3. **Monitor RSI Alert** - Orange color with ⚠️ means divergence detected
4. **Use Data Window** - Right-click chart → Data Window for all raw values
### Settings
- **Reference Index**: SPY for US stocks, BTCUSD for crypto
- **RS Lookback**: Period for relative strength calculation (default 50)
- **Filters can be toggled** on/off based on your strategy
---
## Important Disclaimers
- This indicator does not guarantee profits
- Past performance ≠ future results
- ENTER signal ≠ "buy immediately" - always confirm with your own analysis
- Risk management remains your responsibility
---
## Credits & Methodology Sources
- **Laguerre Filters**: John Ehlers, "Cybernetic Analysis for Stocks and Futures"
- **Trend Template**: Mark Minervini, "Trade Like a Stock Market Wizard"
- **CANSLIM**: William O'Neil, "How to Make Money in Stocks"
---
