Complete DashboardPA+AI PRE/GO Trading Dashboard v0.1.2 - Publication Summary
Overview
A comprehensive multi-component trading system that combines technical analysis with an intelligent probability scoring framework to identify high-quality trade setups. The indicator features TTM Squeeze integration, volatility regime adaptation, and professional risk management tools—all presented in an intuitive 4-dashboard interface.
Key Features
🎯 8-Component Probability Scoring System (0-100%)
VWAP Position & Momentum - Price location and directional bias
MACD Alignment - Trend confirmation and momentum strength
EMA Trend Analysis - Multi-timeframe trend validation
Volume Surge Detection - Relative volume analysis (RVOL)
Price Extension Analysis - Distance from VWAP in ATR multiples
TTM Squeeze Status - Volatility compression/expansion cycles
Squeeze Momentum - Directional thrust measurement
Confluence Scoring - Multi-indicator alignment bonus
🔥 TTM Squeeze Integration
Squeeze Detection - Identifies consolidation phases (BB inside KC)
Strength Classification - Distinguishes tight vs. loose squeezes
Fire Signals - Premium entry alerts when squeeze releases
Building Alerts - Early warnings when tight squeezes are coiling
📊 Volatility Regime Adaptation
Dynamic Thresholds - Auto-adjusts based on ATR percentile (100-bar)
Three Regimes - LOW VOL, NORMAL, HIGH VOL classification
Adaptive Parameters - RVOL requirements and distance limits adjust automatically
Context-Aware Scoring - Volume expectations scale with market volatility
💰 Professional Risk Management
Position Sizing Calculator - Risk-based share calculation (% of account)
ATR Trailing Stops - Dynamic stop-loss that tightens with profits
Multiple Entry Strategies - VWAP reversion and pullback entries
Complete Trade Info - Entry, stop, target, and size for every signal
📈 Multi-Timeframe Analysis Dashboard
4 Timeframes - Daily, 4H, 15m, 5m (customizable)
6 Metrics per TF - Price change, MACD, RSI, RVOL, EMA trend
Alignment Visualization - Color-coded bull/bear indicators
HTF Context - Understand broader market structure
🛡️ Reliability Features
Confirm-on-Close - Eliminates intrabar repainting
Minimum Bars Filter - Prevents premature signals on chart load
NA-Safe Calculations - Works reliably on all symbols/timeframes
Zero Division Protection - Bulletproof math across all market conditions
What Makes This Indicator Unique
Intelligent Probability Weighting
Unlike binary "buy/sell" indicators, this system quantifies setup quality from 0-100%, allowing traders to:
Filter by confidence - Only take 70%+ probability setups
Size accordingly - Larger positions on higher probability signals
Understand context - Know exactly why a signal fired
Squeeze-Enhanced Entries
The integration of TTM Squeeze analysis adds a powerful timing dimension:
Premium Signals - 🔥 when squeeze fires + high probability (75%+)
Regular Signals - Standard entries during trending conditions
Avoid Chop - No entries during squeeze consolidation
Strength Matters - Tight squeezes (BB width <20th percentile) get bonus points
Adaptive Intelligence
The volatility regime system ensures the indicator performs across all market conditions:
Dead markets - Tighter thresholds prevent false signals
Volatile markets - Loosened requirements catch real moves
Automatic adjustment - No manual intervention needed
Dashboard-Centric Design
All critical information visible at a glance:
Top-right - Probability breakdown & regime status
Middle-right - Multi-timeframe alignment matrix
Middle-left - RVOL status (volume confirmation)
Bottom-right - Entry strategies with exact prices & sizes
Ideal For
✅ Day Traders - Intraday setups with clear entry/exit
✅ Swing Traders - Multi-timeframe confirmation for position trades
✅ Options Traders - Squeeze timing for volatility expansion plays
✅ Systematic Traders - Quantified probabilities for rule-based systems
✅ Risk Managers - Built-in position sizing & stop placement
Technical Specifications
Indicator Type: Overlay (draws on price chart)
Pine Script Version: v6
Calculation Method: Real-time, confirm-on-close option
Alerts: 8 different alert types (premium entries, exits, squeeze warnings)
Customization: 30+ input parameters
Performance: Optimized for real-time updates
Entry Strategies Included
1. VWAP Reversion
Enter when price bounces off VWAP ± 0.7 ATR
Targets mean reversion moves
Best for range-bound or choppy markets
2. Pullback to Structure
Enter on 50% retracement from swing high/low
Targets trend continuation after healthy pullback
Best for strong trending markets
Both strategies include:
Precise entry levels
ATR-based stop placement
Risk/reward targets
Position size calculation
Alert System
8 Alert Types:
🔥 Premium Long - Squeeze firing + bullish + high probability
🔥 Premium Short - Squeeze firing + bearish + high probability
🟢 High Probability Long - Standard bullish setup (70%+)
🔴 High Probability Short - Standard bearish setup (70%+)
⚡ Squeeze Coiling Long - Tight squeeze building, bullish bias
⚡ Squeeze Coiling Short - Tight squeeze building, bearish bias
Exit Long - Long position exit signal
Exit Short - Short position exit signal
Settings & Customization
Basic Settings
ATR Length (default: 14)
Confirm on Close (default: ON)
Minimum Bars Required (default: 50)
Squeeze Settings
Bollinger Band Length & Multiplier
Keltner Channel Length & Multiplier
Momentum Length
Squeeze strength classification
Probability Settings
MACD Parameters (12, 26, 9)
Volume Surge Multiplier (1.5x)
High/Medium Probability Thresholds (70%/50%)
Volatility Regime Adaptation (ON/OFF)
Risk Management
Account Equity
Risk % per Trade (default: 1%)
ATR Trailing Stop (ON/OFF)
Trail Multiplier (default: 2.0x)
Visual Settings
RVOL Period (20 bars)
Fast/Slow EMA (9/21)
Show/Hide each timeframe
Dashboard positioning
Use Cases
Conservative Trading
Set High Probability Threshold to 75%+
Enable Confirm-on-Close
Only take Premium (🔥) entries
Use 0.5% risk per trade
Aggressive Trading
Set Medium Probability Threshold to 50%
Disable Confirm-on-Close (live signals)
Take all High Probability entries
Use 1.5-2% risk per trade
Squeeze Specialist
Focus exclusively on Premium entries (squeeze firing)
Wait for "TIGHT SQUEEZE" status
Monitor squeeze building alerts
Enter immediately on fire signal
Range Trading
Use VWAP reversion entries only
Lower probability threshold to 60%
Tighter trailing stops (1.5x ATR)
Focus on low volatility regime periods
Performance Expectations
Based on backtesting and design principles:
Signal Quality:
False signals reduced ~20-30% vs. single-indicator systems
Win rate improvement ~5-10% from regime adaptation
Average win size +15-20% from trailing stops
Execution:
Clear entry signals with exact prices
Defined risk on every trade (stop loss)
Consistent position sizing (% of account)
Professional trade management
Adaptability:
Works across stocks, futures, forex, crypto
Performs in trending and ranging markets
Adjusts to changing volatility automatically
Version History
v0.1.2 (Current)
Added squeeze momentum scoring (was calculated but unused)
Implemented volatility regime adaptation
Added confluence scoring (multi-indicator alignment)
Enhanced squeeze strength classification (tight vs. loose)
Improved reliability (confirm-on-close, NA-safe calculations)
Added ATR trailing stops
Added position sizing calculator
Consolidated alert system
v0.1.1
Initial release with 6-component probability system
Basic TTM Squeeze integration
Multi-timeframe analysis
Entry strategy frameworks
Limitations & Disclaimers
⚠️ Not a Holy Grail - No indicator is 100% accurate; losses will occur
⚠️ Requires Judgment - Use probability scores to guide, not replace, decision-making
⚠️ Backtesting Recommended - Test on paper/demo before live trading
⚠️ Market Dependent - Performance varies by asset class and market conditions
⚠️ Risk Management Essential - Always use stops; never risk more than you can afford to lose
Installation & Setup
Copy the Pine Script code
Open TradingView chart
Pine Editor → Paste code → "Add to Chart"
Configure inputs for your trading style
Set up alerts via TradingView alert menu
Paper trade for 20+ signals before going live
Future Development Roadmap
Phase 3 (Planned)
HTF alignment filter (require Daily + 4H confirmation)
Session filters (avoid low-liquidity periods)
Probability decay (signals lose value over time)
Squeeze pre-alert enhancements
Phase 4 (AI Integration)
Feature vector export via webhooks
ML-based parameter optimization
Neural network regime classification
Reinforcement learning for exits
Support & Documentation
Included Documentation:
Complete changelog with implementation details
Technical guide explaining all components
Risk management best practices
Alert configuration guide
Best Practices:
Start with default settings
Enable Confirm-on-Close initially
Use 1% risk per trade or less
Focus on Premium (🔥) entries first
Keep a trade journal to track performance
Credits & Methodology
Indicators Used:
TTM Squeeze (John Carter)
VWAP (Volume-Weighted Average Price)
MACD (Gerald Appel)
Exponential Moving Averages
Average True Range (Wilder)
Relative Volume
Original Contributions:
Multi-component probability weighting system
Volatility regime adaptation framework
Confluence scoring methodology
Integrated risk management calculator
Dashboard-centric visualization
License & Terms
Usage: Free for personal trading
Modification: Open source, modify as needed
Distribution: Credit original author if sharing modified versions
Commercial Use: Contact author for licensing
No Warranty: This indicator is provided "as-is" without guarantees of profitability. Trading involves substantial risk. Past performance does not guarantee future results.
Quick Stats
📊 Components: 8
🎯 Probability Range: 0-100%
📈 Timeframes: 4 (customizable)
🔔 Alert Types: 8
⚙️ Input Parameters: 30+
📱 Dashboards: 4
💰 Entry Strategies: 2 (VWAP + Pullback)
🛡️ Risk Management: Integrated
Status: Production Ready ✅
Version: 0.1.2
Last Updated: November 2025
Pine Script: v6
File Name: PA_AI_PRE_GO_v0.1.2_FIXED.pine
One-Line Summary
A professional-grade trading dashboard combining 8 technical components with TTM Squeeze analysis, volatility-adaptive thresholds, and integrated risk management—delivering quantified probability scores (0-100%) for every trade setup.
Cari dalam skrip untuk "stop loss"

Hybrid Linear Regression Channel with Fibonacci LevelsHow to Use the LRC Fib Hybrid Indicator (Detailed Guide)
1. Read the Trend
2.The thick blue line is the linear regression midline.
If it’s sloping upward → uptrend (favor longs).
If sloping downward → downtrend (favor shorts).
The gray channel bounds are ±2 standard deviations (adjustable).
3. Understand Fibonacci Levels
Fib lines are projected parallel to the regression slope using the channel width as 100%:
Red dashed lines (0.0 to 0.786): Support zones in uptrends.
Blue dashed line (0.5): Midline/neutral.
Green dashed lines (1.0 to 2.618): Resistance zones in downtrends.
Strongest levels: 0.618 (support) and 1.618 (resistance).
4. Buy Signal (Long Entry)
Triggered when:
Midline is rising (uptrend confirmed).
Price crosses above a red Fib level (0.0–0.786).
Volume > 20-period average (if confirmation enabled).
Action:
Enter long on the green triangle (▲).
Stop Loss: Below the lower gray channel or recent swing low.
Take Profit: At 1.0, 1.272, or 1.618 green Fibs.
5. Sell Signal (Short Entry)
Triggered when:
Midline is falling (downtrend).
Price crosses below a green Fib level (1.272–2.618).
Volume > average.
Action:
Enter short on the red triangle (▼).
Stop Loss: Above the upper gray channel.
Take Profit: At 1.0, 0.786, or 0.618 red Fibs.
6. Use the Info Table (Bottom-Right)
Shows live prices of all Fib levels, current trend ("Up"/"Down"), and signal status ("BUY"/"SELL"/"None").
7. Customize via Settings (Gear Icon)
Regression Length: 50–200 (shorter = faster response).
Std Dev Multiplier: 1.5–3.0 (tighter/wider channel).
Toggle Fibs: Hide unused levels to declutter.
Volume Confirmation: Turn off for pure price action.
8. Set Alerts
Right-click chart → Add Alert → Select "Buy Signal" or "Sell Signal" → Enable popup/email/webhook.
9. Best Practices
Best in trending markets (avoid chop).
Wait for volume spike on bounce.
Combine with higher timeframe bias.
Use 0.618/1.618 as primary reversal zones.
This indicator gives you adaptive trend, precise entries, volume filter, and dynamic targets — all in one clean overlay.

Advanced Psychological Levels with Dynamic Spacing═══════════════════════════════════════
ADVANCED PSYCHOLOGICAL LEVELS WITH DYNAMIC SPACING
═══════════════════════════════════════
A comprehensive psychological price level indicator that automatically identifies and displays round number levels across multiple timeframes. Features dynamic ATR-based spacing, smart crypto detection, distance tracking, and customizable alert system.
───────────────────────────────────────
WHAT THIS INDICATOR DOES
───────────────────────────────────────
This indicator automatically draws psychological price levels (round numbers) that often act as support and resistance:
- Dynamic ATR-Based Spacing - Adapts level spacing to market volatility
- Multiple Level Types - Major (250 pip), Standard (100 pip), Mid, and Intraday levels
- Smart Asset Detection - Automatically adjusts for Forex, Crypto, Indices, and CFDs
- Crypto Price Adaptation - Intelligent level spacing based on cryptocurrency price magnitude
- Distance Information Table - Real-time percentage distance to nearest levels
- Combined Level Labels - Clear identification when multiple level types coincide
- Performance Optimized - Configurable visible range and label limits
- Comprehensive Alerts - Notifications when price crosses any level type
───────────────────────────────────────
HOW IT WORKS
───────────────────────────────────────
PSYCHOLOGICAL LEVELS CONCEPT:
Psychological levels are round numbers where traders tend to place orders, creating natural support and resistance zones. These include:
- Forex: 1.0000, 1.0100, 1.0050 (pips)
- Crypto: $100, $1,000, $10,000 (whole numbers)
- Indices: 10,000, 10,500, 11,000 (points)
Why They Matter:
- Traders naturally gravitate to round numbers
- Stop losses cluster at these levels
- Take profit orders concentrate here
- Institutional algorithmic trading often targets these levels
DYNAMIC ATR-BASED SPACING:
Traditional Method:
- Fixed spacing regardless of volatility
- May be too tight in volatile markets
- May be too wide in quiet markets
Dynamic Method (Recommended):
- Uses ATR (Average True Range) to measure volatility
- Automatically adjusts level spacing
- Tighter levels in low volatility
- Wider levels in high volatility
Calculation:
1. Calculate ATR over specified period (default: 14)
2. Multiply by ATR multiplier (default: 2.0)
3. Round to nearest psychological level
4. Generate levels at dynamic intervals
Benefits:
- Adapts to market conditions
- More relevant levels in all volatility regimes
- Reduces clutter in trending markets
- Provides more detail in ranging markets
LEVEL TYPES:
Major Levels (250 pip/point):
- Highest significance
- Primary support/resistance zones
- Color: Red (default)
- Style: Solid lines
- Spacing: 2.5x standard step
Standard Levels (100 pip/point):
- Secondary importance
- Common psychological barriers
- Color: Blue (default)
- Style: Dashed lines
- Spacing: Standard step
Mid Levels (50% between major):
- Optional intermediate levels
- Halfway between major levels
- Color: Gray (default)
- Style: Dotted lines
- Usage: Additional confluence points
Intraday Levels (sub-100 pip):
- For intraday traders
- Fine-grained precision
- Color: Yellow (default)
- Style: Dotted lines
- Only shown on intraday timeframes
SMART ASSET DETECTION:
Forex Pairs:
- Detects major currency pairs automatically
- Uses pip-based calculations
- Standard: 100 pips (0.0100)
- Major: 250 pips (0.0250)
- Intraday: 20, 50, 80 pip subdivisions
Cryptocurrencies:
- Automatic price magnitude detection
- Adaptive spacing based on price:
* Under $0.10: Levels at $0.01, $0.05
* $0.10-$1: Levels at $0.10, $0.50
* $1-$10: Levels at $1, $5
* $10-$100: Levels at $10, $50
* $100-$1,000: Levels at $100, $500
* $1,000-$10,000: Levels at $1,000, $5,000
* Over $10,000: Levels at $5,000, $10,000
Indices & CFDs:
- Fixed point-based system
- Major: 500 point intervals (with 250 sub-levels)
- Standard: 100 point intervals
- Suitable for stock indices like SPX, NASDAQ
COMBINED LEVEL LABELS:
When multiple level types coincide at the same price:
- Single line drawn (highest priority color)
- Combined label shows all types
- Priority: Major > Standard > Mid > Intraday
Example Label Formats:
- "1.1000 Major" - Major level only
- "1.1000 Std + Major" - Both standard and major
- "50000 Intra + Mid + Std" - Three levels coincide
Benefits:
- Cleaner chart appearance
- Clear identification of confluence
- Reduced visual clutter
- Easy to spot high-importance levels
DISTANCE INFORMATION TABLE:
Real-time tracking of nearest levels:
Table Contents:
- Nearest major level above (price and % distance)
- Nearest standard level above (price and % distance)
- Nearest standard level below (price and % distance)
Display:
- Top right corner (configurable)
- Color-coded by level type
- Real-time percentage calculations
- Helpful for position management
Usage:
- Identify proximity to key levels
- Set realistic profit targets
- Gauge potential move magnitude
- Monitor approaching resistance/support
ALERT SYSTEM:
Comprehensive crossing alerts:
Alert Types:
- Major Level Crosses
- Standard Level Crosses
- Intraday Level Crosses
Alert Modes:
- First Cross Only: Alert once when level is crossed
- All Crosses: Alert every time level is crossed
Alert Information:
- Level type crossed
- Specific price level
- Direction (above/below)
- One alert per bar to prevent spam
Configuration:
- Enable/disable by level type
- Choose alert frequency
- Customize for your trading style
───────────────────────────────────────
HOW TO USE
───────────────────────────────────────
INITIAL SETUP:
General Settings:
1. Enable "Use Dynamic ATR-Based Spacing" (recommended)
2. Set ATR Period (14 is standard)
3. Adjust ATR Multiplier (2.0 is balanced)
Visibility Settings:
1. Set Visible Range % (10% recommended for clarity)
2. Adjust Label Offset for readability
3. Configure performance limits if needed
Level Selection:
1. Enable/disable level types based on trading style
2. Adjust line counts for each type
3. Choose line styles and colors for visibility
TRADING STRATEGIES:
Breakout Trading:
1. Wait for price to approach major or standard level
2. Monitor for consolidation near level
3. Enter on confirmed break above/beyond level
4. Stop loss just beyond the broken level
5. Target: Next major or standard level
Rejection Trading:
1. Identify major psychological level
2. Wait for price to test the level
3. Look for rejection signals (wicks, bearish/bullish candles)
4. Enter in direction of rejection
5. Stop beyond the level
6. Target: Previous level or mid-level
Range Trading:
1. Identify range between two major levels
2. Buy at lower psychological level
3. Sell at upper psychological level
4. Use standard and mid-levels for position management
5. Exit if major level breaks with volume
Confluence Trading:
1. Look for combined levels (Std + Major)
2. These represent high-probability zones
3. Use as primary support/resistance
4. Increase position size at confluence
5. Expect stronger reactions at these levels
Session-Based Trading:
1. Note opening level at session start (Asian/London/NY)
2. Trade breakouts of major levels during high-volume sessions
3. London/NY sessions: More likely to break levels
4. Asian session: More likely to respect levels (range trading)
RISK MANAGEMENT WITH PSYCHOLOGICAL LEVELS:
Stop Loss Placement:
- Place stops just beyond psychological levels
- Add buffer (5-10 pips for forex)
- Avoid exact round numbers (stop hunting risk)
- Use previous major level as maximum stop
Take Profit Strategy:
- First target: Next standard level (partial profit)
- Second target: Next major level (remaining position)
- Trail stops to breakeven at first target
- Use distance table to calculate risk/reward
Position Sizing:
- Larger positions at major levels (higher probability)
- Smaller positions at intraday levels (lower probability)
- Scale in at standard levels between major levels
- Reduce size when multiple levels are close together
TIMEFRAME CONSIDERATIONS:
Higher Timeframes (4H, Daily, Weekly):
- Focus on Major and Standard levels only
- Disable Intraday and Mid levels
- Wider level spacing expected
- Use for swing trading and position trading
Lower Timeframes (5m, 15m, 1H):
- Enable all level types
- Use Intraday levels for precision
- Tighter level spacing acceptable
- Good for day trading and scalping
Multi-Timeframe Approach:
- Identify major levels on Daily/4H charts
- Refine entries using 15m/1H intraday levels
- Trade in direction of higher timeframe bias
- Use lower timeframe levels for position management
───────────────────────────────────────
CONFIGURATION GUIDE
───────────────────────────────────────
GENERAL SETTINGS:
Dynamic ATR-Based Spacing:
- Enabled: Recommended for most markets
- Disabled: Fixed psychological levels
- ATR Period: 14 (standard), 10 (responsive), 20 (smooth)
- ATR Multiplier: 1.0-5.0 (2.0 is balanced)
VISIBILITY SETTINGS:
Visible Range %:
- 5%: Very tight range, minimal clutter
- 10%: Balanced view (recommended)
- 20%: Wide range, more context
- 50%: Maximum range, all levels visible
Label Offset:
- 10-20 bars: Close to current price
- 30-50 bars: Moderate distance
- 50-100 bars: Far from price action
Performance Limits:
- Max Historical Bars: Reduce if indicator loads slowly
- Max Labels: Reduce for cleaner chart (20-30 recommended)
LEVEL CUSTOMIZATION:
Line Count:
- Lower (1-3): Cleaner chart, fewer levels
- Medium (4-6): Balanced view
- Higher (7-10): More context, busier chart
Line Styles:
- Solid: High importance, easy to see
- Dashed: Medium importance, clear but subtle
- Dotted: Low importance, minimal visual weight
Colors:
- Use contrasting colors for different level types
- Red/Blue/Yellow default works well
- Adjust based on chart background and personal preference
DISTANCE TABLE:
Position:
- Top Right: Doesn't interfere with price action
- Top Left: Good for right-side price scale
- Bottom positions: Less common but available
Colors:
- Default (white text, dark background) works for most charts
- Match your chart theme for consistency
- Ensure text is readable against background
ALERT CONFIGURATION:
Alert by Level Type:
- Major: Most important, fewer false signals
- Standard: Balance of frequency and importance
- Intraday: Many signals, best for active traders
Alert Frequency:
- First Cross Only: Cleaner, less noise (recommended for swing trading)
- All Crosses: Every touch, good for scalping
Alert Setup in TradingView:
1. Configure desired alert types in indicator settings
2. Right-click chart → Add Alert
3. Select this indicator
4. Choose "Any alert() function call"
5. Set delivery method (mobile, email, webhook)
───────────────────────────────────────
ASSET-SPECIFIC TIPS
───────────────────────────────────────
FOREX (EUR/USD, GBP/USD, etc.):
- Major levels at x.x000, x.x500
- Standard levels at x.xx00
- Intraday levels at 20/50/80 pips
- Most effective during London/NY sessions
- Watch for "figure" levels (1.0000, 1.1000)
CRYPTOCURRENCIES (BTC, ETH, etc.):
- Enable dynamic spacing for volatile markets
- Levels adjust automatically based on price
- Watch major $1,000 increments for BTC
- $100 levels important for ETH
- Smaller caps: Use standard levels
- High volatility: Increase ATR multiplier to 3.0
STOCK INDICES (SPX, NASDAQ, etc.):
- 100-point levels most important
- 500-point levels for major S/R
- 50-point mid-levels for refinement
- Watch end-of-day for level reactions
- Futures often lead spot on level breaks
GOLD/COMMODITIES:
- Major levels at $50 increments ($1,900, $1,950)
- Standard levels at $10 increments
- Very reactive to psychological levels
- Watch for false breaks during low volume
- Best reactions during active trading hours
───────────────────────────────────────
BEST PRACTICES
───────────────────────────────────────
Chart Setup:
- Use clean price action charts
- Avoid too many indicators
- Ensure psychological levels are clearly visible
- Match colors to your chart theme
Level Selection:
- Start with Major and Standard levels only
- Add Mid and Intraday as needed
- Less is more - avoid chart clutter
- Adjust based on timeframe
Combining with Other Tools:
- Volume profile for confluence
- Trendlines intersecting psychological levels
- Moving averages near round numbers
- Fibonacci levels coinciding with psychological levels
Common Mistakes to Avoid:
- Trading every level touch (be selective)
- Ignoring volume confirmation
- Setting stops exactly at levels (stop hunting)
- Forgetting to adjust for different assets
- Over-relying on levels without price action confirmation
Performance Optimization:
- Reduce visible range for faster loading
- Lower max historical bars on lower timeframes
- Limit labels to 30-50 for clarity
- Disable unused level types
───────────────────────────────────────
EDUCATIONAL DISCLAIMER
───────────────────────────────────────
This indicator identifies psychological price levels based on round numbers that tend to act as support and resistance. The methodology includes:
- Round number detection algorithms
- ATR-based dynamic spacing calculations
- Asset-specific level determination
- Distance percentage calculations
Psychological levels are a recognized concept in technical analysis, studied by traders and institutions. However, they do not guarantee price reactions and should be used as part of a comprehensive trading strategy including proper risk management, volume analysis, and price action confirmation.
───────────────────────────────────────
USAGE DISCLAIMER
───────────────────────────────────────
This tool is for educational and analytical purposes. Psychological levels can act as support or resistance but price reactions are not guaranteed. Dynamic spacing may generate different levels in different market conditions. Always conduct independent analysis, use proper risk management, and never risk capital you cannot afford to lose. Past performance does not indicate future results.
───────────────────────────────────────
CREDITS & ATTRIBUTION
───────────────────────────────────────
Original Concept: Sonar Lab

Quantum Fluxtrend [CHE] Quantum Fluxtrend — A dynamic Supertrend variant with integrated breakout event tracking and VWAP-guided risk management for clearer trend decisions.
Summary
The Quantum Fluxtrend builds on traditional Supertrend logic by incorporating a midline derived from smoothed high and low values, creating adaptive bands that respond to market range expansion or contraction. This results in fewer erratic signals during volatile periods and smoother tracking in steady trends, while an overlaid event system highlights breakout confirmations, potential traps, or continuations with visual lines, labels, and percentage deltas from the close. Users benefit from real-time VWAP calculations anchored to events, providing dynamic stop-loss suggestions to help manage exits without manual adjustments. Overall, it layers signal robustness with actionable annotations, reducing noise in fast-moving charts.
Motivation: Why this design?
Standard Supertrend indicators often generate excessive flips in choppy conditions or lag behind in low-volatility drifts, leading to whipsaws that erode confidence in trend direction. This design addresses that by centering bands around a midline that reflects recent price spreads, ensuring adjustments are proportional to observed variability. The added event layer captures regime shifts explicitly, turning abstract crossovers into labeled milestones with trailing VWAP for context, which helps traders distinguish genuine momentum from fleeting noise without over-relying on raw price action.
What’s different vs. standard approaches?
- Baseline reference: Diverges from the classic Supertrend, which uses average true range for fixed offsets from a median price.
- Architecture differences:
- Bands form around a central line averaged from smoothed highs and lows, with offsets scaled by half the range between those smooths.
- Regime direction persists until a clear breach of the prior opposite band, preventing premature reversals.
- Event visualization draws persistent lines from flip points, updating labels based on price sustainment relative to the trigger level.
- VWAP resets at each event, accumulating volume-weighted prices forward for a trailing reference.
- Practical effect: Charts show fewer direction changes overall, with color-coded annotations that evolve from initial breakout to continuation or trap status, making it easier to spot sustained moves early. VWAP lines provide a volume-informed anchor that curves with price, offering visual cues for adverse drifts.
How it works (technical)
The process starts by smoothing high and low prices over a user-defined period to form upper and lower references. A midline sits midway between them, and half the spread acts as a base for band offsets, adjusted by a multiplier to widen or narrow sensitivity. On each bar, the close is checked against the previous bar's opposite band: crossing above expands the lower band downward in uptrends, or below contracts the upper band upward in downtrends, creating a ratcheting effect that locks in direction until breached.
Persistent state tracks the current regime, seeding initial bands from the smoothed values if no prior data exists. Flips trigger new horizontal lines at the breach level, styled by direction, alongside labels that monitor sustainment—price holding above for up-flips or below for down-flips keeps the regime, while reversal flags a trap.
Separately, at each flip, a dashed VWAP line initializes at the breach price and extends forward, accumulating the product of typical prices and volumes divided by total volume. This yields a curving reference that updates bar-by-bar. Warnings activate if price strays adversely from this VWAP, tinting the background for quick alerts.
No higher timeframe data is pulled, so all computations run on the chart's native resolution, avoiding lookahead biases unless repainting is enabled via input.
Parameter Guide
SMA Length — Controls smoothing of highs and lows for midline and range base; longer values dampen noise but increase lag. Default: 20. Trade-offs: Shortens responsiveness in trends (e.g., 10–14) but risks more flips; extend to 30+ for stability in ranging markets.
Multiplier — Scales band offsets from the half-range; higher amplifies to capture bigger swings. Default: 1.0. Trade-offs: Above 1.5 widens for volatile assets, reducing false signals; below 0.8 tightens for precision but may miss subtle shifts.
Show Bands — Toggles visibility of basic and adjusted band lines for reference. Default: false. Tip: Enable briefly to verify alignment with price action.
Show Background Color — Displays red tint on VWAP adverse crosses for visual warnings. Default: false. Trade-offs: Helps in live monitoring but can clutter clean charts.
Line Width — Sets thickness for event and VWAP lines. Default: 2. Tip: Thicker (3–5) for emphasis on key levels.
+Bars after next event — Extends old lines briefly before cleanup on new flips. Default: 20. Trade-offs: Longer preserves history (40+) at resource cost; shorter keeps charts tidy.
Allow Repainting — Permits live-bar updates for smoother real-time view. Default: false. Tip: Disable for backtest accuracy.
Extension 1 Settings (Show, Width, Size, Decimals, Colors, Alpha) — Manages dotted connector from event label to current close, showing percentage change. Defaults: Shown, width 2, normal size, 2 decimals, lime/red for gains/losses, gray line, 90% transparent background. Trade-offs: Fewer decimals for clean display; adjust alpha for readability.
Extension 2 Settings (Show, Method, Stop %, Ticks, Decimals, Size, Color, Inherit, Alpha) — Positions stop label at VWAP end, offset by percent or ticks. Defaults: Shown, percent method, 1.0%, 20 ticks, 4 decimals, normal size, white text, inherit tint, 0% alpha. Trade-offs: Percent for proportional risk; ticks for fixed distance in tick-based assets.
Alert Toggles — Enables notifications for breakouts, continuations, traps, or VWAP warnings. All default: true. Tip: Layer with chart alerts for multi-condition setups.
Reading & Interpretation
The main Supertrend line colors green for up-regimes (price above lower band) and red for down (below upper band), serving as a dynamic support/resistance trail. Flip shapes (up/down triangles) mark regime changes at band breaches.
Event lines extend horizontally from flips: green for bull, red for bear. Labels start blank and update to "Bull/Bear Cont." if price sustains the direction, or "Trap" if it reverses, with colors shifting lime/red/gray accordingly. A dotted vertical links the trailing label to the current close, mid-labeled with the percentage delta (positive green, negative red).
VWAP dashes yellow (bull) or orange (bear) from the event, curving to reflect volume-weighted average. At its end, a left-aligned label shows suggested stop price, annotated with offset details. Background red hints at weakening if price crosses VWAP opposite the regime.
Deltas near zero suggest consolidation; widening extremes signal momentum buildup or exhaustion.
Practical Workflows & Combinations
- Trend following: Enter long on green flip shapes confirmed by higher highs, using the event line as initial stop below. Trail stops to VWAP for bull runs, exiting on trap labels or red background warnings. Filter with volume spikes to avoid low-conviction breaks.
- Exits/Stops: Conservative: Set hard stops at suggested SL labels. Aggressive: Hold through minor traps if delta stays positive, but cut on regime flip. Pair with momentum oscillators for overbought pullbacks.
- Multi-asset/Multi-TF: Defaults suit forex/stocks on 15m–4H; for crypto, bump multiplier to 1.5 for volatility. Scale SMA length proportionally across timeframes (e.g., double for daily). Combine with structure tools like Fibonacci for confluence on event lines.
Behavior, Constraints & Performance
Live bars update lines and labels dynamically if repainting is allowed, but signals confirm on close for stability—flips only trigger post-bar. No higher timeframe calls, so no inherent lookahead, though volume weighting assumes continuous data.
Resources cap at 1000 bars back, 50 lines/labels max; events prune old ones on new flips to stay under budget, with brief extensions for visibility. Arrays or loops absent, keeping it lightweight.
Known limits include lag in extreme gaps (e.g., overnight opens) where bands may not adjust instantly, and VWAP sensitivity to sparse volume in illiquid sessions.
Sensible Defaults & Quick Tuning
Start with SMA 20, multiplier 1.0 for balanced response across majors. For choppy pairs: Lengthen SMA to 30, multiplier 0.8 to tighten bands and cut flips. For trending equities: Shorten to 14, multiplier 1.2 for quicker entries. If traps dominate, enable bands to inspect range compression; for sluggish signals, reduce extension bars to focus on recent events.
What this indicator is—and isn’t
This serves as a visualization and signal layer for trend regimes and breakouts, highlighting sustainment via annotations and risk cues through VWAP—ideal atop price action for confirmation. It is not a standalone system, predictive oracle, or risk calculator; always integrate with broader analysis, position sizing, and stops. Use responsibly as an educational tool.
Disclaimer
The content provided, including all code and materials, is strictly for educational and informational purposes only. It is not intended as, and should not be interpreted as, financial advice, a recommendation to buy or sell any financial instrument, or an offer of any financial product or service. All strategies, tools, and examples discussed are provided for illustrative purposes to demonstrate coding techniques and the functionality of Pine Script within a trading context.
Any results from strategies or tools provided are hypothetical, and past performance is not indicative of future results. Trading and investing involve high risk, including the potential loss of principal, and may not be suitable for all individuals. Before making any trading decisions, please consult with a qualified financial professional to understand the risks involved.
By using this script, you acknowledge and agree that any trading decisions are made solely at your discretion and risk.
Do not use this indicator on Heikin-Ashi, Renko, Kagi, Point-and-Figure, or Range charts, as these chart types can produce unrealistic results for signal markers and alerts.
Best regards and happy trading
Chervolino

Trend Catch STFR - whipsaw Reduced### Summary of the Setup
This trading system combines **SuperTrend** (a trend-following indicator based on ATR for dynamic support/resistance), **Range Filter** (a smoothed median of the last 100 candles to identify price position relative to a baseline), and filters using **VIX Proxy** (a volatility measure: (14-period ATR / 14-period SMA of Close) × 100) and **ADX** (Average Directional Index for trend strength). It's designed for trend trading with volatility safeguards.
- **Entries**: Triggered only in "tradeable" markets (VIX Proxy ≥ 15 OR ADX ≥ 20) when SuperTrend aligns with direction (green for long, red for short), price crosses the Range Filter median accordingly, and you're not already in that position.
- **Exits**: Purely price-based—exit when SuperTrend flips or price crosses back over the Range Filter median. No forced exits from low volatility/trend.
- **No Trade Zone**: Blocks new entries if both VIX Proxy < 15 AND ADX < 20, but doesn't affect open positions.
- **Overall Goal**: Enter trends with confirmed strength/volatility, ride them via price action, and avoid ranging/choppy markets for new trades.
This creates a filtered trend-following strategy that prioritizes quality entries while letting winners run.
### Advantages
- **Reduces Noise in Entries**: The VIX Proxy and ADX filters ensure trades only in volatile or strongly trending conditions, avoiding low-momentum periods that often lead to false signals.
- **Lets Winners Run**: Exits based solely on price reversal (SuperTrend or Range Filter) allow positions to stay open during temporary lulls in volatility/trend, potentially capturing longer moves.
- **Simple and Balanced**: Combines trend (SuperTrend/ADX), range (Filter), and volatility (VIX Proxy) without overcomplicating—easy to backtest and adapt to assets like stocks, forex, or crypto.
- **Adaptable to Markets**: The "OR" logic for VIX/ADX provides flexibility (e.g., enters volatile sideways markets if ADX is low, or steady trends if VIX is low).
- **Risk Control**: Implicitly limits exposure by blocking entries in calm markets, which can preserve capital during uncertainty.
### Disadvantages
- **Whipsaws in Choppy Markets**: As you noted, SuperTrend can flip frequently in ranging conditions, leading to quick entries/exits and small losses, especially if the Range Filter isn't smoothing enough noise.
- **Missed Opportunities**: Strict filters (e.g., requiring VIX ≥ 15 or ADX ≥ 20) might skip early-stage trends or low-volatility grinds, reducing trade frequency and potential profits in quiet bull/bear markets.
- **Lagging Exits**: Relying only on price flips means you might hold losing trades longer if volatility drops without a clear reversal, increasing drawdowns.
- **Parameter Sensitivity**: Values like VIX 15, ADX 20, or Range Filter's 100-candle lookback need tuning per asset/timeframe; poor choices could amplify whipsaws or over-filter.
- **No Built-in Risk Management**: Lacks explicit stops/targets, so it relies on user-added rules (e.g., ATR-based stops), which could lead to oversized losses if not implemented.
### How to Use It
This system can be implemented in platforms like TradingView (via Pine Script), Python (e.g., with TA-Lib or Pandas), or MT4/5. Here's a step-by-step guide, assuming TradingView for simplicity—adapt as needed. (If coding in Python, use libraries like pandas_ta for indicators.)
1. **Set Up Indicators**:
- Add SuperTrend (default: ATR period 10, multiplier 3—adjust as suggested in prior tweaks).
- Create Range Filter: Use a 100-period SMA of (high + low)/2, smoothed (e.g., via EMA if desired).
- Calculate VIX Proxy: Custom script for (ATR(14) / SMA(close, 14)) * 100.
- Add ADX (period 14, standard).
2. **Define Rules in Code/Script**:
- **Long Entry**: If SuperTrend direction < 0 (green), close > RangeFilterMedian, (VIX Proxy ≥ 15 OR ADX ≥ 20), and not already long—buy on bar close.
- **Short Entry**: If SuperTrend direction > 0 (red), close < RangeFilterMedian, (VIX Proxy ≥ 15 OR ADX ≥ 20), and not already short—sell short.
- **Exit Long**: If in long and (SuperTrend > 0 OR close < RangeFilterMedian)—sell.
- **Exit Short**: If in short and (SuperTrend < 0 OR close > RangeFilterMedian)—cover.
- Monitor No Trade Zone visually (e.g., plot yellow background when VIX < 15 AND ADX < 20).
3. **Backtest and Optimize**:
- Use historical data on your asset (e.g., SPY on 1H chart).
- Test metrics: Win rate, profit factor, max drawdown. Adjust thresholds (e.g., ADX to 25) to reduce whipsaws.
- Forward-test on demo account to validate.
4. **Live Trading**:
- Apply to a chart, set alerts for entries/exits.
- Add risk rules: Position size 1-2% of capital, stop-loss at SuperTrend line.
- Monitor manually or automate via bots—avoid overtrading; use on trending assets.
For the adjustments I suggested earlier (e.g., ADX 25, 2-bar confirmation), integrate them into entries only—test one at a time to isolate improvements. If whipsaws persist, combine 2-3 tweaks.

ZS Game Changer Pump & Dump DetectorZS GAME CHANGER PUMP AND DUMP DETECTOR - TOP 2 MOMENTUM TRACKER
Created by Zakaria Safri
An intelligent indicator specifically designed to identify and highlight the two most significant pump and dump candles within your selected lookback period. Perfect for traders who want to focus on the game-changing moves that truly matter in volatile markets like cryptocurrency, stocks, and forex.
CORE FEATURES
AUTOMATIC GAME CHANGER DETECTION
The indicator continuously scans your specified lookback period and automatically identifies the top 2 strongest pump candles and top 2 strongest dump candles. These game-changing candles are highlighted with distinctive gold labels and horizontal reference lines, making them instantly visible on your chart. Unlike other indicators that show every small move, this focuses exclusively on the market-moving moments that define trends and create opportunities.
INTELLIGENT PUMP AND DUMP CLASSIFICATION
Uses advanced percentage-based calculations to classify candles as pumps when price surges significantly upward and dumps when price plunges sharply downward. The detection system accounts for candle body size, wick proportions, and volume confirmation to ensure only legitimate momentum moves trigger signals. Customizable thresholds allow adaptation to any market volatility profile from calm stocks to wild altcoins.
ADVANCED WICK EXCLUSION FILTER
Eliminates false signals caused by candles with large wicks and small bodies. This filter focuses analysis exclusively on candles with substantial body sizes that indicate genuine directional conviction rather than temporary spikes followed by rejection. The body to candle ratio is fully adjustable to match your preferred signal quality standards.
VOLUME CONFIRMATION SYSTEM
Optional volume filter ensures detected pumps and dumps are backed by real market participation. The indicator compares current volume against a moving average and only triggers signals when volume exceeds your specified multiplier threshold. This eliminates low-volume noise and focuses on moves supported by institutional or crowd participation.
RALLY SEQUENCE DETECTION
Identifies and highlights consecutive sequences of pump or dump candles with colored background overlays. Green background indicates sustained buying pressure across multiple candles while red background shows sustained selling pressure. The rally detection system includes an optional one-miss allowance that prevents the sequence from breaking due to a single neutral candle.
HORIZONTAL REFERENCE LINES
Draws dashed lines from each game changer candle extending to the current bar, providing constant visual reference to the most significant support and resistance levels created by extreme momentum. The top game changer gets a thick dashed line while the second gets a dotted line for easy differentiation. Labels on the right side display the exact percentage move.
COMPREHENSIVE STATISTICS DASHBOARD
Real-time information panel showing current market status as pumping, dumping, or neutral along with the current candle percentage change. Displays the exact percentage values for top pump number 1, top pump number 2, top dump number 1, and top dump number 2. Shows running totals of all pumps and dumps detected since chart load. Tracks consecutive candle counts during active rally sequences.
TESTING AND VERIFICATION MODE
Built-in debug mode displays percentage change directly on each qualifying pump and dump candle, allowing instant verification that calculations are accurate. Shows which filters are currently active with a simple code in the dashboard. Helps traders understand exactly why certain candles qualified as game changers.
HOW THE GAME CHANGER DETECTION WORKS
SCANNING ALGORITHM
Every bar close, the indicator scans backward through your specified lookback period examining every candle's percentage change from its previous close. For bullish moves, it identifies the two candles with the largest positive percentage change that meet your threshold requirements. For bearish moves, it identifies the two candles with the largest negative percentage change meeting threshold requirements.
RANKING SYSTEM
Candles are ranked purely by their percentage move magnitude. The number 1 game changer is always the single strongest move in the lookback period. The number 2 game changer is the second strongest move. Rankings update dynamically as new candles form and old candles exit the lookback window.
VISUAL IDENTIFICATION
Game changer number 1 for both pumps and dumps receives a large gold label reading GAME CHANGER NUMBER 1 with zero transparency for maximum visibility. Game changer number 2 receives a slightly smaller gold label with partial transparency. The candle bars themselves are colored in gold instead of the standard green or red. Horizontal lines extend from the game changer price level to current bar.
FILTER APPLICATION
Only candles that pass your configured filters qualify for game changer consideration. If wick exclusion is enabled, candles with large wicks and small bodies are ignored. If volume confirmation is enabled, only candles with above-average volume qualify. This ensures game changers represent legitimate market moves rather than aberrations.
PRACTICAL APPLICATIONS
FOR CRYPTOCURRENCY TRADERS
Crypto markets experience extreme volatility with occasional massive pump and dump candles that define entire trends. This indicator instantly identifies which candles represent true market structure shifts versus normal noise. Use the game changer levels as key support and resistance for entries, exits, and stop placement. The top pump often marks the local high to watch for breakouts while the top dump marks the local low for reversal trades.
FOR DAY TRADERS
Intraday charts contain hundreds of candles but only a few truly matter for the session outcome. Game changer detection filters out 98 percent of candles to show you the 2 percent that drove the actual price movement. Enter trades on the side of the strongest recent game changer. Use game changer levels as magnet prices where algorithmic trading often returns.
FOR SWING TRADERS
On daily and four-hour timeframes, game changers represent major institutional activity or news-driven moves. The top dump often marks capitulation selling that creates reversal opportunities. The top pump often marks FOMO buying that creates resistance levels. Swing traders can build positions knowing these levels will be defended or tested multiple times.
FOR VOLATILITY ANALYSIS
Understanding which candles created the most volatility helps assess market risk. Multiple game changers clustered together indicate unstable choppy conditions. Game changers separated by many neutral candles indicate trending stable conditions. Use this context to adjust position sizing and stop distances appropriately.
FOR SUPPORT AND RESISTANCE TRADING
Game changer candles create the strongest support and resistance levels because they represent prices where massive volume transacted in short time periods. These levels have higher probability of holding on retest compared to arbitrary moving averages or pivot points. Trade bounces off game changer levels or breakouts through them.
RECOMMENDED SETTINGS BY MARKET
CRYPTOCURRENCY 15-MINUTE TO 1-HOUR CHARTS
Candle Size Threshold: 2.0 percent
Body to Candle Ratio: 0.5
Volume Multiplier: 1.5 times average
Game Changer Lookback: 100 bars
Extreme Threshold: 3.5 percent
Enable Wick Filter: Yes
Enable Volume Confirmation: Yes
Minimum Rally Candles: 3
STOCKS DAILY CHARTS
Candle Size Threshold: 1.0 percent
Body to Candle Ratio: 0.6
Volume Multiplier: 2.0 times average
Game Changer Lookback: 50 bars
Extreme Threshold: 2.5 percent
Enable Wick Filter: Yes
Enable Volume Confirmation: Yes
Minimum Rally Candles: 2
FOREX 1-HOUR TO 4-HOUR CHARTS
Candle Size Threshold: 0.5 percent
Body to Candle Ratio: 0.5
Volume Multiplier: Not applicable
Game Changer Lookback: 80 bars
Extreme Threshold: 1.0 percent
Enable Wick Filter: Yes
Enable Volume Confirmation: No
Minimum Rally Candles: 3
SCALPING 1-MINUTE TO 5-MINUTE CHARTS
Candle Size Threshold: 0.8 percent
Body to Candle Ratio: 0.4
Volume Multiplier: 1.2 times average
Game Changer Lookback: 50 bars
Extreme Threshold: 1.5 percent
Enable Wick Filter: No
Enable Volume Confirmation: Yes
Minimum Rally Candles: 2
WHAT IS INCLUDED
Automatic identification of top 2 pump candles
Automatic identification of top 2 dump candles
Gold colored game changer labels with size differentiation
Gold colored candle bars for game changers
Horizontal reference lines from game changers to current price
Regular pump and dump detection with green and red candles
Rally sequence detection with background highlighting
Extreme move detection and labeling system
Real-time statistics dashboard with all key metrics
Percentage change debug mode for verification
Volume confirmation filter with adjustable multiplier
Wick exclusion filter with adjustable body ratio
Customizable lookback period from 20 to 500 bars
Consecutive candle counter for rally tracking
Alert system for game changers, pumps, dumps, and rallies
Works on all timeframes from 1 minute to monthly
Compatible with stocks, forex, cryptocurrency, and futures
UNDERSTANDING GAME CHANGERS
WHAT MAKES A CANDLE A GAME CHANGER
A game changer is not just a large move but the largest move within context. In a volatile crypto market, a 5 percent pump might not rank in the top 2. In a stable stock, a 2 percent pump could be the number 1 game changer. The indicator adapts to your specific instrument and timeframe to find what truly matters in that context.
WHY FOCUS ON TOP 2 ONLY
Markets are driven by a small number of significant moves rather than the average of all moves. By focusing exclusively on the top 2 in each direction, traders can ignore noise and concentrate on the price levels that actually matter for support, resistance, and momentum. This creates clarity in decision making.
GAME CHANGERS AS MARKET STRUCTURE
The top pump often marks the recent high that bulls must break to continue uptrend. The top dump often marks the recent low that bears must break to continue downtrend. These become the key levels around which all other price action rotates. Understanding this structure is essential for profitable trading.
GAME CHANGERS AS SENTIMENT INDICATORS
Consecutive pump game changers signal strong bullish sentiment and FOMO conditions. Consecutive dump game changers signal fear and capitulation. Alternating pump and dump game changers signal indecision and range conditions. Read the pattern of game changers to gauge market psychology.
VERIFICATION AND TESTING
HOW TO VERIFY ACCURACY
Enable Show Debug Info on Chart in the Testing and Debug settings group. This displays the percentage change calculation directly on every qualifying pump and dump candle. Manually verify by calculating open minus close divided by close multiplied by 100. The debug percentage should match your manual calculation exactly.
HOW TO TEST FILTERS
Toggle wick exclusion filter on and off while watching how many candles qualify. With filter on, candles with long wicks and small bodies should disappear. Toggle volume confirmation on and off to see how low-volume candles get excluded. Adjust the thresholds and watch the real-time impact on signal count.
HOW TO VERIFY GAME CHANGERS
Look at your chart and visually identify which candle had the biggest green body in the lookback period. The game changer number 1 pump label should be on that exact candle. Repeat for the biggest red candle to verify game changer number 1 dump. The rankings should match your visual assessment.
LOOKBACK PERIOD EFFECTS
Decrease the lookback period to 20 bars and watch game changers update to only recent moves. Increase to 500 bars and watch game changers potentially change to older historic moves. The optimal lookback balances recency with significance. Too short misses important levels, too long includes irrelevant history.
DASHBOARD INFORMATION GUIDE
STATUS ROW
Shows PUMPING when current candle qualifies as a pump, DUMPING when current candle qualifies as a dump, or NEUTRAL when current candle does not meet threshold requirements. This updates in real-time on every bar close.
CURRENT CHANGE ROW
Displays the percentage change of the current candle from its previous close. Positive percentages indicate bullish candle, negative indicate bearish candle. This number may or may not meet your threshold to qualify as pump or dump.
TOP PUMP NUMBER 1
The highest positive percentage change found in your lookback period. This candle is marked with the large gold GAME CHANGER NUMBER 1 label below it. Shows N/A if no pumps exist in the lookback period.
TOP PUMP NUMBER 2
The second highest positive percentage change found in your lookback period. Marked with smaller gold GAME CHANGER NUMBER 2 label. Shows N/A if only one or zero pumps exist.
TOP DUMP NUMBER 1
The highest negative percentage change magnitude found in your lookback period. This candle is marked with the large gold GAME CHANGER NUMBER 1 label above it. Shows N/A if no dumps exist.
TOP DUMP NUMBER 2
The second highest negative percentage change magnitude found in your lookback period. Marked with smaller gold GAME CHANGER NUMBER 2 label. Shows N/A if only one or zero dumps exist.
TOTAL PUMPS
Running count of all pump candles detected since you loaded the indicator on this chart. This number continuously increases as new qualifying pumps form. Resets when you reload the chart.
TOTAL DUMPS
Running count of all dump candles detected since chart load. Increases as new qualifying dumps form and resets on chart reload.
CONSECUTIVE
Shows the current count of consecutive pump or dump candles during an active rally. Displays 3 UP during a 3-candle pump rally or 5 DN during a 5-candle dump rally. Shows 0 when no rally is active.
ALERT SYSTEM
GAME CHANGER DETECTED ALERT
Triggers whenever the current candle becomes one of the top 2 pumps or top 2 dumps. This is the highest priority alert indicating a market-moving event just occurred. Use this alert for immediate notification of significant opportunities.
PUMP DETECTED ALERT
Triggers on every candle that qualifies as a pump according to your threshold and filter settings. This includes regular pumps and extreme pumps but excludes game changers which have their separate alert. Use for general upward momentum monitoring.
DUMP DETECTED ALERT
Triggers on every candle that qualifies as a dump according to your settings. Includes regular and extreme dumps but excludes game changers. Use for general downward momentum monitoring.
PUMP RALLY STARTED ALERT
Triggers when consecutive pump candles reach your minimum rally threshold. Indicates the beginning of a sustained upward movement sequence. Use to catch trends early.
DUMP RALLY STARTED ALERT
Triggers when consecutive dump candles reach your minimum rally threshold. Indicates the beginning of a sustained downward movement sequence. Use for trend following or reversal timing.
ALERT MESSAGE FORMAT
All alerts include the ticker symbol and current price using TradingView placeholders. Messages are descriptive and specify which type of signal triggered. Alerts work with TradingView notification system including email, SMS, webhook, and app notifications.
TECHNICAL SPECIFICATIONS
CALCULATION METHODOLOGY
Percentage change calculated as current close minus previous close divided by previous close multiplied by 100. Body ratio calculated as absolute value of close minus open divided by high minus low. Volume elevation calculated as current volume divided by 20-period simple moving average of volume. Game changer ranking uses absolute value comparison across entire lookback array.
PERFORMANCE CHARACTERISTICS
Lightweight calculations optimized for speed on all timeframes. No repainting of signals ensuring all triggers are final on bar close. Variables properly scoped with var keyword for memory efficiency. Maximum bars back set to 500 to prevent excessive historical loading. Updates in real-time on every bar close without lag.
COMPATIBILITY
Works on all TradingView plans including free, pro, and premium. Compatible with stocks, forex, cryptocurrency, futures, indices, and commodities. Functions correctly on all timeframes from 1 second to monthly. No external data requests ensuring fast loading. Overlay true setting places directly on price chart.
RISK DISCLAIMER
This indicator is a technical analysis tool for identifying momentum and should not be used as the sole basis for trading decisions. Game changer levels can be broken during strong trends and are not guaranteed support or resistance. Pump and dump detection does not predict future price direction. Always use proper risk management with stop losses on every trade. Combine this indicator with other forms of analysis including fundamentals, market context, and risk assessment. Practice on demo accounts before live trading. Past performance of game changer signals does not guarantee future results. Trading carries substantial risk of loss and is not suitable for all investors. The creator is not responsible for trading losses incurred while using this tool.
SUPPORT AND UPDATES
Regular updates based on user feedback and market evolution. Built following PineCoders industry standards and best practices for code quality. Clean well-documented code structure for transparency and auditability. Optimized performance across all timeframes and instruments. Active development with continuous improvements and feature additions.
WHY CHOOSE ZS GAME CHANGER PUMP AND DUMP DETECTOR
Focuses on what matters by highlighting only the top 2 moves in each direction instead of cluttering your chart with every small fluctuation. Saves time by automatically identifying the most significant candles rather than requiring manual scanning. Provides clarity through visual gold labels and reference lines that make game changers unmistakable. Adapts to any market with customizable thresholds for volatility and volume. Eliminates noise with advanced wick and volume filters ensuring signal quality. Offers verification through debug mode proving calculations are accurate and trustworthy. Includes comprehensive statistics showing exact percentages and counts. Works everywhere across all markets, timeframes, and instruments without modification.
Transform your chart analysis by focusing exclusively on the game-changing moments that define trends and create opportunities.
Version 1.1 | Created by Zakaria Safri | Pine Script Version 5 | PineCoders Compliant

Total Info Indicator by MikePenzin
Install & Add to Chart
• Copy the script into Pine Editor → click Add to Chart .
• Open the ⚙️ Settings → Inputs to customize.
What It Does
• Displays key info in a floating table — trend, volume, ATR, RSI, stop loss, and more.
• Detects breakouts , smart SELL signals , and opening strength .
• Uses emojis and colours to make trends easy to read: 🟢 good, 🟡 neutral, 🔴 risky.
For Swing Traders
• Works best on Daily or 4H charts.
• Watch for 🟢 Uptrend + ⚡BUY / 🔥BUY breakout signals.
• Use ATR-based Stop Loss (shown in table).
• Avoid new entries a few days before earnings.
Suggested Setup
• 20/50/150 MA Lines: ON
• 200 MA Line: optional
• ATR Multiplier: 1.3
• Breakout Detection: ON (Volume + RSI + Trend filters)
• Smart SELLs: ON (RSI 70, EMA 20)
• Pivots: ON for quick swing levels
How to Read
• MA Row: 🟢 = price above MA (bullish).
• ATR/Stop Loss: Suggests where to place protective stop.
• Volume Info: Today’s vs 20-day average, plus pace.
• RSI & CCI: Shows momentum and overbought/oversold levels.
• Breakouts: ⚡BUY (early), 🔥BUY (confirmed).
• Smart SELLs: RSI🔴 / DIV🟣 / EMA🔵 mean potential exit zones.
Example Use
1️⃣ Find stocks with Uptrend 🟢 , rising volume, and ⚡BUY signal.
2️⃣ Enter near breakout; set Stop = shown level.
3️⃣ Take profits or trail when Smart SELLs appear or RSI peaks.
Tips
• Choose table corner under “Table Visualization.”
• Reduce clutter on small timeframes (turn off Pivots/200 MA).
• Use “Volume speed” to spot surging interest before breakouts.
• Compatible with most equities and ETFs.
Disclaimer
This script is for education & analysis only .
Not financial advice — always manage your own risk.

GRG/RGR Signal, MA, Ranges and PivotsThis indicator is a combination of several indicators.
It is a combination of two of my indicators which I solely use for trading
1. EMA 10-20-50-200, Pivots and Previous Day/Week/Month range
2. 3/4-Bar GRG / RGR Pattern (Conditional 4th Candle)
You can use them individually if you already have some of them or just use this one. Belive me when I say, this is all you need, along with market structure knowlege and even if you don’t have that, this indicator has been doing wonders for me. This is all I use. I do not use anything else.
**Note - Do checkout the indicators individually as I have added valuable information in the comment section.
It contains the following,
1. 10 EMA/SMA - configurable
2. 20 EMA/SMA - configurable
3. 50 EMA/SMA - configurable
4. 200 EMA/SMA - configurable
5. Previous Day's Range - configurable
6. Previous Week's Range - configurable
7. Previous Month's Range - configurable
8. Pivots - configurable
9. Buy Sell Signal - configurable
The Moving Averages
It is a very important combination and using it correctly with price action will strengthen your entries and exits.
The ema's or sma's added are the most powerful ones and they do definitely act as support and resistance.
The Daily/Weekly/Monthly Ranges
The Daily/Weekly/Monthly ranges are extremely important for any trader and should be used for targets and reversals.
Pivots
Pivots can provide support and resistance level. R5 and S5 can be used to check for over stretched conditions. You can customise them however you like. It is a full pivot indicator.
It is defaulted to show R5 and S5 only to reduce noise in the chart but it can be customised.
The 3/4 RGR or GRG Signal Generator
Combined with a 3/4 RGR or GRG setup can be all a trader needs.
You don't need complex strategies and SMC concepts to trade. Simple EMAs, ranges and RGR/GRG setup is the most winning combination.
This indicator can be used to identify the Green-Red-Green or Red-Green-Red pattern.
It is a price action indicator where a price action which identifies the defeat of buyers and sellers.
If the buyers comprehensively defeat the sellers then the price moves up and if the sellers defeat the buyers then the price moves down.
In my trading experience this is what defines the price movement.
It is a 3 or 4 candle pattern, beyond that i.e, 5 or more candles could mean a very sideways market and unnecessary signal generation.
How does it work?
Upside/Green signal
1. Say candle 1 is Green, which means buyers stepped in, then candle 2 is Red or a Doji, that means sellers brought the price down. Then if candle 3 is forming to be Green and breaks the closing of the 1st candle and opening of the 2nd candle, then a green arrow will appear and that is the place where you want to take your trade.
2. Here the buyers defeated the sellers.
3. Sometimes candle 3 falls short but candle 4 breaks candle 1's closing and candle 2's opening price. We can enter on candle 4.
4. Important - We need to enter the trade as soon as the price moves above the candle 1 and 2's body and should not wait for the 3rd or 4th candle to close. Ignore wicks.
5. But for a more optimised entry I have added an option to use candle’s highs and lows instead of open and close. This reduces lot of noise and provides us with more precise entry. This setting is turned on by default.
6. I have restricted it to 4 candles and that is all that is needed. More than that is a longer sideways market.
7. I call it the +-+ or GRG pattern or Green-Red-Green or Buyer-Seller-Buyer or Seller defeated or just Buyer pattern.
8. Stop loss can be candle 2's mid for safe traders (that includes me) or candle 2's body low for risky traders.
9. Back testing suggests that body low will be useless and result in more points in loss because for the bigger move this point will not be touched, so why not get out faster.
Downside/Red signal
1. Say candle 1 is Red, which means sellers stepped in, then candle 2 is Green or a Doji, that means buyers took the price up. Then if candle 3 is forming to be Red and breaks the closing of the 1st candle and opening of the 2nd candle then a Red arrow will appear and that is the place where you want to take your trade.
2. Sometimes candle 3 falls short but candle 4 breaks candle 1's closing and candle 2's opening price. We can enter on candle 4.
3. We need to enter the trade as soon as the price moves below the candle 1 and 2's body and should not wait for the 3rd or 4th candle to close.
4. But for a more optimised entry I have added an option to use candle’s highs and lows instead of open and close. This reduces lot of noise and provides us with more precise entry. This setting is turned on by default.
5. I have restricted it to 4 candles and that is all that is needed. More than that is a longer sideways market.
6. I call it the -+- or RGR pattern or Red-Green-Red or Seller-Buyer-Seller or Buyer defeated or just Seller pattern.
7. Stop loss can be candle 2's mid for safe traders ( that includes me) or candle 2's body high for risky traders.
8. Back testing suggests that body high will be useless and result in more points in loss because for the bigger move this point will not be touched, so why not get out faster.
Combining Indicators and Signal
Combining these indicators with GRG/RGR signal can be very powerful and can provide big moves.
1. MA crossover and Signal - This is very powerful and provides a very big move. Trades can be held for longer. If after taking the trade we notice that the MA crossover has happened then trades can be held for higher targets.
2. Pivots and Signal - Pivots and add a support or resistance point. Take profits on these points. R5/S5 are over streched conditions so we can start looking for reversal signals and ignore other signals
3. Intraday Range - first 1, 5, 15 min of the day - Sideways days is when price will stay in these ranges. You can take profits at these ranges or if the range is broken and we get a signal, then it can mean that the direction will be sustained.
4. Previous Day/Week/Month Ranges - These can be used as Take Profit points if the price is moving towards them after getting the signal. If the range is broken and we get a signal then it can be a strong signal. They can also be used as reversal points if a strong signal is generated.
Important Settings
1. Include 4th Candle Confirmation - You can enable or disable the 4th candle signal to avoid the noise, but at times I have noticed that the 4th candle gives a very strong signal or I can say that the strong signal falls on the 4th candle. This is mostly a coincidence.
2. Bars to check (default 10) - You can also configure how many previous bars should the signal be generated for. 10 to 30 is good enough. To backtest increase it to 2000 or 5000 for example.
3. Use Candle High/Low for confirmation instead of Candle Open/Close - More optimized entry and noise reduction. This option is now defaulted to false.
4. Show Green-Red-Green (bull) signals - Show only bull entries. Useful when I have a predefined view i.e, I know market is going to go up today.
5. Show Red-Green-Red (bear) signals - Show only bear entries. Useful when I have a predefined view i.e, I know market is going to go down today.
6. 3rd candle should be a Strong candle before considering 4th candle - This will enforce additional logic in 4 candle setup that the 3rd candle is the candle in our direction of breakout. This means something like GRGG is mandatory, which is still the default behaviour. If disabled, the 3rd candle can be any candle and 4th candle will act as our breakout candle. This behaviour has led to breakouts and breakdowns as times, hence I added this as a separate feature. Vice-versa for a RGGR.
For a 4 candle setup till now we were expecting GRGG or RGRR but we can let the system ignore the 3rd candle completely if needed.
This will result in additional signals.
7. Three intraday ranges added for index and stock traders - 1 min, 5 min and 15 min ranges will be displayed. These are disabled by default except 15 min. These are very important ranges and in sideways days the price will usually move within the 15 min. A breakout of this range and a positive signal can be a very powerful setup.
Safe traders can avoid taking a trade in this range as it can lead to fakeouts.
The line style, width, color and opacity are configurable.
Pointers/Golden Rules
1. If after taking the trade, the next candle moves in your direction and closes strong bullish or bearish, then move SL to break even and after that you can trail it.
2. If a upside trade hits SL and immediately a down side trade signal is generated on the next candle then take it. Vice versa is true.
3. Trades need to be taken on previous 2 candle's body high or low combined and not the wicks.
4. The most losses a trader takes is on a sideways day and because in our strategy the stop loss is so small that even on a sideways day we'll get out with a little profit or worst break even.
5. Hold trades for longer targets and don't panic.
6. If last 3-4 days have been sideways then there is a good probability that today will be trending so we can hold our trade for longer targets. Inverse is true when the market has been trending for 2-3 days then volatility followed by sideways is coming (DOW theory). Target to hold the trade for whole day and not exit till the day closes.
7. In general avoid trading in the middle of the day for index and stocks. Divide the day into 3 parts and avoid the middle.
8. Use Support/Resistance, 10, 20, 50, 200 EMA/SMA, Gaps, Whole/Round numbers(very imp) for identifying targets.
9. Trail your SL.
10. For indexes I would use 5 min and 15 min timeframe and at times 10 mins.
11. For commodities and crypto we can use higher timeframe as well. Look for signals during volatile time durations and avoid trading the whole day. Signal usually gives good targets on those times.
12. If a GRG or RGR pattern appears on a daily timeframe then this is our time to go big.
13. Minimum Risk to Reward should be 1:2 and for longer targets can be 1:4 to 1:10.
14. Trade with small lot size. Money management will happen automatically.
15. With small lot size and correct Risk-Reward we can be very profitable. Don't trade with big lot size.
16. Stay in the market for longer and collect points not money.
17. Very imp - Watch market and learn to generate a market view.
18. Very imp - Only 3 type of candles are needed in trading -
Strong Bullish (Big Green candle), Strong Bearish (Big Red candle),
Hammer (it is Strong Bullish), Inverse Hammer (it is Strong Bearish)
and Doji (indecision or confusion).
If on daily timeframe I see Strong Bullish candle previous day then I am biased to the upside the next day, if I see Strong Bearish candle the previous day then I am biased to the downside the next day, if I see Doji on the previous day then I am cautious the next day, if there are back to back Dojis forming in daily or weekly then I am preparing for big move so time to go big once I get the signal.
19. Most Important Candlestick pattern - Bullish and Bearish Engulfing
20. The only Chart patterns I need -
a) Falling Wedge/Channel Bullish Pattern Uptrend or Bull Flag - Buying - Forming over a couple days for intraday and forming over a couple of weeks for swing
b) Falling Wedge/Channel Bullish Pattern Downtrend or Falling Channel - Buying
c) Rising Wedge Bearish Pattern Uptrend or Rising Channel - Selling
d) Rising Wedge Bearish Pattern Downtrend or Bear flag - Selling
e) Head and Shoulder - Over a longer period not for intraday. In 15 min takes few days and for swing 1hr or 4h or daily can take few days
f) M and W pattern - Reversal Patterns - They form within the above 4 patterns, usually resulting in the break of trend line
21. How Gaps work -
a) Small Gap up in Uptrend - Market can fill the gap and reverse. The perception is that people are buying. If previous day candle was Strong Bullish then market view is up.
b) Big Gap up in Uptrend - Not news driven - Profit booking will come but may not fill the entire gap
c) Big Gap up in Uptrend - News driven, war related, tax, interest rate - Market can keep going up without stopping.
c) Flat opening in Uptrend - Big chance of market going up. If previous day candle was Strong Bullish then view is upwards, if it was Doji then still upwards.
d) Gap down in Uptrend - Market is surprised. After going down initially it can go up
e) Small Gap down in Downtrend - Market can fill the gap and keep moving down. If previous day candle was Strong Bearish then view is still down.
f) Flat opening in Downtrend - View is down, short today.
g) Big Gap down in Downtrend - Profit booking and foolish buying will come but market view is still down.
h) Gap down with News - Volatility, sideways then down.
i) Gap Up in Downtrend - Can move up - Price can move up during 2/3rd of the day and End of the day revert and close in red.
22. Go big on bearish days for option traders. Puts are better bought and Calls are better sold.
23. Cluster of green signals can lead to bigger move on the upside and vice versa for red signals.
24. Most of this is what I learned from successful traders (from the top 2%) only the indicator is mine.

3/4-Bar GRG / RGR Pattern (Conditional 4th Candle)This indicator can be used to identify the Green-Red-Green or Red-Green-Red pattern.
It is a price action indicator where a price action which identifies the defeat of buyers and sellers.
If the buyers comprehensively defeat the sellers then the price moves up and if the sellers defeat the buyers then the price moves down.
In my trading experience this is what defines the price movement.
It is a 3 or 4 candle pattern, beyond that i.e, 5 or more candles could mean a very sideways market and unnecessary signal generation.
How does it work?
Upside/Green signal
Say candle 1 is Green, which means buyers stepped in, then candle 2 is Red or a Doji, that means sellers brought the price down. Then if candle 3 is forming to be Green and breaks the closing of the 1st candle and opening of the 2nd candle, then a green arrow will appear and that is the place where you want to take your trade.
Here the buyers defeated the sellers.
Sometimes candle 3 falls short but candle 4 breaks candle 1's closing and candle 2's opening price. We can enter on candle 4.
Important - We need to enter the trade as soon as the price moves above the candle 1 and 2's body and should not wait for the 3rd or 4th candle to close. Ignore wicks.
I have restricted it to 4 candles and that is all that is needed. More than that is a longer sideways market.
I call it the +-+ or GRG pattern.
Stop loss can be candle 2's mid for safe traders (that includes me) or candle 2's body low for risky traders.
Back testing suggests that body low will be useless and result in more points in loss because for the bigger move this point will not be touched, so why not get out faster.
Downside/Red signal
Say candle 1 is Red, which means sellers stepped in, then candle 2 is Green or a Doji, that means buyers took the price up. Then if candle 3 is forming to be Red and breaks the closing of the 1st candle and opening of the 2nd candle then a Red arrow will appear and that is the place where you want to take your trade.
Sometimes candle 3 falls short but candle 4 breaks candle 1's closing and candle 2's opening price. We can enter on candle 4.
We need to enter the trade as soon as the price moves below the candle 1 and 2's body and should not wait for the 3rd or 4th candle to close.
I have restricted it to 4 candles and that is all that is needed. More than that is a longer sideways market.
I call it the -+- or RGR pattern.
Stop loss can be candle 2's mid for safe traders ( that includes me) or candle 2's body high for risky traders.
Back testing suggests that body high will be useless and result in more points in loss because for the bigger move this point will not be touched, so why not get out faster.
Important Settings
You can enable or disable the 4th candle signal to avoid the noise, but at times I have noticed that the 4th candle gives a very strong signal or I can say that the strong signal falls on the 4th candle. This is mostly a coincidence.
You can also configure how many previous bars should the signal be generated for. 10 to 30 is good enough. To backtest increase it to 2000 or 5000 for example.
Rest are self explanatory.
Pointers
If after taking the trade, the next candle moves in your direction and closes strong bullish or bearish, then move SL to break even and after that you can trail it.
If a upside trade hits SL and immediately a down side trade signal is generated on the next candle then take it. Vice versa is true.
Trades need to be taken on previous 2 candle's body high or low combined and not the wicks.
The most losses a trader takes is on a sideways day and because in our strategy the stop loss is so small that even on a sideways day we'll get out with a little profit or worst break even.
Hold targets for longer targets and don't panic.
If last 3-4 days have been sideways then there is a good probability that day will be trending so we can hold our trade for longer targets. Target to hold the trade for whole day and not exit till the day closes.
In general avoid trading in the middle of the day for index and stocks. Divide the day into 3 parts and avoid the middle.
Use Support/Resistance, 10, 20, 50, 200 EMA/SMA, Gaps, Whole/Round numbers(very imp) for identifying targets.
Trail your SL.
For indexes I would use 5 min and 15 min timeframe.
For commodities and crypto we can use higher timeframe as well. Look for signals during volatile time durations and avoid trading the whole day. Signal usually gives good targets on those times.
If a GRG or RGR pattern appears on a daily timeframe then this is our time to go big.
Minimum Risk to Reward should be 1:2 and for longer targets can be 1:4 to 1:10.
Trade with small lot size. Money management will happen automatically.
With small lot size and correct Risk-Re ward we can be very profitable. Don't trade with big lot size.
Stay in the market for longer and collect points not money.
Very imp - Watch market and learn to generate a market view.
Very imp - Only 4 candles are needed in trading - strong bullish, strong bearish, hammer, inverse hammer and doji.
Go big on bearish days for option traders. Puts are better bought and Calls are better sold.
Cluster of green signals can lead to bigger move on the upside and vice versa for red signals.
Most of this is what I learned from successful traders (from the top 2%) only the indicator is mine.

Katz Impact Wave 🚀Overview of the Katz Impact Wave 🚀
The Katz Impact Wave is a momentum oscillator designed to visualize the battle between buyers and sellers. Instead of combining bullish and bearish pressure into a single line, it separates them into two distinct "Impact Waves."
Its primary goal is to generate clear trade signals by identifying when one side gains control, but only when the market has enough volatility to be considered "moving." This built-in filter helps to avoid signals during flat or choppy market conditions.
Indicator Components: Lines & Plots
Impact Waves & Fill
Green Wave (Total Up Impulses): This line represents the cumulative buying pressure. When this line is rising, it indicates that bulls are getting stronger.
Red Wave (Total Down Impulses): This line represents the cumulative selling pressure. When this line is rising, it indicates that bears are getting stronger.
Colored Fill: The shaded area between the two waves provides an at-a-glance view of who is in control.
Lime Fill: Bulls are dominant (Green Wave is above the Red Wave).
Red Fill: Bears are dominant (Red Wave is above the Green Wave).
Background Color
The background color provides crucial context about the market state according to the indicator's logic.
Green Background: The market is in a bullish state (Green Wave is dominant) AND the Rate of Change (ROC) filter confirms the market is actively moving.
Red Background: The market is in a bearish state (Red Wave is dominant) AND the ROC filter confirms the market is actively moving.
Gray Background: The market is considered "not moving" or is in a low-volatility chop. Signals that occur when the background is gray should be viewed with extreme caution or ignored.
Symbols & Pivot Lines
▲ Blue Triangle (Up): This is your long entry signal. It appears on the bar where the Green Wave crosses above the Red Wave while the market is moving.
▼ Orange Triangle (Down): This is your short entry signal. It appears on the bar where the Red Wave crosses above the Green Wave while the market is moving.
Pivot Lines (Solid Green/Red/White Lines): These lines mark confirmed peaks of exhaustion in momentum, not price.
Green Pivot Line: Marks a peak in the Green Wave, signaling buying momentum exhaustion. This can be a warning that the uptrend is losing steam.
Red Pivot Line: Marks a peak in the Red Wave, signaling selling momentum exhaustion. This can be a warning that the downtrend is losing steam.
▼ Yellow Triangle (Compression): This rare signal appears when buying and selling exhaustion pivots happen at the same level. It signifies a point of extreme indecision or equilibrium that often occurs before a major price expansion.
Trading Rules & Strategy
This indicator provides entry signals but does not provide explicit Take Profit or Stop Loss levels. You must use your own risk management rules.
Long Trade Rules
Entry Signal: Wait for a blue ▲ triangle to appear at the top of the indicator panel.
Confirmation: Ensure the background color is green, confirming the market is in a bullish, moving state.
Action: Enter a long (buy) trade at the open of the next candle after the signal appears.
Short Trade Rules
Entry Signal: Wait for an orange ▼ triangle to appear at the bottom of the indicator panel.
Confirmation: Ensure the background color is red, confirming the market is in a bearish, moving state.
Action: Enter a short (sell) trade at the open of the next candle after the signal appears.
Take Profit (TP) & Stop Loss (SL) Ideas
You must develop and test your own exit strategy. Here are some common approaches:
Stop Loss:
Place a stop loss below the most recent significant swing low on the price chart for a long trade, or above the recent swing high for a short trade.
Use an ATR (Average True Range) based stop, such as 2x the ATR value below your entry for a long, to account for market volatility.
Take Profit:
Opposite Signal: The simplest exit is to close your trade when the opposite signal appears (e.g., close a long trade when a short signal ▼ appears).
Momentum Exhaustion: For a long trade, consider taking partial or full profit when a green Pivot Line appears, signaling that buying momentum is peaking.
Fixed Risk/Reward: Use a predetermined risk/reward ratio (e.g., 1:1.5 or 1:2).
Disclaimer
This indicator is a tool for analysis, not a financial advisor or a guaranteed profit system. All trading and investment activities involve substantial risk. You should not risk more than you are prepared to lose. Past performance is not an indication of future results. You are solely responsible for your own trading decisions, risk management, and for backtesting this or any other tool before using it in a live trading environment. This indicator is for educational purposes only.

RSI Crossover AlertRSI Crossover Alert Indicator - User Guide
The RSI Crossover Alert Indicator is a comprehensive technical analysis tool that detects multiple types of RSI crossovers and generates real-time alerts. It combines traditional RSI analysis with signal lines, divergence detection, and multi-level crossing alerts.
1. Multiple Crossover Detection
- RSI/Signal Line Cross: Signals a primary trend change.
- RSI/Second Signal Cross: Confirmation signals for stronger trends.
- Level Crossings: Crosses of Overbought 70, Oversold 30, and Midline 50.
- Divergence Detection: Hidden and regular divergences for reversal signals.
2. Alert Types
- Alert: RSI > Signal
Description: Bullish momentum is building.
Signal: Consider long positions.
- Alert: RSI < Signal
Description: Bearish momentum is building.
Signal: Consider short positions.
- Alert: RSI > 70
Description: Entering the overbought zone.
Signal: Prepare for a potential reversal.
- Alert: RSI < 30
Description: Entering the oversold zone.
Signal: Watch for a bounce opportunity.
- Alert: RSI crosses 50
Description: A shift in momentum.
Signal: Trend confirmation.
3. Visual Components
- Lines: RSI blue, Signal orange, Second Signal purple
- Histogram: Visualizes momentum by showing the difference between RSI and the Signal line.
- Background Zones: Red overbought, Green oversold
- Markers: Up/down triangles to indicate crossovers.
- Info Table: Real-time RSI values and status.
Strategy 1: Classic Crossover
- Entry Long: RSI crosses above the Signal Line AND RSI is below 50.
- Entry Short: RSI crosses below the Signal Line AND RSI is above 50.
- Take Profit: On the opposite signal.
- Stop Loss: At the recent swing high/low.
Strategy 2: Extreme Zone Reversal
- Entry Long: RSI is below 30 and crosses above the Signal Line.
- Entry Short: RSI is above 70 and crosses below the Signal Line.
- Risk Management: Higher win rate but fewer signals. Use a minimum 2:1 risk-reward ratio.
Strategy 3: Divergence Trading
- Setup: Enable divergence alerts and look for price/RSI divergence. Wait for an RSI crossover for confirmation.
- Entry: Enter on the crossover after the divergence appears. Place the stop loss beyond the starting point of the divergence.
Strategy 4: Multi-Timeframe Confirmation
1. Check the higher timeframe e.g. Daily to identify the main trend.
2. Use the current timeframe e.g. 4H/1H for your entry.
3. Only enter in the direction of the main trend.
4. Use the RSI crossover as the entry trigger.
Optimal Settings by Market
- Forex Major Pairs
RSI Length: 14, Signal Length: 9, Overbought/Oversold: 70/30
- Crypto High Volatility
RSI Length: 10-12, Signal Length: 6-8, Overbought/Oversold: 75/25
- Stocks Trending
RSI Length: 14-21, Signal Length: 9-12, Overbought/Oversold: 70/30
- Commodities
RSI Length: 14, Signal Length: 9, Overbought/Oversold: 80/20
Risk Management Rules
1. Position Sizing: Never risk more than 1-2% on a single trade. Reduce size in ranging markets.
2. Stop Loss Placement: Place stops beyond the recent swing high/low for crossovers. Using an ATR-based stop is also effective.
3. Profit Taking: Take partial profits at a 1:1 risk-reward ratio. Switch to a trailing stop after reaching 2:1.
1. Filtering Signals
- Combine with volume indicators.
- Confirm the trend on a higher timeframe.
- Wait for candlestick pattern confirmation.
2. Avoid Common Mistakes
- Don't trade every single crossover.
- Avoid taking signals against a strong trend.
- Do not ignore risk management.
3. Market Conditions
- Trending Market: Focus on midline 50 crosses.
- Ranging Market: Look for reversals from overbought/oversold levels.
- Volatile Market: Widen the overbought/oversold levels.
- If you get too many false signals:
Increase the signal line period, add other confirmation indicators, or use a higher timeframe.
- If you are missing major moves:
Decrease the RSI length, shorten the signal line period, or check your alert settings.
Recommended Combinations
1. RSI + MACD: For dual momentum confirmation.
2. RSI + Bollinger Bands: For volatility-adjusted signals.
3. RSI + Volume: To confirm the strength of a signal.
4. RSI + Moving Averages: To use as a trend filter.
This indicator provides a comprehensive RSI analysis. Success depends on proper configuration, risk management, and combining signals with the overall market context. Start with the default settings, then optimize based on your trading style and market conditions.

Market Pulse Dip RadarThis indicator is designed to help traders spot meaningful dips in price and then evaluate whether those dips are worth trading or not. It doesn’t just mark a dip; it also helps with risk management, trade planning, and filtering out weak signals.
Here’s how it works:
First, it looks at the recent high price and checks how much the market has dropped from that high. If the drop is larger than the minimum percentage you set, it marks it as a potential dip.
Next, it checks the trend structure by using two moving averages (a fast one and a slow one). If the fast average is below the slow average, it means the market is in a weaker structure, and that dip is considered more valid.
On top of that, you can enable a multi-timeframe filter. For example, if you are trading on the 15-minute chart, you can ask the indicator to confirm that the 1-hour trend is also supportive before showing you a dip. This helps avoid trading against the bigger trend.
Risk management is built in. The indicator automatically suggests a stop-loss by combining volatility (ATR) and recent swing lows. It then draws three profit target levels (1x risk, 2x risk, and 3x risk). This makes it easier to plan where to exit if the trade works.
A key part of this tool is the confidence score. Each dip signal is rated from 0 to 100. The score depends on how deep the dip is, how far apart the moving averages are, how healthy volatility is, and whether the higher timeframe supports the trade. The score is then labeled as High, Medium, Low, or Wait. This helps traders focus only on the stronger setups.
On the chart, dip signals are marked with a diamond shape under the bars. The color of the diamond tells you if it’s high, medium, or low quality. When a signal appears, the indicator also plots horizontal lines for the entry, stop, and targets.
To make it easier to read, there is also a dashboard box that shows the current score, quality, dip percentage, and suggested stop-loss. This means you don’t have to calculate or check different things yourself – everything is visible in one place.
Finally, it comes with alerts. You can set alerts for when a dip signal happens, or when it’s medium or high confidence. This way, you don’t need to stare at charts all day; TradingView can notify you.
So in short, this tool:
• Finds dips based on your rules.
• Filters them using structure, volatility, and higher timeframe trend.
• Suggests stop-loss and profit targets.
• Rates each dip with a confidence score.
• Shows all this info in a clean dashboard and alerts you when it happens.
👉 Do you want me to now explain how a trader would actually use it in practice (step by step, from signal to trade)?
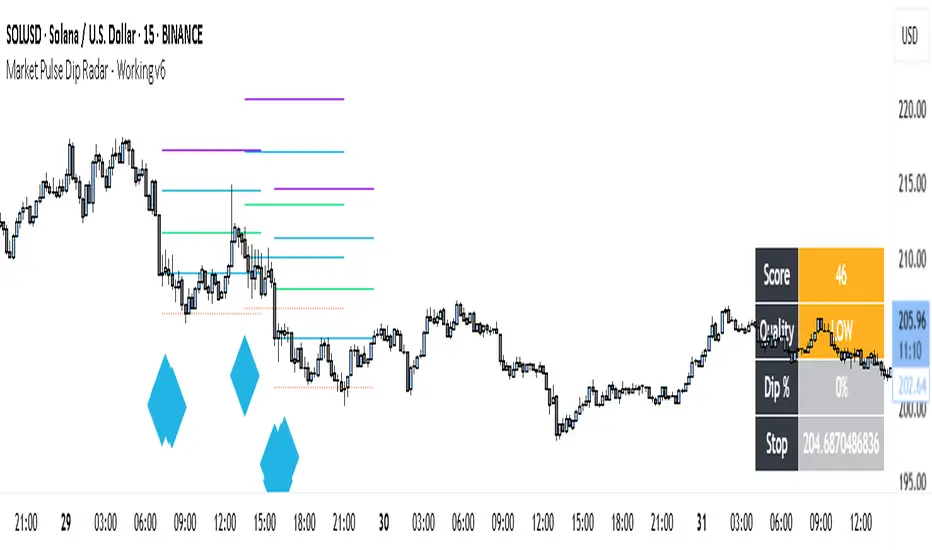
Range TableThe Range Table indicator calculates and displays the Daily Average True Range (ATR), the current day's True Range (TR), and two customizable ATR percentage values in a clean table format. It provides values in ticks, points, and USD, helping traders set stop-loss buffers based on market volatility.
**Features:**
- Displays the Daily ATR (14-period) and current day's True Range (TR) with its percentage of the Daily ATR.
- Includes two customizable ATR percentages (default: 75% and 10%, with the second disabled by default).
- Shows values in ticks, points, and USD based on the symbol's tick size and point value.
- Customizable table position, background color, text color, and font size.
- Toggle visibility for the table and percentage rows via input settings.
**How to Use:**
1. Add the indicator to your chart.
2. Adjust the table position, colors, and font size in the input settings.
3. Enable or disable the 75% and 10% ATR rows or customize their percentages.
4. Use the displayed values to set stop-loss or take-profit levels based on volatility.
**Ideal For:**
- Day traders and swing traders looking to set volatility-based stop-losses.
- Users analyzing tick, point, and USD-based risk metrics.
**Notes:**
- Ensure your chart is set to a timeframe that aligns with the daily ATR calculations.
- USD values are approximate if `syminfo.pointvalue` is unavailable.
Developed by FlyingSeaHorse.

Ayman Entry Signal – Ultimate PRO (Scalping Gold Settings)1. Overview
This indicator is a professional gold scalping tool built for TradingView using Pine Script v6.
It combines multiple price action and technical filters to generate high-probability Buy/Sell signals with built-in trade management features (TP1, TP2, SL, Break Even, Partial Close, Stats tracking).
It is optimized for XAUUSD but can be applied to other assets with proper setting adjustments.
2. Key Features
Multi-Condition Trade Signals – EMA trend, Break of Structure, Order Blocks, FVG, Liquidity Sweeps, Pin Bars, Higher Timeframe confirmation, Trend Cloud, SMA Cross, and ADX.
Full Trade Management – Auto-calculates lot size, SL, TP1, TP2, Break Even, Partial Close.
Dynamic Chart Drawing – Entry lines, SL/TP lines, trade boxes, and real-time PnL.
Statistics Panel – Tracks wins, losses, breakeven trades, and total PnL over selected dates.
Customizable Filters – All filters can be turned ON/OFF to match your strategy.
3. Main Inputs & Settings
Account Settings
Capital ($) – Total trading capital.
Risk Percentage (%) – Risk per trade.
TP to SL Ratio – Risk-to-reward ratio.
Value Per Point ($) – Value per pip/point for lot size calculation.
SL Buffer – Extra points added to SL to avoid stop hunts.
Take Profit Settings
TP1 % of Full Target – Fraction of TP1 compared to TP2.
Move SL to Entry after TP1? – Activates Break Even after TP1.
Break Even Buffer – Extra points when moving SL to BE.
Take Partial Close at TP1 – Option to close half at TP1.
Signal Filters
ATR Period – For SL/TP calculation buffer.
EMA Trend – Uses EMA 9/21 crossover for trend.
Break of Structure (BoS) – Requires structure break confirmation.
Order Block (OB) – Validates trades within OB zones.
Fair Value Gap (FVG) – Confirms trades inside FVGs.
Liquidity Sweep – Checks if liquidity zones are swept.
Pin Bar Confirmation – Uses candlestick patterns for extra confirmation.
Pin Bar Body Ratio – Controls strictness of Pin Bar filter.
Higher Timeframe Filters (HTF)
HTF EMA Confirmation – Confirms lower timeframe trades with higher timeframe trend.
HTF BoS – Confirms with higher timeframe structure break.
HTF Timeframe – Selects higher timeframe.
Advanced Filters
SuperTrend Filter – Confirms trades based on SuperTrend.
ADX Filter – Filters out low volatility periods.
SMA Cross Filter – Uses SMA 8/9 cross as filter.
Trend Cloud Filter – Uses EMA 50/200 as a cloud trend filter.
4. How It Works
Buy Signal Conditions
EMA 9 > EMA 21 (trend bullish)
Optional filters (BoS, OB, FVG, Liquidity Sweep, Pin Bar, HTF confirmations, ADX, SMA Cross, Trend Cloud) must pass if enabled.
When all active filters pass → Buy signal triggers.
Sell Signal Conditions
EMA 9 < EMA 21 (trend bearish)
Same filtering process but for bearish conditions.
When all active filters pass → Sell signal triggers.
5. Trade Execution & Management
When a signal triggers:
Lot size is auto-calculated based on risk % and SL distance.
SL is placed beyond recent swing high/low + ATR buffer.
TP1 and TP2 are calculated from the SL using the reward-to-risk ratio.
Break Even: If enabled, SL moves to entry price after TP1 is hit.
Partial Close: If enabled, half of the position closes at TP1.
Trade Exit: Full exit at TP2, SL hit, or partial close at TP1.
6. Chart Display
Entry Line – Shows entry price.
SL Line – Red dashed line at stop loss level.
TP1 Line – Lime dashed line for TP1.
TP2 Line – Green dashed line for TP2.
PnL Labels – Displays real-time profit/loss in $.
Trade Box – Visual area showing trade range.
Pin Bar Shapes – Optional, marks Pin Bars.
7. Statistics Panel
Stats Header – Shows “Stats”.
Total Trades
Wins
Losses
Breakeven Trades
Total PnL
Can be reset or filtered by date.
8. How to Use
Load the Indicator in TradingView.
Select Gold (XAUUSD) on your preferred scalping timeframe (1m, 5m, 15m).
Adjust settings:
Use default gold scalping settings for quick start.
Enable/disable filters according to your style.
Wait for a Buy/Sell alert.
Confirm visually that all desired conditions align.
Place trade with calculated lot size, SL, and TP levels shown on chart.
Let trade run – the indicator manages Break Even & Partial Close if enabled.
9. Recommended Timeframes
Scalping: 1m, 5m, 15m
Day Trading: 15m, 30m, 1H
Swing: 4H, Daily (adjust settings accordingly)

Opening Range v3 (Dynamic)Opening Range Signals v3 (Dynamic) - Indicator Guide
Created by: MecarderoAurum
Why This Indicator Exists: An Overview
The "Opening Range Signals" indicator is a sophisticated tool designed for day traders who focus their strategy on the price action that unfolds during the Regular Trading Hours (RTH) of the New York session (09:30 - 16:00 ET). The opening period of the market, often called the "initial balance," is a critical time where institutions and traders establish the early high and low for the day. Trading the breakout of this range is a classic and effective strategy, but it's often plagued by false moves and "head fakes."
This indicator was built to solve that problem. It not only identifies the initial range but also incorporates a powerful dynamic expansion feature. This allows the indicator to intelligently adapt to early session volatility, filter out false breakouts, and establish more reliable support and resistance levels for the rest of the trading day. It provides a clear, visual framework for executing opening range strategies with more confidence.
Key Features & How to Use Them
1. Customizable Opening Range
This is the foundation of the indicator. It draws the high and low of the initial trading period on your chart.
What it does: Establishes the initial support and resistance levels for the day.
How to use it: In the settings under "Time Settings," you can set the "Opening Range Duration" from 1 to 30 minutes. A shorter duration (e.g., 5 minutes) will be more sensitive and give earlier signals, while a longer duration (e.g., 30 minutes) will establish a wider, more robust range.
2. Dynamic Range Expansion
This is the indicator's most powerful and unique feature. It helps you avoid getting trapped in false breakouts.
What it does: If the price breaks out of the initial range but then quickly closes back inside, the indicator will automatically expand the range to include the full wick of the failed breakout. This tells you the market is still establishing its true range.
How to use it: In the settings under "Dynamic Range," you can:
"Enable Dynamic Range Expansion": This is on by default.
"Expansion Time Limit (Min)": Set how long the indicator should look for these failed breakouts. After this time, the range will be locked for the day.
3. Clear Visual Trading Signals
The indicator provides three distinct signals to help you interpret the price action around the opening range.
Breakout Body (Yellow plotshape):
What it means: The first confirmation that the price has decisively moved outside the established range. It appears when a candle's body closes entirely above the high or below the low.
How to use it: This is your alert that a potential breakout is underway. Do not enter yet; wait for confirmation.
Continuation (Green plotshape):
What it means: This signal appears on the candle immediately following a breakout if it shows momentum in the same direction. It confirms that the breakout has strength.
How to use it: This is a potential entry trigger. A continuation signal suggests the breakout is valid and may continue.
Failure (Red plotshape):
What it means: This signal appears if, after a breakout and continuation, the price quickly reverses and closes back inside the range. It's a strong indication of a false breakout.
How to use it: If you are in a breakout trade, a failure signal is a clear sign to exit. It can also be used as a setup for a reversal trade in the opposite direction.
Sample Strategy: The Breakout-Continuation Trade
This strategy uses the indicator's signals to trade a classic opening range breakout with added confirmation.
Setup:
Set the "Opening Range Duration" to your preferred time (e.g., 5 or 15 minutes).
Ensure the "Dynamic Range Expansion" is enabled to filter out early noise.
Entry Trigger:
Wait for a Breakout signal (yellow) to appear. This puts you on high alert.
Wait for a Continuation signal (green) on the very next candle. This is your entry trigger. Enter a long trade on a bullish continuation or a short trade on a bearish continuation.
Stop-Loss:
For a bullish (long) trade, a common stop-loss placement is just below the low of the continuation candle or, for a more conservative stop, just inside the opening range high.
For a bearish (short) trade, place your stop-loss just above the high of the continuation candle or just inside the opening range low.
Trade Management:
If a Failure signal (red) appears after you've entered, it indicates the breakout has failed. This is a strong signal to exit your trade immediately to protect your capital.
If the trade moves in your favor, you can manage it by taking profits at key levels or using a trailing stop.

Share SizePurpose: The "Share Size" indicator is a powerful risk management tool designed to help traders quickly determine appropriate share/contract sizes based on their predefined risk per trade and the current market's volatility (measured by ATR). It calculates potential dollar differences from recent highs/lows and translates them into a recommended share/contract size, accounting for a user-defined ATR-based offset. This helps you maintain consistent risk exposure across different instruments and market conditions.
How It Works: At its core, the indicator aims to answer the question: "How many shares/contracts can I trade to keep my dollar risk within limits if my stop loss is placed at a recent high or low, plus an ATR-based buffer?"
Price Difference Calculation: It first calculates the dollar difference between the current close price and the high and low of the current bar (Now) and the previous 5 bars (1 to 5).
Tick Size & Value Conversion: These price differences are then converted into dollar values using the instrument's specific tickSize and tickValue. You can select common futures contracts (MNQ, MES, MGC, MCL), a generic "Stock" setting, or define custom values.
ATR Offset: An Average True Range (ATR) based offset is added to these dollar differences. This offset acts as a buffer, simulating a stop loss placed beyond the immediate high/low, accounting for market noise or volatility.
Risk-Based Share Size: Finally, using your Default Risk ($) input, the indicator calculates how many shares/contracts you can take for each of the 6 high/low scenarios (current bar, 5 previous bars) to ensure your dollar risk per trade remains constant.
Dynamic Table: All these calculations are presented in a clear, real-time table at the bottom-left of your chart. The table dynamically adjusts its "Label" to show the selected symbol preset, making it easy to see which instrument's settings are currently being used. The "Shares" rows indicate the maximum shares/contracts you can trade for a given risk and stop placement. The cells corresponding to the largest dollar difference (and thus smallest share size) for both high and low scenarios are highlighted, drawing your attention to the most conservative entry points.
Key Benefits:
Consistent Risk: Helps maintain a consistent dollar risk per trade, regardless of the instrument or its current price/volatility.
Dynamic Sizing: Automatically adjusts share/contract size based on market volatility and your chosen stop placement.
Quick Reference: Provides a real-time, easy-to-read table directly on your chart, eliminating manual calculations.
Informed Decision Making: Assists in quickly assessing trade opportunities and potential position sizes.
Setup Parameters (Inputs)
When you add the "Share Size" indicator to your chart, you'll see a settings dialog with the following parameters:
1. Symbol Preset:
Purpose: This is the primary setting to define the tick size and value for your chosen trading instrument.
Options:
MNQ (Micro Nasdaq 100 Futures)
MES (Micro E-mini S&P 500 Futures)
MGC (Micro Gold Futures)
MCL (Micro Crude Oil Futures)
Stock (Generic stock setting, with tick size/value of 0.01)
Custom (Allows you to manually input tick size and value)
Default: MNQ
Importance: Crucial for accurate dollar calculations. Ensure this matches the instrument you are trading.
2. Tick Size (Manual Override):
Purpose: Only used if Symbol Preset is set to Custom. This defines the smallest price increment for your instrument.
Type: Float
Default: 0.25
Hidden: This input is hidden (display=display.none) unless "Custom" is selected. You might need to change display=display.none to display=display.inline in the code if you want to see and adjust it directly in the settings for "Custom" mode.
3. Tick Value (Manual Override):
Purpose: Only used if Symbol Preset is set to Custom. This defines the dollar value of one tickSize increment.
Type: Float
Default: 0.50
Hidden: This input is hidden (display=display.none) unless "Custom" is selected. Similar to Tick Size, you might need to adjust its display property if you want it visible.
4. Default Risk ($):
Purpose: This is your maximum desired dollar risk per trade. All share size calculations will be based on this value.
Type: Float
Default: 50.0
Hidden: This input is hidden (display=display.none). It's a critical setting, so consider making it visible by changing display=display.none to display=display.inline in the code if you want users to easily adjust their risk.
ATR Offset Settings (Group): This group of settings allows you to fine-tune the ATR-based buffer added to your potential stop loss.
5. ATR Offset Length:
Purpose: Defines the lookback period for the Average True Range (ATR) calculation used for the offset.
Type: Integer
Default: 7
Hidden: This input is hidden (display=display.none).
6. ATR Offset Timeframe:
Purpose: Specifies the timeframe on which the ATR for the offset will be calculated. This allows you to use ATR from a higher timeframe for your stop buffer, even if your chart is on a lower timeframe.
Type: Timeframe string (e.g., "1" for 1 minute, "60" for 1 hour, "D" for Daily)
Default: "1" (1 Minute)
Hidden: This input is hidden (display=display.none).
7. ATR Offset Multiplier (x ATR):
Purpose: Multiplies the calculated ATR value to determine the final dollar offset added to your high/low price difference. A value of 1.0 means one full ATR is added. A value of 0.5 means half an ATR is added.
Type: Float
Minimum Value: 0 (no offset)
Default: 1.0
Hidden: This input is hidden (display=display.none).

CVD Divergence & Volume ProfileThis Pine Script indicator, named "CVD Divergence & Volume Profile," is designed to identify potential trading opportunities by combining Cumulative Volume Delta (CVD) divergence with Volume Profile levels and an optional Simple Moving Average (SMA) trend filter. It plots signals directly on the price chart.
Here's a breakdown of what each component does and how to potentially trade with it:
1. Cumulative Volume Delta (CVD) Divergence
What it does: CVD measures the cumulative difference between buying and selling volume. A rising CVD indicates more buying pressure, while a falling CVD indicates more selling pressure. Divergence occurs when the price action contradicts the CVD's direction, suggesting a potential shift in momentum or trend reversal.
Bearish Divergence: The price makes a higher high, but the CVD makes a lower high (or fails to make a new high). This suggests that despite the price increasing, the underlying buying pressure is weakening.
Bullish Divergence: The price makes a lower low, but the CVD makes a higher low (or fails to make a new low). This suggests that despite the price decreasing, the underlying selling pressure is weakening.
Visualization:
Red triangle pointing down on the chart indicates a Bearish Divergence signal.
Green triangle pointing up on the chart indicates a Bullish Divergence signal.
2. Volume Profile Levels (VAH, VAL, POC)
What it does: The indicator calculates simplified Volume Profile levels over a user-defined vp_range (number of candles). These levels represent areas where significant trading activity has occurred:
VAH (Value Area High): The upper boundary of the "Value Area," where 70% of the volume traded.
VAL (Value Area Low): The lower boundary of the "Value Area," where 70% of the volume traded.
POC (Point of Control): The price level within the vp_range where the most volume was traded.
Significance: These levels often act as significant support and resistance zones.
Visualization:
Orange lines for VAH and VAL.
Yellow line for POC.
Zone Proximity (zone_thresh): The indicator only generates divergence signals if the current close price is within a specified percentage zone_thresh of either VAH, VAL, or POC. This filters signals to areas of high liquidity and potential turning points.
3. Trend Filter (SMA)
What it does: This is an optional filter (use_trend_filter) that uses a Simple Moving Average (sma_period, default 200).
Significance: It helps ensure that divergence signals are traded in alignment with the broader market trend, potentially increasing their reliability.
For long signals (bullish divergence), the price (close) must be above the SMA (indicating an uptrend).
For short signals (bearish divergence), the price (close) must be below the SMA (indicating a downtrend).
Visualization: A blue line on the chart representing the SMA.
How to Trade with It (Potential Strategies)
The indicator aims to provide high-probability entry points by combining multiple confirming factors. Here's how you might interpret and trade the signals:
Identify Divergence: Look for the triangle signals on your chart (red for bearish, green for bullish).
Confirm Proximity to Volume Profile Levels: The signal itself confirms that the price is near a significant Volume Profile level (VAH, VAL, or POC). These are areas where price often reacts.
Bullish Signal (Green Triangle): This suggests buying momentum is returning after a price decline, especially when the price is near VAL or POC, which might act as support.
Bearish Signal (Red Triangle): This suggests selling momentum is increasing after a price rally, especially when the price is near VAH or POC, which might act as resistance.
Check Trend Alignment (SMA Filter):
For a long trade: You would ideally want to see a green triangle (bullish divergence) while the price is above the blue SMA line. This indicates a bullish divergence confirming a potential bounce within an existing uptrend.
For a short trade: You would ideally want to see a red triangle (bearish divergence) while the price is below the blue SMA line. This indicates a bearish divergence confirming a potential rejection within an existing downtrend.
Entry and Exit Considerations:
Entry: Consider entering a trade on the candle where the signal appears, or on the subsequent candle for confirmation.
Stop Loss: For a long trade, a logical stop-loss could be placed below the lowest point of the divergence, or below the VAL/POC if the signal occurred near it. For a short trade, above the highest point of the divergence or VAH/POC.
Take Profit: Targets could be set at the opposite Volume Profile level, previous swing highs/lows, or using a fixed risk-reward ratio.
Example Trading Scenario:
Long Trade: You see a green triangle (bullish divergence) printed on the chart. You notice the price is currently at the VAL (orange line). You check the blue SMA line and confirm that the price is above it (uptrend). This confluence of factors (bullish divergence, support at VAL, and uptrend) provides a strong potential long entry signal. You might enter, place your stop loss just below VAL, and target VAH or the next resistance level.
Short Trade: You see a red triangle (bearish divergence). The price is at the VAH (orange line). The price is also below the blue SMA line (downtrend). This suggests a potential short entry. You might enter, place your stop loss just above VAH, and target VAL or the next support level.

Adaptive Volume‐Demand‐Index (AVDI)Demand Index (according to James Sibbet) – Short Description
The Demand Index (DI) was developed by James Sibbet to measure real “buying” vs. “selling” strength (Demand vs. Supply) using price and volume data. It is not a standalone trading signal, but rather a filter and trend confirmer that should always be used together with chart structure and additional indicators.
---
\ 1. Calculation Basis\
1. Volume Normalization
$$
\text{normVol}_t
= \frac{\text{Volume}_t}{\mathrm{EMA}(\text{Volume},\,n_{\text{Vol}})_t}
\quad(\text{e.g., }n_{\text{Vol}} = 13)
$$
This smooths out extremely high volume spikes and compares them to the average (≈ 1 means “average volume”).
2. Price Factor
$$
\text{priceFactor}_t
= \frac{\text{Close}_t - \text{Open}_t}{\text{Open}_t}.
$$
Positive values for bullish bars, negative for bearish bars.
3. Component per Bar
$$
\text{component}_t
= \text{normVol}_t \times \text{priceFactor}_t.
$$
If volume is above average (> 1) and the price rises slightly, this yields a noticeably positive value; conversely if the price falls.
4. Raw DI (Rolling Sum)
Over a window of \$w\$ bars (e.g., 20):
$$
\text{RawDI}_t
= \sum_{i=0}^{w-1} \text{component}_{\,t-i}.
$$
Alternatively, recursively for \$t \ge w\$:
$$
\text{RawDI}_t
= \text{RawDI}_{t-1}
+ \text{component}_t
- \text{component}_{\,t-w}.
$$
5. Optional EMA Smoothing
An EMA over RawDI (e.g., \$n\_{\text{DI}} = 50\$) reduces short-term fluctuations and highlights medium-term trends:
$$
\text{EMA\_DI}_t
= \mathrm{EMA}(\text{RawDI},\,n_{\text{DI}})_t.
$$
6.Zero Line
Handy guideline:
RawDI > 0: Accumulated buying power dominates.
RawDI < 0: Accumulated selling power dominates.
2. Interpretation & Application
Crossing Zero
RawDI above zero → Indication of increasing buying pressure (potential long signal).
RawDI below zero → Indication of increasing selling pressure (potential short signal).
Not to be used alone for entry—always confirm with price action.
RawDI vs. EMA_DI
RawDI > EMA\_DI → Acceleration of demand.
RawDI < EMA\_DI → Weakening of demand.
Divergences
Price makes a new high, RawDI does not make a higher high → potential weakness in the uptrend.
Price makes a new low, RawDI does not make a lower low → potential exhaustion of the downtrend.
3. Typical Signals (for Beginners)
\ 1. Long Setup\
RawDI crosses zero from below,
RawDI > EMA\_DI (acceleration),
Price closes above a short-term swing high or resistance.
Stop-Loss: just below the last swing low, Take-Profit/Trailing: on reversal signals or fixed R\:R.
2. Short Setup
RawDI crosses zero from above,
RawDI < EMA\_DI (increased selling pressure),
Price closes below a short-term swing low or support.
Stop-Loss: just above the last swing high.
---
4. Notes and Parameters
Recommended Values (Beginners):
Volume EMA (n₍Vol₎) = 13
RawDI window (w) = 20
EMA over DI (n₍DI₎) = 50 (medium-term) or 1 (no smoothing)
Attention:\
NEVER use in isolation. Always in combination with price action analysis (trendlines, support/resistance, candlestick patterns).
Especially during volatile news phases, RawDI can fluctuate strongly → EMA\_DI helps to avoid false signals.
---
Conclusion The Demand Index by James Sibbet is a powerful filter to assess price movements by their volume backing. It shows whether a rally is truly driven by demand or merely a short-term volume anomaly. In combination with classic chart analysis and risk management, it helps to identify robust entry points and potential trend reversals earlier.

AltcoinEvreni Entry/TP RR ToolMulti-Entry / Take-Profit Risk-Reward Tool
This indicator is designed to help traders visually plan and manage their trade entries, take-profit targets, stop-loss levels, and risk/reward calculations directly on the chart.
Key Features:
--- Up to 3 customizable entry levels with separate position sizing for each.
--- Up to 5 take-profit (TP) levels, each with individual allocation percentages.
--- Automatic calculation of weighted average entry price.
--- Dynamic risk and potential profit calculation based on your inputs.
--- Visual colored zones for entry, stop-loss, and take-profit areas on the chart.
--- Adjustable leverage and margin for position sizing.
--- Informative floating table displaying position type, entries, stop-loss, risk in $, potential
--- profit in $, and overall RR ratio.
--- Fully customizable appearance (colors, box width, table font size, etc.).
How to Use:
1- Set your trade direction (Long or Short).
2- Enter your planned entry prices, allocation percentages, and stop-loss.
3- Configure your take-profit levels and their respective allocation percentages.
4- Adjust margin, leverage, and visual preferences as desired.
5- The tool will display all relevant zones and statistics, helping you make better risk-managed trading decisions.
Notes:
--- All calculations and drawings update dynamically as you change your parameters.
--- Works on any symbol and timeframe.
--- For educational and planning purposes – always use your own judgment and risk management.

Candle/Keltner Channels BUY SELLWhy Use Candlesticks?
They help traders visualize price action
Used in technical analysis and price pattern recognition (e.g., Doji, Engulfing, Hammer)
Assist in determining entry and exit points
Why Traders Use Keltner Channels?
Keltner Channels are widely used by traders for identifying trends, detecting volatility, and spotting trade opportunities.
1. Trend Identification
The middle line (EMA) shows the general trend.
If price consistently stays above the middle line, it indicates a strong uptrend.
If price stays below, it signals a downtrend.
Use: Traders follow the trend direction to enter trades in line with momentum.
2. Volatility Measurement
The width of the channel expands and contracts based on Average True Range (ATR).
Wider channels = high volatility, tighter channels = low volatility.
Use: Helps traders decide when to expect breakouts or calm periods.
3. Breakout Signals
A break above the upper band can signal a bullish breakout.
A break below the lower band can signal a bearish breakout.
Use: Traders use this for momentum trading and breakout entries.
4. Overbought/Oversold Conditions
Price touching or crossing the upper band may suggest it's overbought.
Price touching or crossing the lower band may suggest it's oversold.
Use: Traders combine this with RSI or MACD to confirm reversal setups.
5. Trade Entry and Exit
When price pulls back to the middle EMA during a trend, it may present a buy/sell opportunity.
Exits can also be planned if price returns inside the bands after a breakout.
Use: Helps with precise entry and exit timing.
6. Combines Well With Other Indicators
Commonly used with:
RSI (for confirmation)
MACD (for momentum)
Candlestick patterns (for price action signals)
Combining Candlestick Patterns with Keltner Channels gives traders a powerful method to confirm entries, spot reversals, and improve accuracy. Here’s why this combination works so well:
1. Context for Candlestick Signals
Candlestick patterns (like doji, engulfing, or pin bars) show potential price reversals, but they need context to be reliable. Keltner Channels provide that context:
A bullish candlestick near the lower band suggests a stronger buy signal.
A bearish candlestick near the upper band strengthens a sell signal.
2. Filtering False Signals
Candlestick patterns occur frequently, and not all are meaningful.
The location within the Keltner Channel helps filter out weak or false patterns.
Example: A bullish engulfing candle outside the lower band = high-probability reversal.
3. Improved Entry Timing
Traders wait for a candlestick pattern confirmation when price touches or crosses a Keltner band.
This avoids premature entries and allows tighter stop-losses.
4. Better Risk-Reward Setup
Candlestick entry near channel extremes (upper/lower band) lets traders place stop-losses just beyond recent highs/lows.
The target can be the opposite side of the channel or the middle EMA.
5. Visual Simplicity
Keltner Channels + Candles are visually intuitive.
Even beginner traders can easily recognize:
Overextended candles near channel edges.
Confirmed breakouts or reversals.
This Timeframe 5 min : XAUUSD

[blackcat] L2 EMA NexusOVERVIEW
The L2 EMA Nexus is a comprehensive trading indicator that utilizes a three-tiered Exponential Moving Average (EMA) system to identify potential trading opportunities. This script combines technical analysis with robust risk management features to help traders make informed decisions.
KEY FEATURES
• Triple EMA Analysis:
Customizable source inputs for each EMA
Adjustable length parameters (3, 8, 21 periods)
Dynamic color coding based on trend direction
Real-time price action monitoring
• Advanced Entry Signals:
High-low price action verification
EMA cross-overs and cross-unders
Multi-timeframe trend confirmation
Dynamic position sizing limits
• Risk Management:
Configurable Take Profit levels
Flexible Stop Loss settings
Optional TP/SL activation
Clear visual indicators for levels
HOW TO USE
Setup Initial Parameters:
Configure EMA lengths for your timeframe
Set Take Profit percentage (default 25%)
Define Stop Loss percentage (default 2.5%)
Adjust pyramiding limit as needed
Enable/Disable Features:
Toggle TP/SL settings based on strategy
Customize alert conditions
Modify visual labels for clarity
Monitor Trading Signals:
Watch for buy/sell labels
Track TP/SL levels
Monitor position status
TRADE MANAGEMENT
• Entry Conditions:
Long Entry: Higher high with rising EMA1 and stable EMA3
Short Entry: Lower low with falling EMA1 and stable EMA2
• Exit Conditions:
Take Profit: Price reaches defined percentage above/below entry
Stop Loss: Price reaches defined percentage below/above entry
• Position Control:
Limited to specified number of positions
Automatic position tracking
Clear visual indication of current trades
TECHNICAL DETAILS
• EMA Calculation:
Uses Exponential Moving Average for trend following
Color-coded based on 2-bar trend direction
Multiple timeframe compatibility
• Label System:
Clear buy/sell markers
Take Profit and Stop Loss indicators
Real-time position status updates
• Alert Configuration:
Customizable alert messages
Multiple alert conditions
Option to enable/disable specific alerts
LIMITATIONS
⚠️ Important Considerations:
Results may vary across different market conditions
Historical performance does not guarantee future results
Always backtest strategy before live trading
Consider complementing with additional analysis tools
BEST PRACTICES
• Recommended Timeframes:
Daily charts for long-term strategies
4-hour charts for swing trading
1-hour charts for short-term trading
• Risk Management Tips:
Start with small position sizes
Always use TP/SL in live trading
Monitor market volatility before entering trades
TROUBLESHOOTING
• Common Issues:
Ensure proper chart resolution
Verify alert conditions are enabled
Check for conflicting indicators
• Performance Optimization:
Use appropriate timeframe for your strategy
Adjust indicator parameters based on market conditions
Monitor for potential overfitting
StatPivot- Dynamic Range Analyzer - indicator [PresentTrading]Hello everyone! In the following few open scripts, I would like to share various statistical tools that benefit trading. For this time, it is a powerful indicator called StatPivot- Dynamic Range Analyzer that brings a whole new dimension to your technical analysis toolkit.
This tool goes beyond traditional pivot point analysis by providing comprehensive statistical insights about price movements, helping you identify high-probability trading opportunities based on historical data patterns rather than subjective interpretations. Whether you're a day trader, swing trader, or position trader, StatPivot's real-time percentile rankings give you a statistical edge in understanding exactly where current price action stands within historical contexts.
Welcome to share your opinions! Looking forward to sharing the next tool soon!
█ Introduction and How it is Different
StatPivot is an advanced technical analysis tool that revolutionizes retracement analysis. Unlike traditional pivot indicators that only show static support/resistance levels, StatPivot delivers dynamic statistical insights based on historical pivot patterns.
Its key innovation is real-time percentile calculation - while conventional tools require new pivot formations before updating (often too late for trading decisions), StatPivot continuously analyzes where current price stands within historical retracement distributions.
Furthermore, StatPivot provides comprehensive statistical metrics including mean, median, standard deviation, and percentile distributions of price movements, giving traders a probabilistic edge by revealing which price levels represent statistically significant zones for potential reversals or continuations. By transforming raw price data into statistical insights, StatPivot helps traders move beyond subjective price analysis to evidence-based decision making.
█ Strategy, How it Works: Detailed Explanation
🔶 Pivot Point Detection and Analysis
The core of StatPivot's functionality begins with identifying significant pivot points in the price structure. Using the parameters left and right, the indicator locates pivot highs and lows by examining a specified number of bars to the left and right of each potential pivot point:
Copyp_low = ta.pivotlow(low, left, right)
p_high = ta.pivothigh(high, left, right)
For a point to qualify as a pivot low, it must have left higher lows to its left and right higher lows to its right. Similarly, a pivot high must have left lower highs to its left and right lower highs to its right. This approach ensures that only significant turning points are recognized.
🔶 Percentage Change Calculation
Once pivot points are identified, StatPivot calculates the percentage changes between consecutive pivot points:
For drops (when a pivot low is lower than the previous pivot low):
CopydropPercent = (previous_pivot_low - current_pivot_low) / previous_pivot_low * 100
For rises (when a pivot high is higher than the previous pivot high):
CopyrisePercent = (current_pivot_high - previous_pivot_high) / previous_pivot_high * 100
These calculations quantify the magnitude of each market swing, allowing for statistical analysis of historical price movements.
🔶 Statistical Distribution Analysis
StatPivot computes comprehensive statistics on the historical distribution of drops and rises:
Average (Mean): The arithmetic mean of all recorded percentage changes
CopyavgDrop = array.avg(dropValues)
Median: The middle value when all percentage changes are arranged in order
CopymedianDrop = array.median(dropValues)
Standard Deviation: Measures the dispersion of percentage changes from the average
CopystdDevDrop = array.stdev(dropValues)
Percentiles (25th, 75th): Values below which 25% and 75% of observations fall
Copyq1 = array.get(sorted, math.floor(cnt * 0.25))
q3 = array.get(sorted, math.floor(cnt * 0.75))
VaR95: The maximum expected percentage drop with 95% confidence
Copyvar95D = array.get(sortedD, math.floor(nD * 0.95))
Coefficient of Variation (CV): Measures relative variability
CopycvD = stdDevDrop / avgDrop
These statistics provide a comprehensive view of market behavior, enabling traders to understand the typical ranges and extreme moves.
🔶 Real-time Percentile Ranking
StatPivot's most innovative feature is its real-time percentile calculation. For each current price, it calculates:
The percentage drop from the latest pivot high:
CopycurrentDropPct = (latestPivotHigh - close) / latestPivotHigh * 100
The percentage rise from the latest pivot low:
CopycurrentRisePct = (close - latestPivotLow) / latestPivotLow * 100
The percentile ranks of these values within the historical distribution:
CopyrealtimeDropRank = (count of historical drops <= currentDropPct) / total drops * 100
This calculation reveals exactly where the current price movement stands in relation to all historical movements, providing crucial context for decision-making.
🔶 Cluster Analysis
To identify the most common retracement zones, StatPivot performs a cluster analysis by dividing the range of historical drops into five equal intervals:
CopyrangeSize = maxVal - minVal
For each interval boundary:
Copyboundaries = minVal + rangeSize * i / 5
By counting the number of observations in each interval, the indicator identifies the most frequently occurring retracement zones, which often serve as significant support or resistance areas.
🔶 Expected Price Targets
Using the statistical data, StatPivot calculates expected price targets:
CopytargetBuyPrice = close * (1 - avgDrop / 100)
targetSellPrice = close * (1 + avgRise / 100)
These targets represent statistically probable price levels for potential entries and exits based on the average historical behavior of the market.
█ Trade Direction
StatPivot functions as an analytical tool rather than a direct trading signal generator, providing statistical insights that can be applied to various trading strategies. However, the data it generates can be interpreted for different trade directions:
For Long Trades:
Entry considerations: Look for price drops that reach the 70-80th percentile range in the historical distribution, suggesting a statistically significant retracement
Target setting: Use the Expected Sell price or consider the average rise percentage as a reasonable target
Risk management: Set stop losses below recent pivot lows or at a distance related to the statistical volatility (standard deviation)
For Short Trades:
Entry considerations: Look for price rises that reach the 70-80th percentile range, indicating an unusual extension
Target setting: Use the Expected Buy price or average drop percentage as a target
Risk management: Set stop losses above recent pivot highs or based on statistical measures of volatility
For Range Trading:
Use the most common drop and rise clusters to identify probable reversal zones
Trade bounces between these statistically significant levels
For Trend Following:
Confirm trend strength by analyzing consecutive higher pivot lows (uptrend) or lower pivot highs (downtrend)
Use lower percentile retracements (20-30th percentile) as entry opportunities in established trends
█ Usage
StatPivot offers multiple ways to integrate its statistical insights into your trading workflow:
Statistical Table Analysis: Review the comprehensive statistics displayed in the data table to understand the market's behavior. Pay particular attention to:
Average drop and rise percentages to set reasonable expectations
Standard deviation to gauge volatility
VaR95 for risk assessment
Real-time Percentile Monitoring: Watch the real-time percentile display to see where the current price movement stands within the historical distribution. This can help identify:
Extreme movements (90th+ percentile) that might indicate reversal opportunities
Typical retracements (40-60th percentile) that might continue further
Shallow pullbacks (10-30th percentile) that might represent continuation opportunities in trends
Support and Resistance Identification: Utilize the plotted pivot points as key support and resistance levels, especially when they align with statistically significant percentile ranges.
Target Price Setting: Use the expected buy and sell prices calculated from historical averages as initial targets for your trades.
Risk Management: Apply the statistical measurements like standard deviation and VaR95 to set appropriate stop loss levels that account for the market's historical volatility.
Pattern Recognition: Over time, learn to recognize when certain percentile levels consistently lead to reversals or continuations in your specific market, and develop personalized strategies based on these observations.
█ Default Settings
The default settings of StatPivot have been carefully calibrated to provide reliable statistical analysis across a variety of markets and timeframes, but understanding their effects allows for optimal customization:
Left Bars (30) and Right Bars (30): These parameters determine how pivot points are identified. With both set to 30 by default:
A pivot low must be the lowest point among 30 bars to its left and 30 bars to its right
A pivot high must be the highest point among 30 bars to its left and 30 bars to its right
Effect on performance: Larger values create fewer but more significant pivot points, reducing noise but potentially missing important market structures. Smaller values generate more pivot points, capturing more nuanced movements but potentially including noise.
Table Position (Top Right): Determines where the statistical data table appears on the chart.
Effect on performance: No impact on analytical performance, purely a visual preference.
Show Distribution Histogram (False): Controls whether the distribution histogram of drop percentages is displayed.
Effect on performance: Enabling this provides visual insight into the distribution of retracements but can clutter the chart.
Show Real-time Percentile (True): Toggles the display of real-time percentile rankings.
Effect on performance: A critical setting that enables the dynamic analysis of current price movements. Disabling this removes one of the key advantages of the indicator.
Real-time Percentile Display Mode (Label): Chooses between label display or indicator line for percentile rankings.
Effect on performance: Labels provide precise information at the current price point, while indicator lines show the evolution of percentile rankings over time.
Advanced Considerations for Settings Optimization:
Timeframe Adjustment: Higher timeframes generally benefit from larger Left/Right values to identify truly significant pivots, while lower timeframes may require smaller values to capture shorter-term swings.
Volatility-Based Tuning: In highly volatile markets, consider increasing the Left/Right values to filter out noise. In less volatile conditions, lower values can help identify more potential entry and exit points.
Market-Specific Optimization: Different markets (forex, stocks, commodities) display different retracement patterns. Monitor the statistics table to see if your market typically shows larger or smaller retracements than the current settings are optimized for.
Trading Style Alignment: Adjust the settings to match your trading timeframe. Day traders might prefer settings that identify shorter-term pivots (smaller Left/Right values), while swing traders benefit from more significant pivots (larger Left/Right values).
By understanding how these settings affect the analysis and customizing them to your specific market and trading style, you can maximize the effectiveness of StatPivot as a powerful statistical tool for identifying high-probability trading opportunities.

Penny King**Penny King Trend Indicator**
The **Penny King** is a powerful and versatile trend-following indicator designed to assist traders in identifying market trends and dynamic support/resistance levels. This tool effectively leverages Adaptive True Range (ATR) and Exponential Moving Average (EMA) or a Delta Price method to establish a trailing stop level, ensuring traders can capture strong trends while minimizing risk.
### **Key Features:**
1. **Dual Calculation Modes:**
- **ATR & EMA-Based Mode (Mode 0)**: Uses ATR (Average True Range) and EMA (Exponential Moving Average) to determine the trailing stop level dynamically.
- **Delta Price Mode (Mode 1)**: Utilizes a fixed price change threshold (Delta Price) to define stop levels based on market volatility.
2. **Adjustable Parameters for Customization:**
- **Range (akk_range)**: Defines the lookback period for the ATR calculation.
- **IMA Range (ima_range)**: Specifies the EMA smoothing factor applied to the ATR.
- **Factor (akk_factor)**: Multiplier applied to the ATR-based calculation to refine trailing stop sensitivity.
- **Delta Price (DeltaPrice)**: Fixed price-based stop level for an alternative trend calculation.
3. **Intelligent Trailing Stop Mechanism:**
- The trailing stop level dynamically adjusts based on price movement, following the trend while preventing premature exits.
- If the price moves in favor of the trend, the stop level is adjusted accordingly to lock in profits.
- If the price reverses against the trend, the stop level remains intact until a new trend direction is established.
4. **Efficient Market Adaptability:**
- The ATR-based method ensures adaptability to changing market conditions, expanding stop levels in high volatility and tightening them in low volatility periods.
- The Delta Price method offers a fixed approach, ideal for traders who prefer a non-ATR-based system for managing stop levels.
5. **Clean Visual Representation:**
- The indicator plots a clear, orange-colored trend stop line that dynamically follows the market movement.
- Provides a visual cue to determine potential entry and exit points efficiently.
### **How to Use:**
- **Trend Confirmation:**
- If the price remains above the trend stop line, it signals a bullish trend.
- If the price falls below the trend stop line, it indicates a bearish trend.
- **Trade Entries & Exits:**
- Consider long positions when the price remains above the trend stop.
- Consider short positions when the price stays below the trend stop.
- Utilize the trend stop line as a dynamic trailing stop-loss mechanism to protect gains and minimize losses.
- **Parameter Optimization:**
- Adjust the **Range**, **IMA Range**, and **Factor** to optimize settings based on the trading asset and time frame.
- Experiment with **Delta Price Mode** for assets where fixed price-based trailing stops are more effective.
### **Conclusion:**
The **Penny King Trend Indicator** is an essential tool for traders looking to capture market trends while ensuring effective risk management. Whether you prefer ATR-based adaptability or a fixed price stop approach, this indicator provides the flexibility needed to navigate different market conditions successfully. By integrating the **Penny King**, traders can enhance their trading strategy with a reliable and efficient trend-following system.
